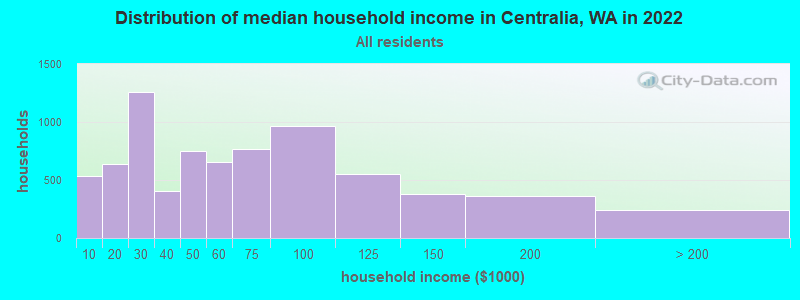
The median household income in Centralia, WA in 2022 was $51,786, which was 76.3% less than the median annual income of $91,306 across the entire state of Washington. Compared to the median income of $30,078 in 2000 this represents an increase of 41.9%. The per capita income in 2022 was $29,244, which means an increase of 44.2% compared to 2000 when it was $16,305.
Whole page based on the data from 2000 / 2022 when the population of Centralia, Washington was 14,742 / 18,831
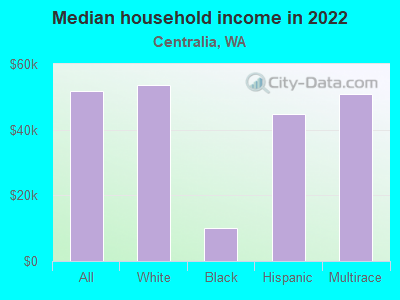
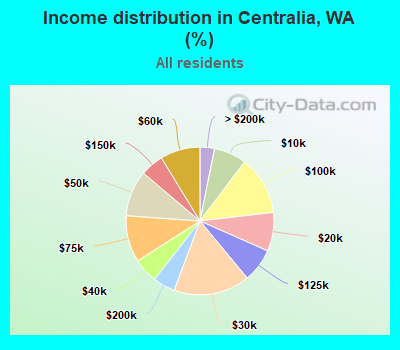
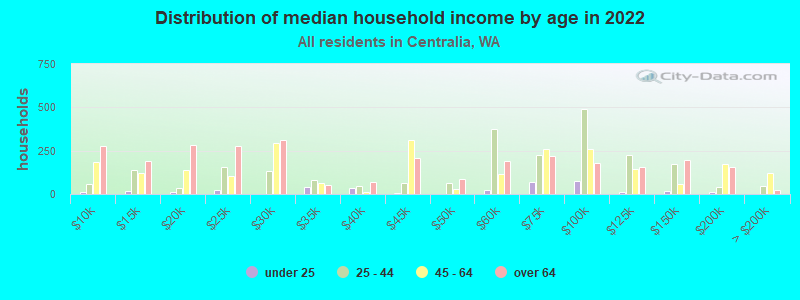
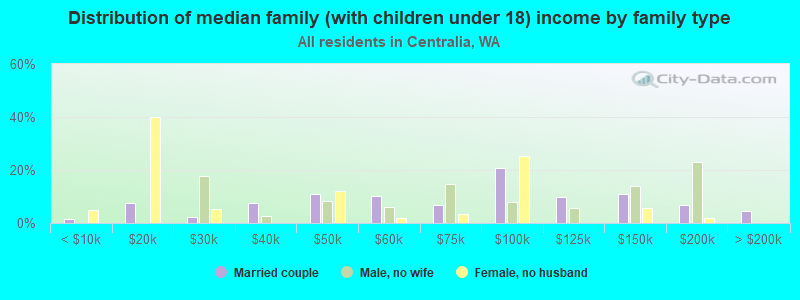
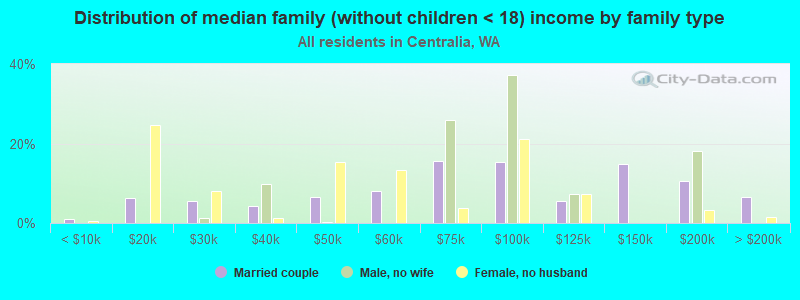
Income statistics for all residents
Median household income in Centralia, WA in 2022:
Centralia:
$51,787
State:
$91,306
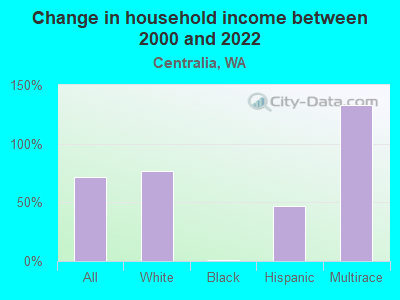
Change in median household income between 2000 and 2022:
Centralia, Washington:
+72.2%
State:
+99.5%
Number of households with income < $10k:
Centralia:
7.1% (536)
Washington:
4.5% (139,331)
Number of households with income $10k - 20k:
Centralia:
8.5% (639)
State:
5.0% (154,508)
Number of households with income $20k - 30k:
Centralia:
16.7% (1,256)
State:
5.4% (166,555)
Number of households with income $30k - 40k:
Centralia:
5.4% (407)
State:
5.5% (170,324)
Number of households with income $40k - 50k:
Centralia:
10.0% (754)
State:
6.0% (183,941)
Number of households with income $50k - 60k:
Centralia:
8.7% (657)
State:
6.1% (187,395)
Number of households with income $60k - 75k:
Centralia:
10.2% (770)
Washington:
8.7% (266,771)
Number of households with income $75k - 100k:
Centralia:
12.8% (967)
State:
13.1% (404,672)
Number of households with income $100k - 125k:
Centralia:
7.4% (555)
State:
11.0% (337,911)
Number of households with income $125k - 150k:
Centralia:
5.1% (382)
Washington:
8.0% (244,934)
Number of households with income $150k - 200k:
Centralia:
4.8% (364)
State:
10.5% (323,812)
Number of households with income > $200k:
Centralia:
3.2% (239)
State:
16.2% (499,799)
Aggregate household income in Centralia in 2022: $521,567,007
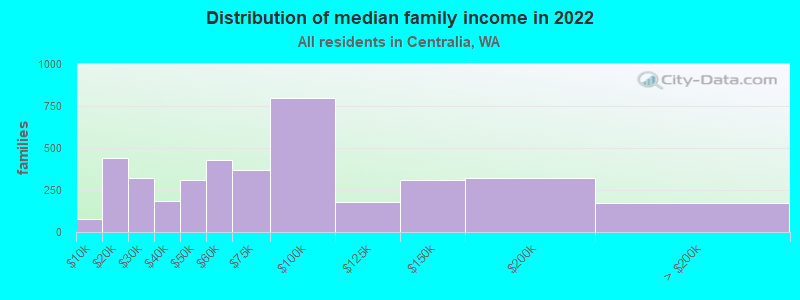
Median family income in Centralia in 2022:
Centralia:
$71,627
State:
$109,192
Number of families with income < $10k:
Centralia:
2.0% (80)
Washington:
2.9% (55,953)
Number of families with income $10k - 20k:
Centralia:
11.2% (439)
State:
2.6% (50,138)
Number of families with income $20k - 30k:
Centralia:
8.2% (323)
Washington:
3.2% (61,974)
Number of families with income $30k - 40k:
Centralia:
4.7% (185)
Washington:
4.1% (80,240)
Number of families with income $40k - 50k:
Centralia:
7.9% (311)
State:
4.9% (94,310)
Number of families with income $50k - 60k:
Centralia:
10.9% (426)
Washington:
5.3% (101,674)
Number of families with income $60k - 75k:
Centralia:
9.5% (372)
State:
8.2% (158,348)
Number of families with income $75k - 100k:
Centralia:
20.3% (795)
State:
13.8% (267,812)
Number of families with income $100k - 125k:
Centralia:
4.6% (180)
State:
12.4% (240,213)
Number of families with income $125k - 150k:
Centralia:
8.0% (312)
Washington:
9.3% (180,011)
Number of families with income $150k - 200k:
Centralia:
8.2% (321)
Washington:
13.0% (250,874)
Number of families with income > $200k:
Centralia:
4.4% (172)
Washington:
20.4% (393,898)
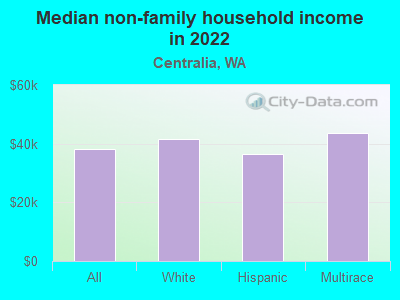
Median non-family income in Centralia in 2022:
Centralia:
$38,022
Washington:
$57,299
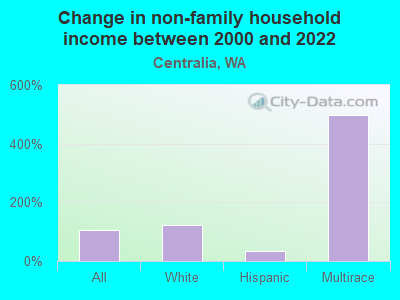
Change in median non-family income between 2000 and 2022:
Centralia, Washington:
+104.4%
State:
+94.9%
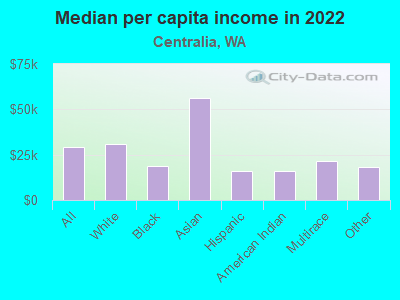
Median per capita income in Centralia in 2022:
Centralia:
$29,245
State:
$50,764
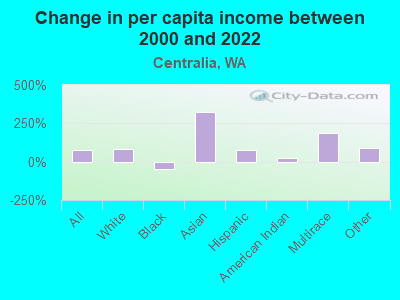
Change in median per capita income between 2000 and 2022:
Centralia, Washington:
+79.4%
State:
+121.0%
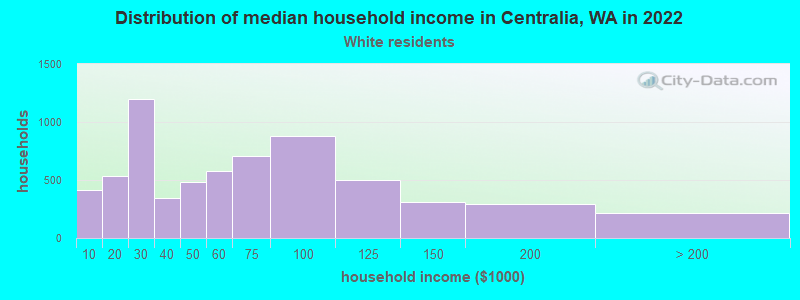
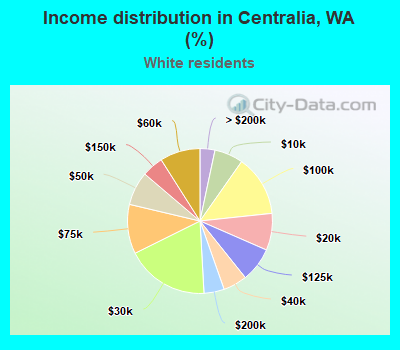
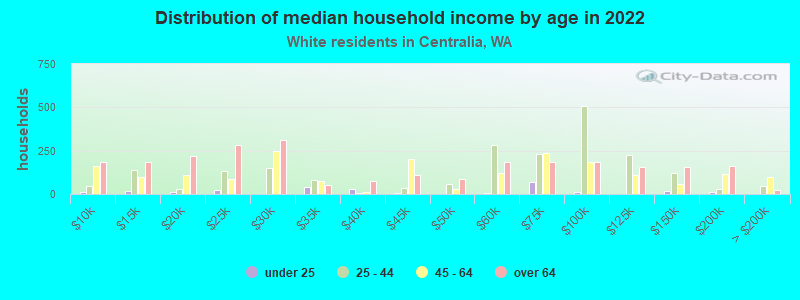
Income statistics for White residents
Median household income in Centralia, WA in 2022:
Centralia:
$53,545
State:
$91,916
Change in median household income between 2000 and 2022:
Centralia, Washington:
+76.7%
State:
+95.4%
Number of households with income < $10k:
Centralia:
6.4% (413)
State:
4.3% (95,850)
Number of households with income $10k - 20k:
Centralia:
8.2% (531)
State:
4.8% (106,421)
Number of households with income $20k - 30k:
Centralia:
18.5% (1,196)
State:
5.5% (122,860)
Number of households with income $30k - 40k:
Centralia:
5.3% (345)
Washington:
5.4% (119,627)
Number of households with income $40k - 50k:
Centralia:
7.5% (486)
State:
5.9% (132,276)
Number of households with income $50k - 60k:
Centralia:
9.0% (579)
State:
6.1% (136,212)
Number of households with income $60k - 75k:
Centralia:
11.0% (711)
Washington:
8.8% (196,086)
Number of households with income $75k - 100k:
Centralia:
13.6% (876)
State:
13.4% (299,192)
Number of households with income $100k - 125k:
Centralia:
7.7% (497)
Washington:
11.3% (252,209)
Number of households with income $125k - 150k:
Centralia:
4.8% (309)
State:
7.9% (175,962)
Number of households with income $150k - 200k:
Centralia:
4.5% (291)
Washington:
10.7% (239,156)
Number of households with income > $200k:
Centralia:
3.3% (215)
Washington:
16.1% (359,917)
Aggregate household income in Centralia in 2022: $447,448,423
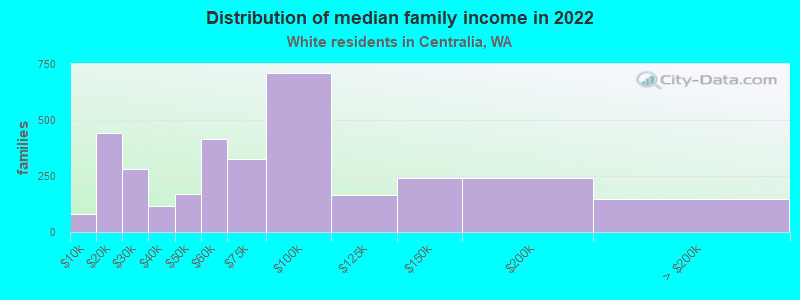
Median family income in Centralia in 2022:
Centralia:
$69,926
State:
$112,511
Number of families with income < $10k:
Centralia:
2.4% (81)
State:
2.4% (33,676)
Number of families with income $10k - 20k:
Centralia:
13.3% (444)
State:
2.0% (28,228)
Number of families with income $20k - 30k:
Centralia:
8.4% (282)
State:
2.9% (39,288)
Number of families with income $30k - 40k:
Centralia:
3.5% (116)
State:
3.6% (50,190)
Number of families with income $40k - 50k:
Centralia:
5.1% (171)
State:
4.6% (63,009)
Number of families with income $50k - 60k:
Centralia:
12.4% (413)
Washington:
5.0% (69,270)
Number of families with income $60k - 75k:
Centralia:
9.8% (327)
Washington:
8.2% (112,369)
Number of families with income $75k - 100k:
Centralia:
21.2% (709)
Washington:
14.1% (194,214)
Number of families with income $100k - 125k:
Centralia:
4.9% (165)
State:
13.2% (182,184)
Number of families with income $125k - 150k:
Centralia:
7.1% (239)
Washington:
9.5% (130,928)
Number of families with income $150k - 200k:
Centralia:
7.2% (242)
State:
13.7% (188,621)
Number of families with income > $200k:
Centralia:
4.5% (149)
Washington:
20.8% (285,982)
Median non-family income in Centralia in 2022:
Centralia:
$41,520
State:
$56,103
Change in median non-family income between 2000 and 2022:
Centralia, Washington:
+121.8%
State:
+87.7%
Median per capita income in Centralia in 2022:
Centralia:
$30,954
State:
$55,212
Change in median per capita income between 2000 and 2022:
Centralia, Washington:
+81.7%
Washington:
+123.8%
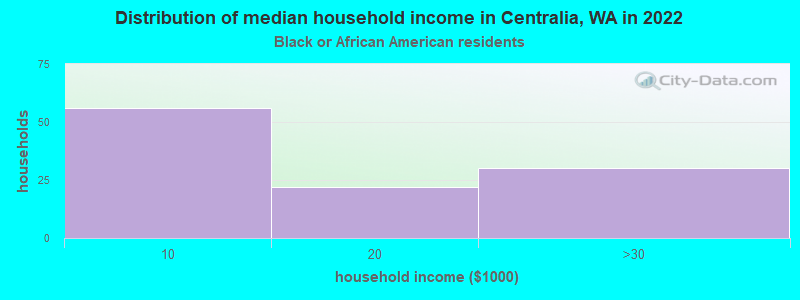
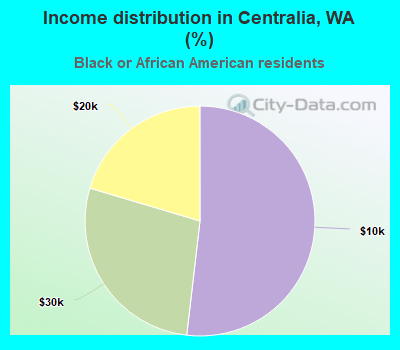
Income statistics for Black or African American residents
Median household income in Centralia, WA in 2022:
Centralia:
$9,973
State:
$68,202
Change in median household income between 2000 and 2022:
Centralia, Washington:
+1.4%
State:
+89.9%
Number of households with income < $10k:
Centralia:
51.9% (56)
State:
7.2% (8,014)
Number of households with income $10k - 20k:
Centralia:
20.4% (22)
State:
8.0% (8,904)
Number of households with income $20k - 30k:
Centralia:
27.8% (30)
State:
7.4% (8,207)
Number of households with income $30k - 40k:
Centralia:
0.0% (0)
State:
5.6% (6,220)
Number of households with income $40k - 50k:
Centralia:
0.0% (0)
Washington:
9.5% (10,585)
Number of households with income $50k - 60k:
Centralia:
0.0% (0)
State:
7.3% (8,078)
Number of households with income $60k - 75k:
Centralia:
0.0% (0)
State:
8.7% (9,704)
Number of households with income $75k - 100k:
Centralia:
0.0% (0)
Washington:
12.9% (14,315)
Number of households with income $100k - 125k:
Centralia:
0.0% (0)
Washington:
7.7% (8,592)
Number of households with income $125k - 150k:
Centralia:
0.0% (0)
Washington:
8.9% (9,840)
Number of households with income $150k - 200k:
Centralia:
0.0% (0)
Washington:
7.6% (8,434)
Number of households with income > $200k:
Centralia:
0.0% (0)
State:
9.1% (10,075)
Aggregate household income in Centralia in 2022: $1,330,238
Median per capita income in Centralia in 2022:
Centralia:
$18,484
State:
$38,209
Change in median per capita income between 2000 and 2022:: -46.2%
Centralia, Washington:
-46.2%
State:
+115.3%
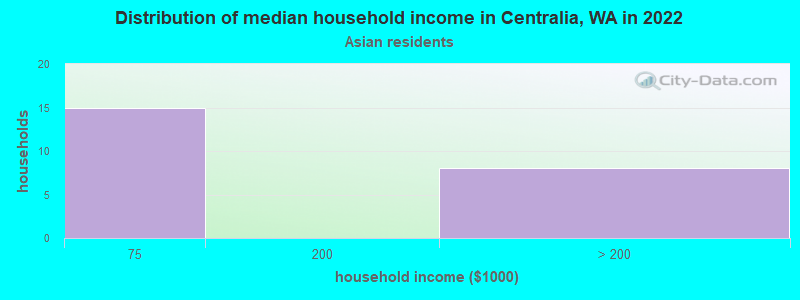
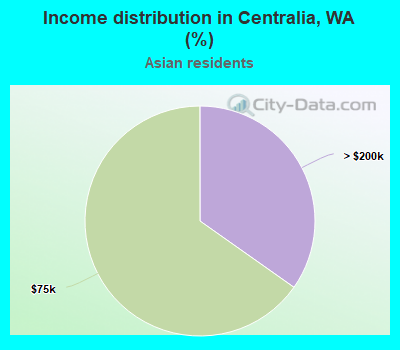
Income statistics for Asian residents
Number of households with income < $10k:
Centralia:
0.0% (0)
State:
4.9% (14,099)
Number of households with income $10k - 20k:
Centralia:
0.0% (0)
State:
3.5% (9,873)
Number of households with income $20k - 30k:
Centralia:
0.0% (0)
State:
2.9% (8,352)
Number of households with income $30k - 40k:
Centralia:
0.0% (0)
State:
4.0% (11,415)
Number of households with income $40k - 50k:
Centralia:
0.0% (0)
Washington:
4.0% (11,421)
Number of households with income $50k - 60k:
Centralia:
0.0% (0)
Washington:
4.2% (12,100)
Number of households with income $60k - 75k:
Centralia:
65.2% (15)
State:
6.3% (17,903)
Number of households with income $75k - 100k:
Centralia:
0.0% (0)
State:
10.4% (29,663)
Number of households with income $100k - 125k:
Centralia:
0.0% (0)
State:
9.4% (26,839)
Number of households with income $125k - 150k:
Centralia:
0.0% (0)
Washington:
8.5% (24,200)
Number of households with income $150k - 200k:
Centralia:
0.0% (0)
State:
12.6% (35,976)
Number of households with income > $200k:
Centralia:
34.8% (8)
State:
29.2% (83,109)
Aggregate household income in Centralia in 2022: $9,296,908
Median per capita income in Centralia in 2022:
Centralia:
$56,446
State:
$67,666
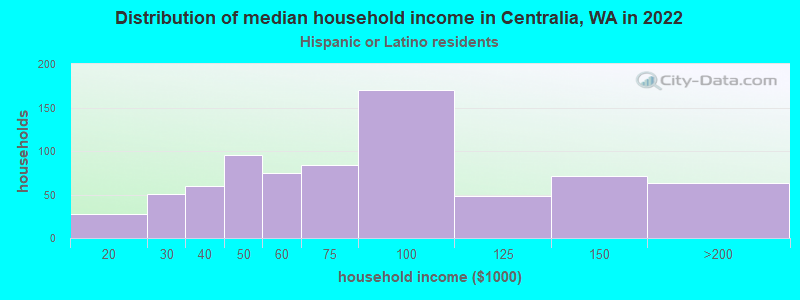
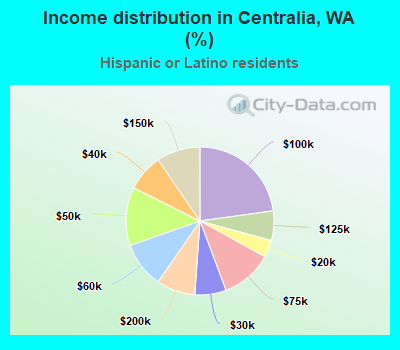
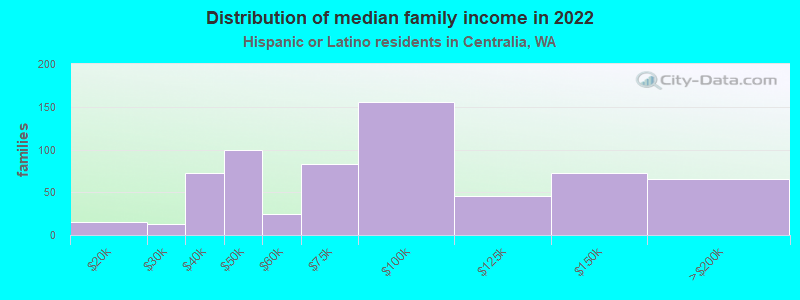
Income statistics for Hispanic or Latino residents
Median household income in Centralia, WA in 2022:
Centralia:
$44,906
Washington:
$74,770
Change in median household income between 2000 and 2022:
Centralia, Washington:
+47.2%
State:
+128.3%
Number of households with income < $10k:
Centralia:
0.0% (0)
Washington:
4.9% (14,456)
Number of households with income $10k - 20k:
Centralia:
3.8% (28)
State:
5.3% (15,449)
Number of households with income $20k - 30k:
Centralia:
6.8% (51)
State:
6.8% (20,016)
Number of households with income $30k - 40k:
Centralia:
8.1% (60)
State:
7.7% (22,548)
Number of households with income $40k - 50k:
Centralia:
12.8% (95)
State:
7.3% (21,450)
Number of households with income $50k - 60k:
Centralia:
10.1% (75)
State:
7.7% (22,744)
Number of households with income $60k - 75k:
Centralia:
11.3% (84)
State:
10.5% (30,737)
Number of households with income $75k - 100k:
Centralia:
22.8% (170)
State:
14.9% (43,843)
Number of households with income $100k - 125k:
Centralia:
6.4% (48)
Washington:
11.1% (32,554)
Number of households with income $125k - 150k:
Centralia:
9.5% (71)
State:
7.4% (21,624)
Number of households with income $150k - 200k:
Centralia:
8.5% (63)
Washington:
7.3% (21,360)
Number of households with income > $200k:
Centralia:
0.0% (0)
State:
9.2% (27,055)
Aggregate household income in Centralia in 2022: $50,125,399
Median family income in Centralia in 2022:
Centralia:
$93,225
Washington:
$76,866
Number of families with income $10k - 20k:
Centralia:
2.3% (15)
State:
3.5% (7,524)
Number of families with income $20k - 30k:
Centralia:
2.0% (13)
State:
5.6% (12,052)
Number of families with income $30k - 40k:
Centralia:
11.1% (72)
State:
8.3% (17,803)
Number of families with income $40k - 50k:
Centralia:
15.4% (100)
State:
7.7% (16,361)
Number of families with income $50k - 60k:
Centralia:
3.9% (25)
State:
7.9% (16,852)
Number of families with income $60k - 75k:
Centralia:
12.8% (83)
State:
11.4% (24,342)
Number of families with income $75k - 100k:
Centralia:
24.0% (155)
Washington:
14.4% (30,698)
Number of families with income $100k - 125k:
Centralia:
7.1% (46)
State:
11.4% (24,331)
Number of families with income $125k - 150k:
Centralia:
11.2% (72)
State:
7.5% (16,099)
Number of families with income $150k - 200k:
Centralia:
10.2% (66)
State:
8.2% (17,551)
Median non-family income in Centralia in 2022:
Centralia:
$36,505
Washington:
$54,173
Change in median non-family income between 2000 and 2022:
Centralia, Washington:
+35.2%
State:
+105.8%
Median per capita income in Centralia in 2022:
Centralia:
$16,235
State:
$28,252
Change in median per capita income between 2000 and 2022:
Centralia, Washington:
+78.7%
State:
+150.2%
Income statistics for American Indian and Alaska Native residents
Aggregate household income in Centralia in 2022: $953,810
Median per capita income in Centralia in 2022:
Centralia:
$16,093
State:
$27,053
Change in median per capita income between 2000 and 2022:
Centralia, Washington:
+23.8%
State:
+98.6%
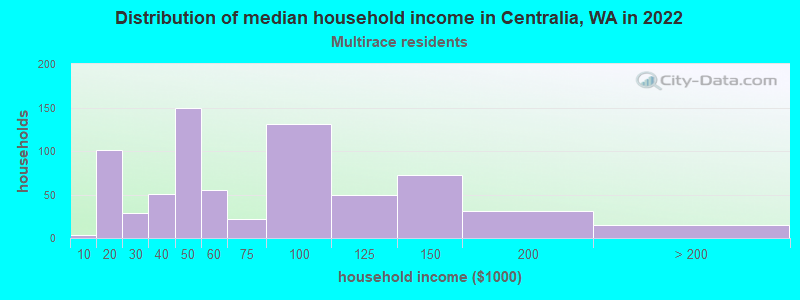
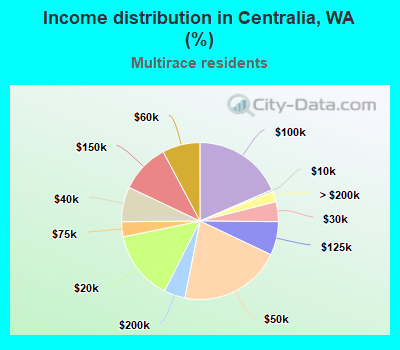
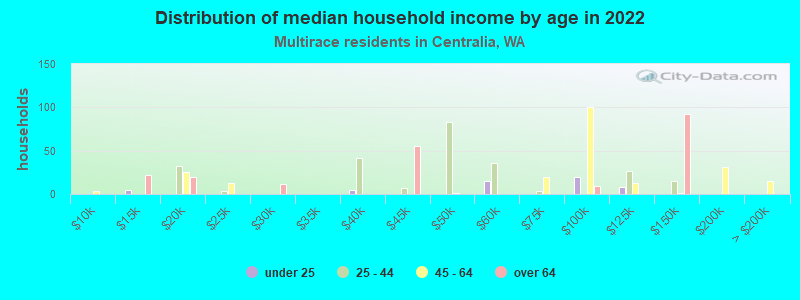
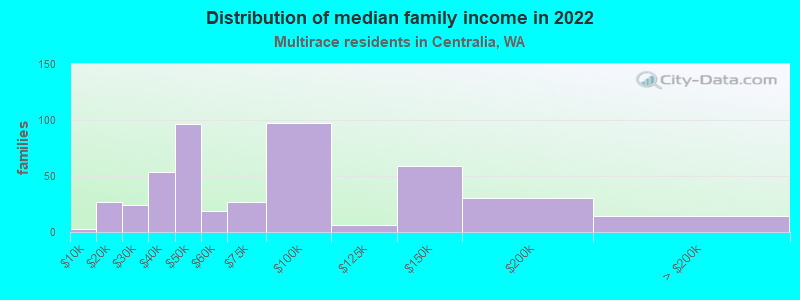
Income statistics for Multirace residents
Median household income in Centralia, WA in 2022:
Centralia:
$50,870
State:
$84,303
Change in median household income between 2000 and 2022:
Centralia, Washington:
+132.5%
Washington:
+125.7%
Number of households with income < $10k:
Centralia:
0.4% (3)
Washington:
4.3% (12,040)
Number of households with income $10k - 20k:
Centralia:
14.3% (101)
State:
6.6% (18,437)
Number of households with income $20k - 30k:
Centralia:
4.1% (29)
State:
5.2% (14,559)
Number of households with income $30k - 40k:
Centralia:
7.2% (51)
State:
6.7% (18,491)
Number of households with income $40k - 50k:
Centralia:
21.0% (149)
State:
6.3% (17,459)
Number of households with income $50k - 60k:
Centralia:
7.8% (55)
State:
6.9% (19,086)
Number of households with income $60k - 75k:
Centralia:
3.1% (22)
State:
9.1% (25,310)
Number of households with income $75k - 100k:
Centralia:
18.5% (131)
State:
13.5% (37,493)
Number of households with income $100k - 125k:
Centralia:
6.9% (49)
Washington:
10.7% (29,626)
Number of households with income $125k - 150k:
Centralia:
10.2% (72)
State:
8.6% (23,899)
Number of households with income $150k - 200k:
Centralia:
4.4% (31)
Washington:
10.2% (28,214)
Number of households with income > $200k:
Centralia:
2.1% (15)
State:
11.9% (32,947)
Aggregate household income in Centralia in 2022: $45,099,363
Median family income in Centralia in 2022:
Centralia:
$66,694
State:
$95,629
Number of families with income < $10k:
Centralia:
0.6% (3)
State:
3.5% (6,121)
Number of families with income $10k - 20k:
Centralia:
5.9% (27)
State:
4.3% (7,519)
Number of families with income $20k - 30k:
Centralia:
5.2% (24)
Washington:
4.4% (7,775)
Number of families with income $30k - 40k:
Centralia:
11.7% (54)
State:
5.8% (10,186)
Number of families with income $40k - 50k:
Centralia:
21.1% (96)
State:
5.9% (10,412)
Number of families with income $50k - 60k:
Centralia:
4.0% (18)
Washington:
5.6% (9,922)
Number of families with income $60k - 75k:
Centralia:
5.9% (27)
State:
9.7% (17,113)
Number of families with income $75k - 100k:
Centralia:
21.3% (97)
State:
13.6% (23,984)
Number of families with income $100k - 125k:
Centralia:
1.4% (6)
State:
10.4% (18,288)
Number of families with income $125k - 150k:
Centralia:
13.0% (59)
Washington:
10.5% (18,481)
Number of families with income $150k - 200k:
Centralia:
6.7% (31)
State:
11.9% (20,852)
Number of families with income > $200k:
Centralia:
3.2% (15)
State:
14.4% (25,289)
Median non-family income in Centralia in 2022:
Centralia:
$43,724
State:
$56,573
Median per capita income in Centralia in 2022:
Centralia:
$21,727
Washington:
$32,496
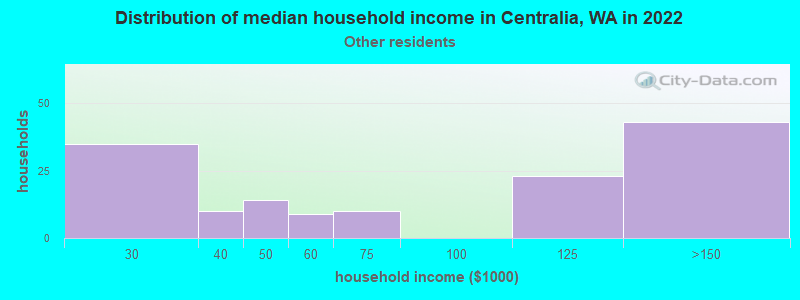
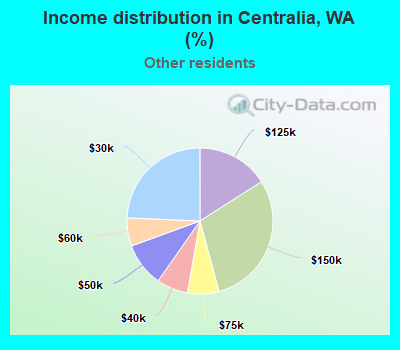
Income statistics for other residents
Number of households with income < $10k:
Centralia:
0.0% (0)
State:
5.3% (6,540)
Number of households with income $10k - 20k:
Centralia:
0.0% (0)
State:
6.0% (7,385)
Number of households with income $20k - 30k:
Centralia:
24.3% (35)
State:
7.5% (9,289)
Number of households with income $30k - 40k:
Centralia:
6.9% (10)
State:
8.9% (11,015)
Number of households with income $40k - 50k:
Centralia:
9.7% (14)
State:
7.6% (9,399)
Number of households with income $50k - 60k:
Centralia:
6.2% (9)
Washington:
7.2% (8,867)
Number of households with income $60k - 75k:
Centralia:
6.9% (10)
Washington:
10.5% (13,032)
Number of households with income $75k - 100k:
Centralia:
0.0% (0)
Washington:
14.6% (18,007)
Number of households with income $100k - 125k:
Centralia:
16.0% (23)
State:
12.2% (15,128)
Number of households with income $125k - 150k:
Centralia:
29.9% (43)
Washington:
5.6% (6,950)
Number of households with income $150k - 200k:
Centralia:
0.0% (0)
State:
7.1% (8,749)
Number of households with income > $200k:
Centralia:
0.0% (0)
State:
7.5% (9,208)
Aggregate household income in Centralia in 2022: $13,133,920
Median per capita income in Centralia in 2022:
Centralia:
$17,998
Washington:
$27,542
Change in median per capita income between 2000 and 2022:
Centralia, Washington:
+85.7%
State:
+167.8%
Discuss Centralia, Washington (WA) on our hugely popular Washington forum.