The median household income in Charleston, SC in 2022 was $83,103, which was 22.8% greater than the median annual income of $64,115 across the entire state of South Carolina. Compared to the median income of $35,295 in 2000 this represents an increase of 57.5%. The per capita income in 2022 was $56,341, which means an increase of 60.2% compared to 2000 when it was $22,414.
Whole page based on the data from 2000 / 2022 when the population of Charleston, South Carolina was 96,650 / 153,743
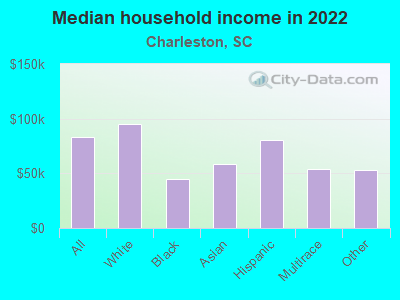
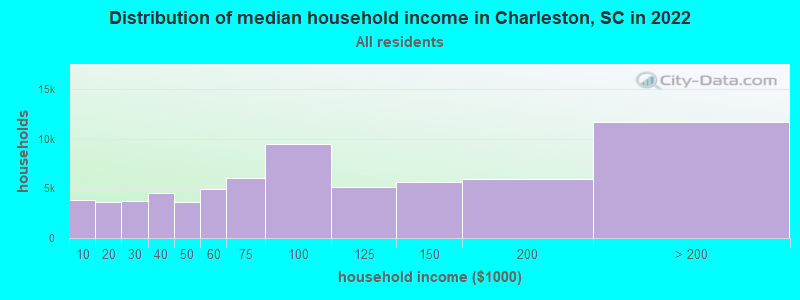
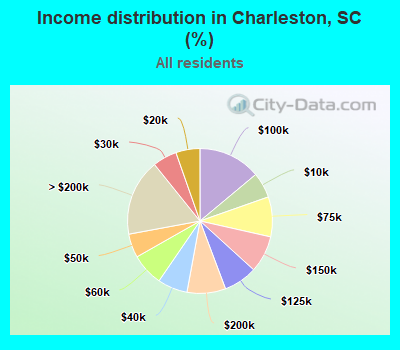
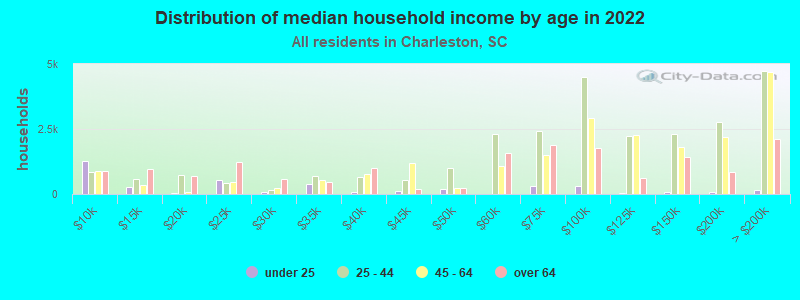
Income statistics for all residents
Median household income in Charleston, SC in 2022:
Charleston:
$83,103
South Carolina:
$64,115
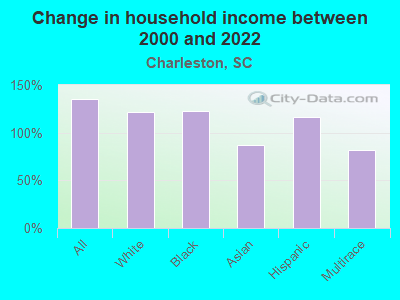
Change in median household income between 2000 and 2022:
Charleston, South Carolina:
+135.5%
South Carolina:
+72.9%
Number of households with income < $10k:
Charleston:
5.7% (3,886)
State:
6.1% (130,922)
Number of households with income $10k - 20k:
Charleston:
5.4% (3,674)
State:
7.9% (168,918)
Number of households with income $20k - 30k:
Charleston:
5.4% (3,693)
State:
8.0% (171,564)
Number of households with income $30k - 40k:
Charleston:
6.7% (4,559)
State:
9.2% (195,662)
Number of households with income $40k - 50k:
Charleston:
5.3% (3,639)
State:
8.2% (176,179)
Number of households with income $50k - 60k:
Charleston:
7.2% (4,929)
South Carolina:
7.5% (159,159)
Number of households with income $60k - 75k:
Charleston:
8.9% (6,097)
South Carolina:
9.9% (211,862)
Number of households with income $75k - 100k:
Charleston:
13.9% (9,526)
State:
13.5% (287,601)
Number of households with income $100k - 125k:
Charleston:
7.5% (5,136)
South Carolina:
9.3% (199,068)
Number of households with income $125k - 150k:
Charleston:
8.2% (5,624)
State:
6.2% (133,330)
Number of households with income $150k - 200k:
Charleston:
8.6% (5,905)
State:
6.6% (141,363)
Number of households with income > $200k:
Charleston:
17.1% (11,709)
South Carolina:
7.5% (160,452)
Aggregate household income in Charleston in 2022: $8,399,177,000
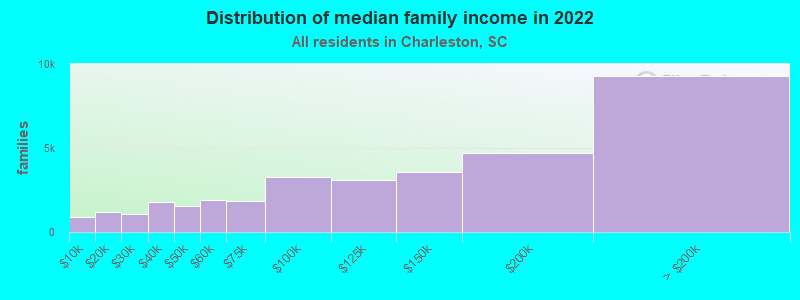
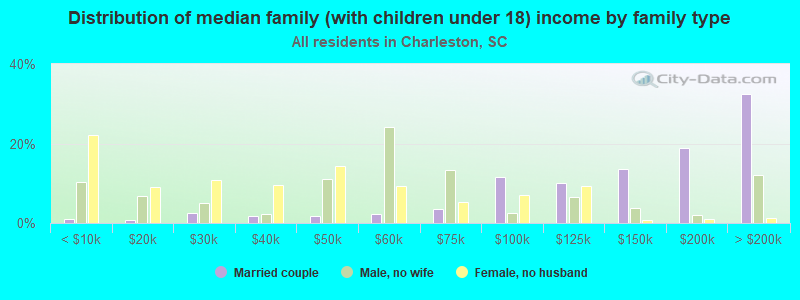
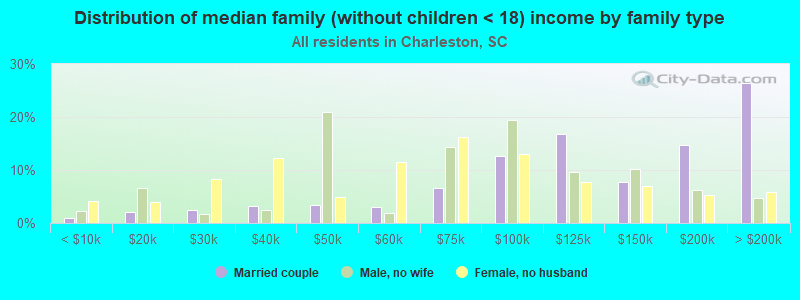
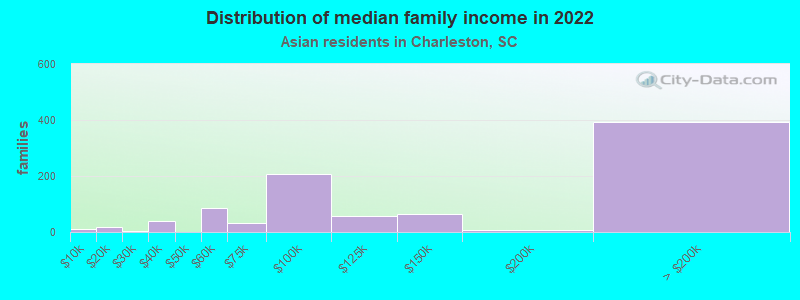
Median family income in Charleston in 2022:
Charleston:
$128,057
South Carolina:
$79,886
Number of families with income < $10k:
Charleston:
2.5% (866)
South Carolina:
3.7% (51,214)
Number of families with income $10k - 20k:
Charleston:
3.4% (1,172)
South Carolina:
4.5% (63,460)
Number of families with income $20k - 30k:
Charleston:
3.2% (1,076)
State:
5.9% (82,415)
Number of families with income $30k - 40k:
Charleston:
5.3% (1,806)
State:
7.5% (105,475)
Number of families with income $40k - 50k:
Charleston:
4.5% (1,525)
South Carolina:
7.7% (107,666)
Number of families with income $50k - 60k:
Charleston:
5.7% (1,933)
State:
7.1% (98,803)
Number of families with income $60k - 75k:
Charleston:
5.5% (1,872)
State:
9.9% (138,412)
Number of families with income $75k - 100k:
Charleston:
9.6% (3,282)
State:
15.4% (214,716)
Number of families with income $100k - 125k:
Charleston:
9.0% (3,070)
State:
11.4% (159,999)
Number of families with income $125k - 150k:
Charleston:
10.5% (3,585)
South Carolina:
8.0% (112,152)
Number of families with income $150k - 200k:
Charleston:
13.7% (4,674)
South Carolina:
8.8% (123,525)
Number of families with income > $200k:
Charleston:
27.2% (9,291)
State:
10.1% (140,575)
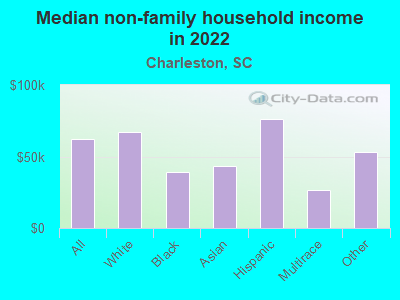
Median non-family income in Charleston in 2022:
Charleston:
$61,972
State:
$38,426
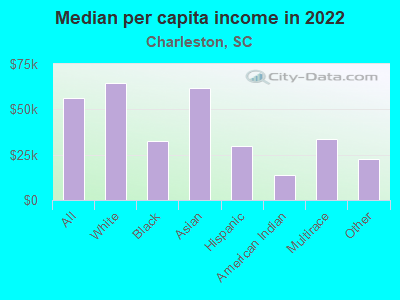
Median per capita income in Charleston in 2022:
Charleston:
$56,341
State:
$36,675
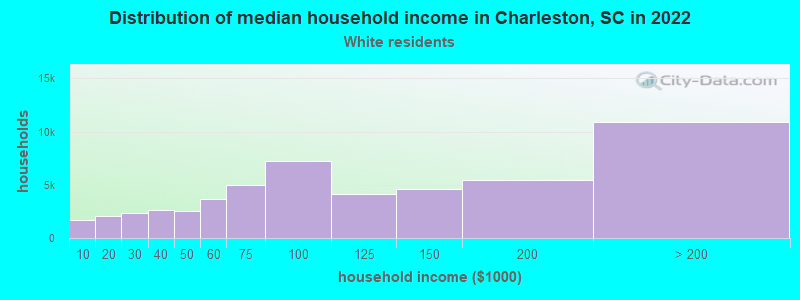
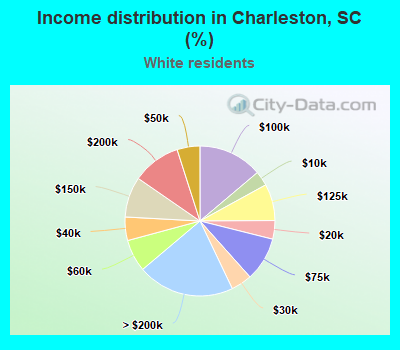
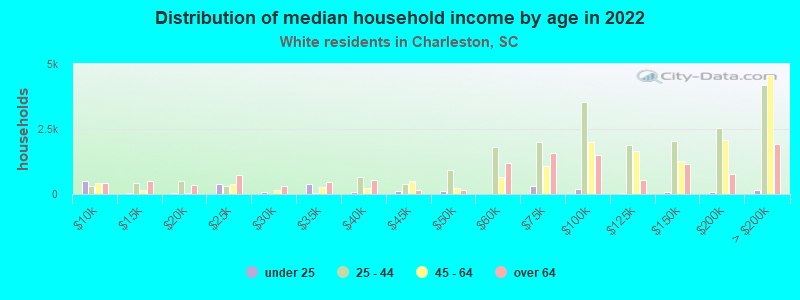
Income statistics for White residents
Median household income in Charleston, SC in 2022:
Charleston:
$95,424
State:
$73,516
Change in median household income between 2000 and 2022:
Charleston, South Carolina:
+121.8%
State:
+74.8%
Number of households with income < $10k:
Charleston:
3.2% (1,647)
State:
4.8% (68,379)
Number of households with income $10k - 20k:
Charleston:
4.0% (2,086)
South Carolina:
5.9% (85,105)
Number of households with income $20k - 30k:
Charleston:
4.5% (2,358)
State:
7.1% (101,178)
Number of households with income $30k - 40k:
Charleston:
5.1% (2,632)
State:
8.0% (114,877)
Number of households with income $40k - 50k:
Charleston:
4.9% (2,562)
State:
7.9% (112,749)
Number of households with income $50k - 60k:
Charleston:
7.0% (3,623)
South Carolina:
7.1% (101,835)
Number of households with income $60k - 75k:
Charleston:
9.5% (4,938)
State:
10.2% (145,879)
Number of households with income $75k - 100k:
Charleston:
13.8% (7,209)
State:
14.0% (200,068)
Number of households with income $100k - 125k:
Charleston:
7.9% (4,109)
South Carolina:
10.4% (148,542)
Number of households with income $125k - 150k:
Charleston:
8.8% (4,564)
State:
7.3% (105,118)
Number of households with income $150k - 200k:
Charleston:
10.5% (5,442)
State:
8.0% (114,506)
Number of households with income > $200k:
Charleston:
20.9% (10,893)
South Carolina:
9.3% (133,550)
Aggregate household income in Charleston in 2022: $7,158,880,500
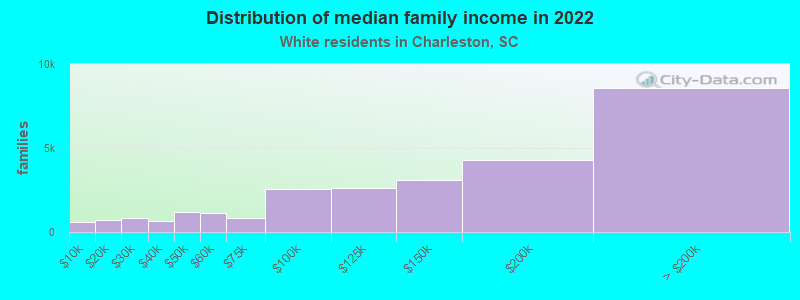
Median family income in Charleston in 2022:
Charleston:
$142,325
South Carolina:
$90,709
Number of families with income < $10k:
Charleston:
2.2% (584)
State:
2.4% (22,376)
Number of families with income $10k - 20k:
Charleston:
2.5% (691)
State:
3.0% (28,325)
Number of families with income $20k - 30k:
Charleston:
3.2% (861)
State:
4.4% (42,131)
Number of families with income $30k - 40k:
Charleston:
2.4% (662)
State:
6.1% (57,510)
Number of families with income $40k - 50k:
Charleston:
4.4% (1,196)
State:
7.0% (66,712)
Number of families with income $50k - 60k:
Charleston:
4.2% (1,129)
South Carolina:
6.6% (62,489)
Number of families with income $60k - 75k:
Charleston:
3.1% (845)
State:
10.0% (94,724)
Number of families with income $75k - 100k:
Charleston:
9.4% (2,553)
State:
15.5% (147,207)
Number of families with income $100k - 125k:
Charleston:
9.6% (2,599)
State:
12.5% (118,160)
Number of families with income $125k - 150k:
Charleston:
11.4% (3,092)
State:
9.5% (90,395)
Number of families with income $150k - 200k:
Charleston:
15.9% (4,301)
South Carolina:
10.6% (100,043)
Number of families with income > $200k:
Charleston:
31.7% (8,587)
State:
12.4% (117,500)
Median non-family income in Charleston in 2022:
Charleston:
$67,122
South Carolina:
$42,596
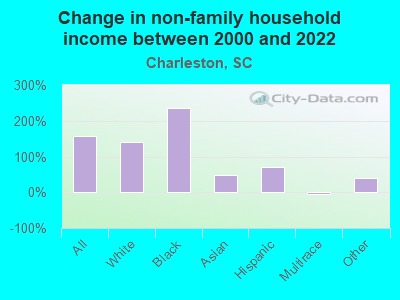
Change in median non-family income between 2000 and 2022:
Charleston, South Carolina:
+140.7%
State:
+74.9%
Median per capita income in Charleston in 2022:
Charleston:
$64,712
South Carolina:
$42,728
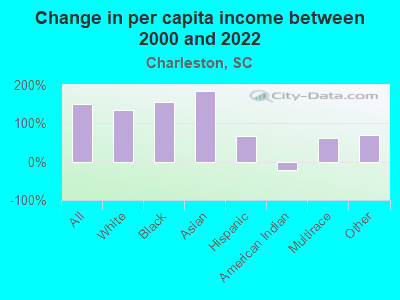
Change in median per capita income between 2000 and 2022:
Charleston, South Carolina:
+134.2%
State:
+93.4%
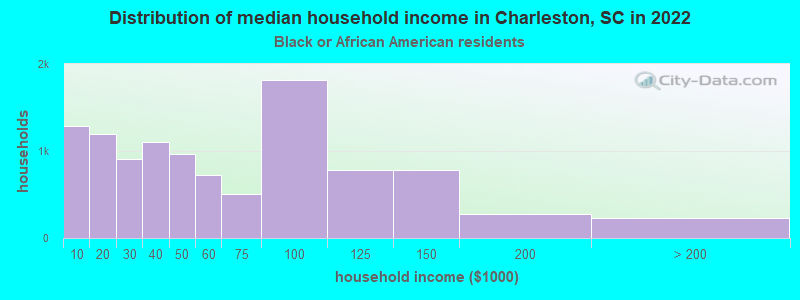
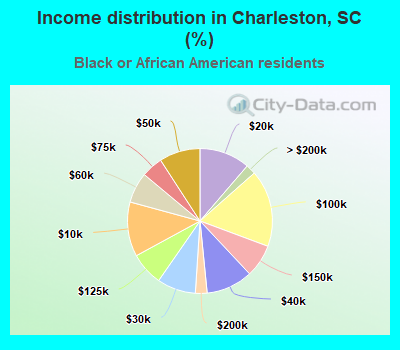
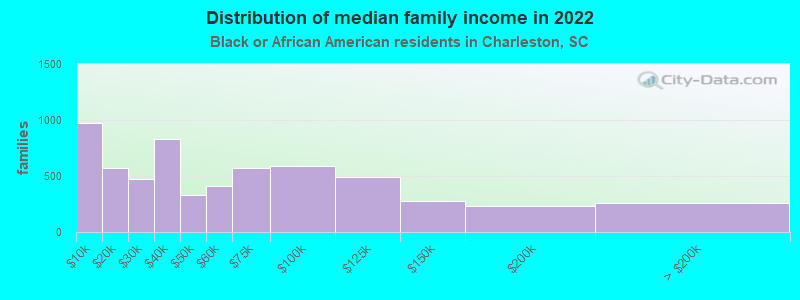
Income statistics for Black or African American residents
Median household income in Charleston, SC in 2022:
Charleston:
$44,591
State:
$44,187
Change in median household income between 2000 and 2022:
Charleston, South Carolina:
+122.9%
State:
+76.5%
Number of households with income < $10k:
Charleston:
12.2% (1,288)
South Carolina:
10.0% (52,303)
Number of households with income $10k - 20k:
Charleston:
11.3% (1,194)
State:
13.4% (69,913)
Number of households with income $20k - 30k:
Charleston:
8.6% (912)
State:
10.4% (54,216)
Number of households with income $30k - 40k:
Charleston:
10.4% (1,101)
South Carolina:
12.0% (62,722)
Number of households with income $40k - 50k:
Charleston:
9.1% (966)
State:
9.2% (47,773)
Number of households with income $50k - 60k:
Charleston:
6.8% (723)
South Carolina:
8.3% (43,083)
Number of households with income $60k - 75k:
Charleston:
4.8% (507)
State:
9.3% (48,640)
Number of households with income $75k - 100k:
Charleston:
17.2% (1,818)
State:
12.2% (63,723)
Number of households with income $100k - 125k:
Charleston:
7.4% (782)
State:
6.4% (33,117)
Number of households with income $125k - 150k:
Charleston:
7.3% (776)
State:
3.2% (16,465)
Number of households with income $150k - 200k:
Charleston:
2.6% (276)
State:
3.2% (16,672)
Number of households with income > $200k:
Charleston:
2.2% (233)
State:
2.3% (12,213)
Aggregate household income in Charleston in 2022: $730,296,900
Median family income in Charleston in 2022:
Charleston:
$59,346
South Carolina:
$54,267
Number of families with income < $10k:
Charleston:
16.2% (970)
South Carolina:
7.3% (23,752)
Number of families with income $10k - 20k:
Charleston:
9.6% (574)
South Carolina:
8.5% (27,789)
Number of families with income $20k - 30k:
Charleston:
7.9% (472)
South Carolina:
9.4% (30,766)
Number of families with income $30k - 40k:
Charleston:
13.9% (833)
South Carolina:
11.6% (37,651)
Number of families with income $40k - 50k:
Charleston:
5.5% (329)
State:
9.5% (30,858)
Number of families with income $50k - 60k:
Charleston:
6.8% (411)
State:
8.7% (28,419)
Number of families with income $60k - 75k:
Charleston:
9.5% (569)
South Carolina:
9.6% (31,402)
Number of families with income $75k - 100k:
Charleston:
9.8% (586)
State:
15.2% (49,441)
Number of families with income $100k - 125k:
Charleston:
8.2% (493)
State:
8.6% (27,974)
Number of families with income $125k - 150k:
Charleston:
4.6% (277)
South Carolina:
3.9% (12,743)
Number of families with income $150k - 200k:
Charleston:
3.9% (232)
State:
4.5% (14,809)
Number of families with income > $200k:
Charleston:
4.3% (258)
South Carolina:
3.2% (10,269)
Median non-family income in Charleston in 2022:
Charleston:
$38,826
State:
$28,585
Median per capita income in Charleston in 2022:
Charleston:
$32,799
State:
$24,863
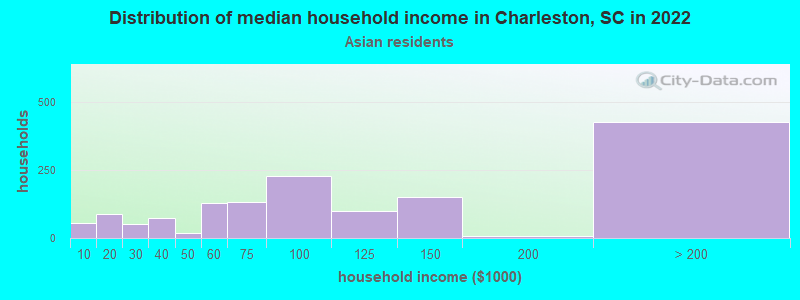
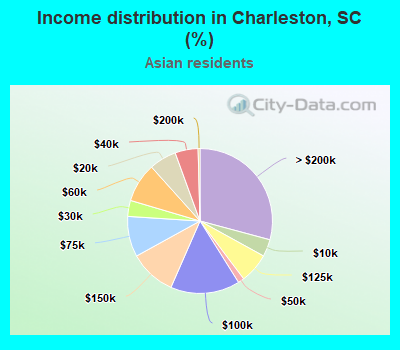
Income statistics for Asian residents
Median household income in Charleston, SC in 2022:
Charleston:
$58,204
State:
$87,807
Change in median household income between 2000 and 2022:
Charleston, South Carolina:
+86.8%
State:
+99.9%
Number of households with income < $10k:
Charleston:
3.8% (56)
State:
2.1% (676)
Number of households with income $10k - 20k:
Charleston:
6.1% (89)
South Carolina:
5.8% (1,818)
Number of households with income $20k - 30k:
Charleston:
3.6% (52)
State:
5.5% (1,750)
Number of households with income $30k - 40k:
Charleston:
5.1% (75)
State:
6.7% (2,113)
Number of households with income $40k - 50k:
Charleston:
1.4% (20)
South Carolina:
5.1% (1,605)
Number of households with income $50k - 60k:
Charleston:
8.8% (128)
South Carolina:
8.4% (2,643)
Number of households with income $60k - 75k:
Charleston:
9.0% (132)
State:
10.8% (3,393)
Number of households with income $75k - 100k:
Charleston:
15.5% (226)
State:
10.9% (3,450)
Number of households with income $100k - 125k:
Charleston:
6.7% (98)
State:
12.0% (3,796)
Number of households with income $125k - 150k:
Charleston:
10.4% (152)
State:
5.5% (1,742)
Number of households with income $150k - 200k:
Charleston:
0.4% (6)
State:
6.3% (1,990)
Number of households with income > $200k:
Charleston:
29.2% (426)
State:
20.9% (6,581)
Aggregate household income in Charleston in 2022: $166,819,000
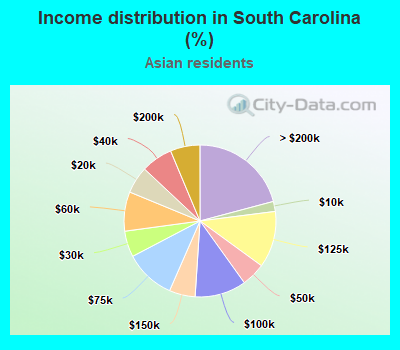
Median family income in Charleston in 2022:
Charleston:
$58,046
South Carolina:
$110,614
Number of families with income < $10k:
Charleston:
1.0% (9)
State:
1.1% (230)
Number of families with income $10k - 20k:
Charleston:
2.0% (19)
State:
4.4% (930)
Number of families with income $20k - 30k:
Charleston:
0.2% (2)
State:
3.9% (834)
Number of families with income $30k - 40k:
Charleston:
4.4% (40)
State:
3.6% (766)
Number of families with income $50k - 60k:
Charleston:
9.4% (86)
State:
5.6% (1,197)
Number of families with income $60k - 75k:
Charleston:
3.5% (32)
South Carolina:
8.2% (1,750)
Number of families with income $75k - 100k:
Charleston:
22.4% (206)
State:
12.4% (2,645)
Number of families with income $100k - 125k:
Charleston:
6.4% (58)
State:
13.1% (2,801)
Number of families with income $125k - 150k:
Charleston:
7.2% (66)
South Carolina:
6.5% (1,394)
Number of families with income $150k - 200k:
Charleston:
0.7% (6)
State:
7.3% (1,562)
Number of families with income > $200k:
Charleston:
42.9% (394)
State:
30.1% (6,428)
Median non-family income in Charleston in 2022:
Charleston:
$43,696
State:
$53,931
Change in median non-family income between 2000 and 2022:
Charleston, South Carolina:
+49.0%
South Carolina:
+134.6%
Median per capita income in Charleston in 2022:
Charleston:
$61,833
State:
$48,909
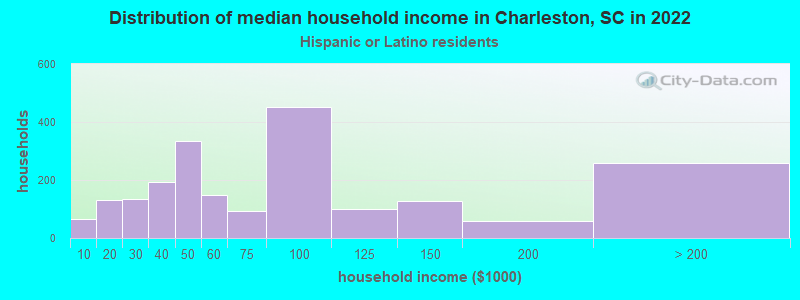
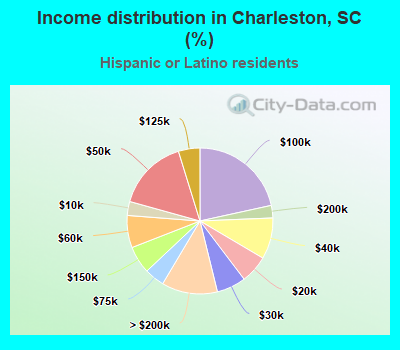
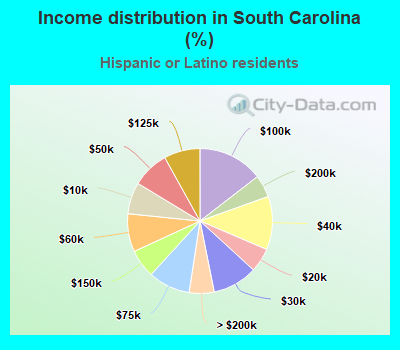
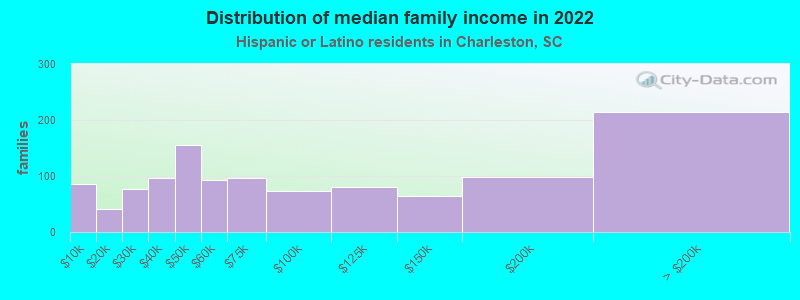
Income statistics for Hispanic or Latino residents
Median household income in Charleston, SC in 2022:
Charleston:
$80,521
South Carolina:
$58,486
Change in median household income between 2000 and 2022:
Charleston, South Carolina:
+116.4%
South Carolina:
+84.8%
Number of households with income < $10k:
Charleston:
3.1% (65)
State:
7.1% (7,036)
Number of households with income $10k - 20k:
Charleston:
6.2% (130)
South Carolina:
5.4% (5,379)
Number of households with income $20k - 30k:
Charleston:
6.5% (136)
State:
10.0% (9,993)
Number of households with income $30k - 40k:
Charleston:
9.1% (192)
State:
11.9% (11,872)
Number of households with income $40k - 50k:
Charleston:
15.9% (334)
State:
8.3% (8,239)
Number of households with income $50k - 60k:
Charleston:
7.1% (150)
South Carolina:
8.5% (8,475)
Number of households with income $60k - 75k:
Charleston:
4.4% (93)
South Carolina:
9.4% (9,330)
Number of households with income $75k - 100k:
Charleston:
21.6% (453)
South Carolina:
14.5% (14,491)
Number of households with income $100k - 125k:
Charleston:
4.8% (100)
South Carolina:
8.1% (8,026)
Number of households with income $125k - 150k:
Charleston:
6.1% (128)
State:
6.3% (6,313)
Number of households with income $150k - 200k:
Charleston:
2.8% (58)
State:
5.0% (4,963)
Number of households with income > $200k:
Charleston:
12.4% (260)
State:
5.6% (5,548)
Aggregate household income in Charleston in 2022: $220,040,600
Median family income in Charleston in 2022:
Charleston:
$106,341
State:
$62,837
Number of families with income < $10k:
Charleston:
7.3% (85)
State:
6.1% (4,418)
Number of families with income $10k - 20k:
Charleston:
3.5% (41)
State:
4.8% (3,459)
Number of families with income $20k - 30k:
Charleston:
6.4% (76)
State:
8.4% (6,079)
Number of families with income $30k - 40k:
Charleston:
8.2% (96)
South Carolina:
12.3% (8,946)
Number of families with income $40k - 50k:
Charleston:
13.2% (155)
South Carolina:
8.9% (6,476)
Number of families with income $50k - 60k:
Charleston:
7.8% (92)
State:
7.1% (5,144)
Number of families with income $60k - 75k:
Charleston:
8.2% (96)
State:
9.5% (6,918)
Number of families with income $75k - 100k:
Charleston:
6.3% (74)
State:
15.0% (10,886)
Number of families with income $100k - 125k:
Charleston:
6.9% (80)
State:
9.5% (6,862)
Number of families with income $125k - 150k:
Charleston:
5.5% (65)
State:
6.7% (4,870)
Number of families with income $150k - 200k:
Charleston:
8.4% (99)
State:
6.0% (4,384)
Number of families with income > $200k:
Charleston:
18.3% (214)
State:
5.6% (4,034)
Median non-family income in Charleston in 2022:
Charleston:
$76,250
State:
$37,846
Change in median non-family income between 2000 and 2022:
Charleston, South Carolina:
+72.2%
South Carolina:
+47.6%
Median per capita income in Charleston in 2022:
Charleston:
$29,872
State:
$23,692
Change in median per capita income between 2000 and 2022:
Charleston, South Carolina:
+65.9%
State:
+95.1%
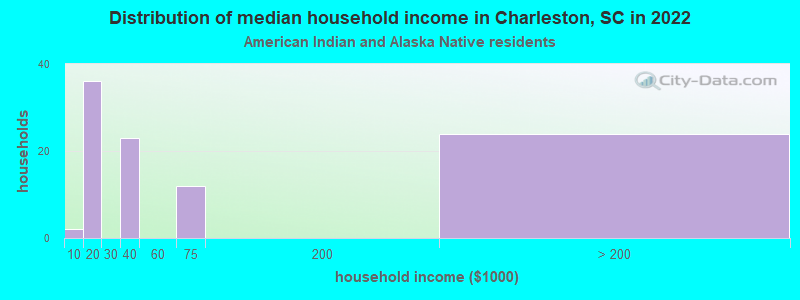
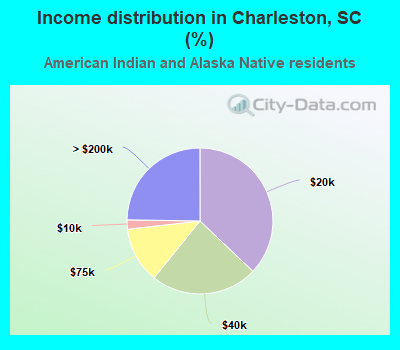
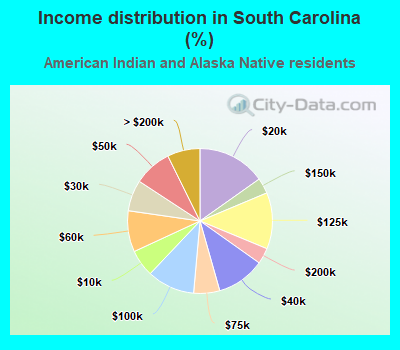
Income statistics for American Indian and Alaska Native residents
Number of households with income < $10k:
Charleston:
2.1% (2)
South Carolina:
6.0% (394)
Number of households with income $10k - 20k:
Charleston:
37.1% (36)
State:
15.2% (994)
Number of households with income $20k - 30k:
Charleston:
0.0% (0)
South Carolina:
6.9% (454)
Number of households with income $30k - 40k:
Charleston:
23.7% (23)
State:
10.8% (705)
Number of households with income $40k - 50k:
Charleston:
0.0% (0)
South Carolina:
8.5% (555)
Number of households with income $50k - 60k:
Charleston:
0.0% (0)
South Carolina:
9.2% (601)
Number of households with income $60k - 75k:
Charleston:
12.4% (12)
State:
5.8% (380)
Number of households with income $75k - 100k:
Charleston:
0.0% (0)
State:
10.7% (697)
Number of households with income $100k - 125k:
Charleston:
0.0% (0)
State:
12.6% (822)
Number of households with income $125k - 150k:
Charleston:
0.0% (0)
State:
3.5% (228)
Number of households with income $150k - 200k:
Charleston:
0.0% (0)
State:
3.6% (234)
Number of households with income > $200k:
Charleston:
24.7% (24)
State:
7.3% (477)
Aggregate household income in Charleston in 2022: $4,418,226
Median per capita income in Charleston in 2022:
Charleston:
$13,583
South Carolina:
$26,654
Change in median per capita income between 2000 and 2022:: -20.6%
Charleston, South Carolina:
-20.6%
South Carolina:
+73.9%
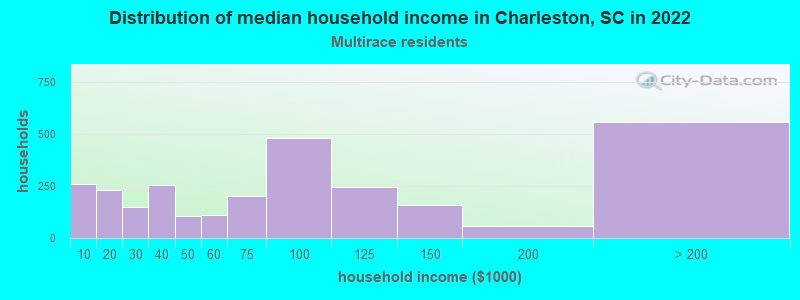
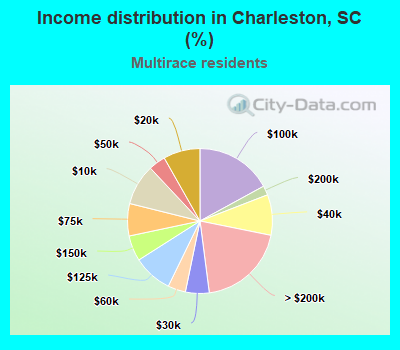
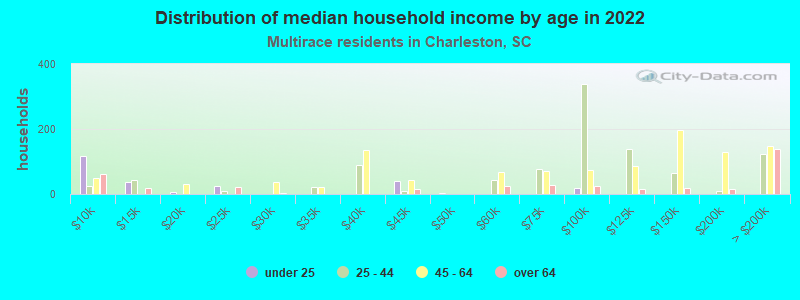
Income statistics for Multirace residents
Median household income in Charleston, SC in 2022:
Charleston:
$53,520
South Carolina:
$61,314
Change in median household income between 2000 and 2022:
Charleston, South Carolina:
+82.4%
State:
+94.4%
Number of households with income < $10k:
Charleston:
9.1% (258)
South Carolina:
6.9% (6,974)
Number of households with income $10k - 20k:
Charleston:
8.2% (232)
State:
8.0% (8,052)
Number of households with income $20k - 30k:
Charleston:
5.3% (150)
South Carolina:
9.9% (9,972)
Number of households with income $30k - 40k:
Charleston:
9.1% (256)
State:
10.0% (10,121)
Number of households with income $40k - 50k:
Charleston:
3.8% (107)
State:
8.1% (8,188)
Number of households with income $50k - 60k:
Charleston:
4.0% (112)
State:
6.5% (6,530)
Number of households with income $60k - 75k:
Charleston:
7.2% (204)
South Carolina:
8.9% (9,021)
Number of households with income $75k - 100k:
Charleston:
17.0% (482)
State:
13.4% (13,544)
Number of households with income $100k - 125k:
Charleston:
8.8% (248)
State:
9.8% (9,916)
Number of households with income $125k - 150k:
Charleston:
5.7% (161)
State:
6.6% (6,657)
Number of households with income $150k - 200k:
Charleston:
2.1% (59)
State:
5.9% (5,979)
Number of households with income > $200k:
Charleston:
19.8% (559)
State:
6.2% (6,266)
Aggregate household income in Charleston in 2022: $300,775,000
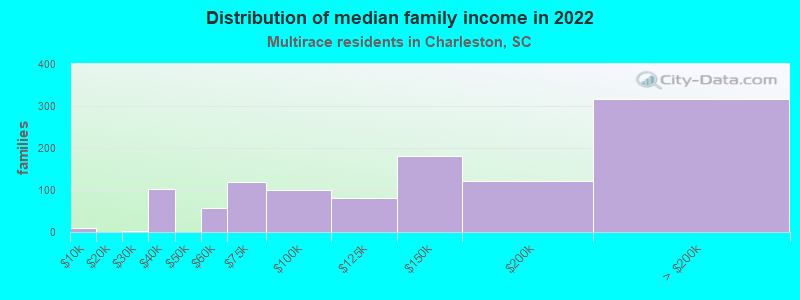
Median family income in Charleston in 2022:
Charleston:
$138,552
State:
$72,647
Number of families with income < $10k:
Charleston:
0.9% (10)
South Carolina:
4.6% (3,104)
Number of families with income $20k - 30k:
Charleston:
0.2% (2)
State:
8.6% (5,823)
Number of families with income $30k - 40k:
Charleston:
9.4% (103)
State:
8.1% (5,448)
Number of families with income $50k - 60k:
Charleston:
5.1% (56)
South Carolina:
5.7% (3,867)
Number of families with income $60k - 75k:
Charleston:
11.0% (120)
South Carolina:
9.9% (6,674)
Number of families with income $75k - 100k:
Charleston:
9.2% (100)
South Carolina:
15.0% (10,101)
Number of families with income $100k - 125k:
Charleston:
7.4% (81)
South Carolina:
11.6% (7,846)
Number of families with income $125k - 150k:
Charleston:
16.6% (180)
State:
7.0% (4,709)
Number of families with income $150k - 200k:
Charleston:
11.2% (122)
State:
8.3% (5,590)
Number of families with income > $200k:
Charleston:
29.0% (316)
State:
7.0% (4,727)
Median non-family income in Charleston in 2022:
Charleston:
$26,272
State:
$38,033
Change in median non-family income between 2000 and 2022:: -4.7%
Charleston, South Carolina:
-4.7%
State:
+80.3%
Median per capita income in Charleston in 2022:
Charleston:
$33,553
State:
$26,391
Change in median per capita income between 2000 and 2022:
Charleston, South Carolina:
+63.4%
State:
+120.8%
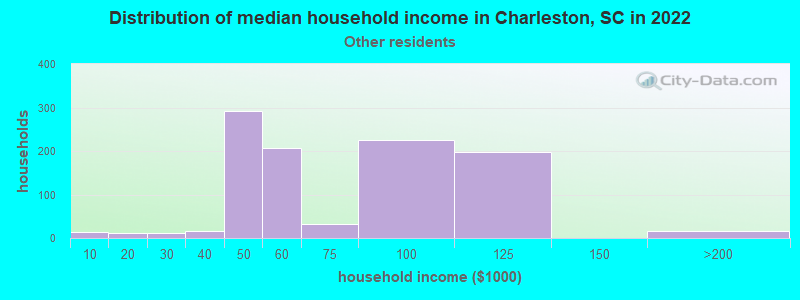
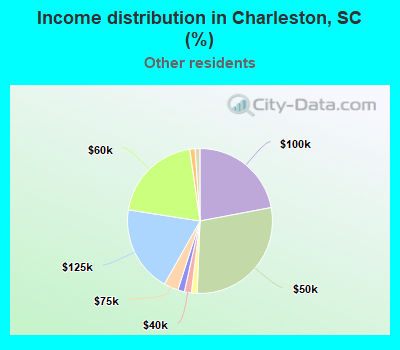
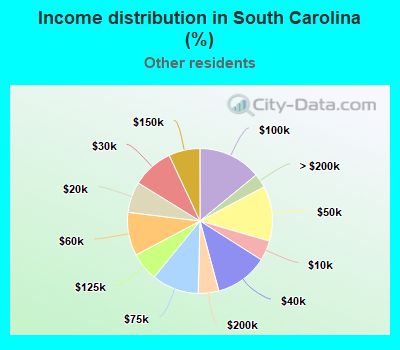
Income statistics for other residents
Median household income in Charleston, SC in 2022:
Charleston:
$53,027
South Carolina:
$54,421
Number of households with income < $10k:
Charleston:
1.3% (13)
South Carolina:
4.5% (1,945)
Number of households with income $10k - 20k:
Charleston:
1.2% (12)
State:
6.9% (2,977)
Number of households with income $20k - 30k:
Charleston:
1.1% (11)
State:
9.2% (3,988)
Number of households with income $30k - 40k:
Charleston:
1.6% (16)
State:
11.8% (5,124)
Number of households with income $40k - 50k:
Charleston:
28.6% (292)
South Carolina:
12.3% (5,309)
Number of households with income $50k - 60k:
Charleston:
20.3% (207)
State:
9.7% (4,196)
Number of households with income $60k - 75k:
Charleston:
3.2% (33)
State:
10.5% (4,549)
Number of households with income $75k - 100k:
Charleston:
22.0% (225)
State:
14.1% (6,099)
Number of households with income $100k - 125k:
Charleston:
19.3% (197)
South Carolina:
6.3% (2,747)
Number of households with income $125k - 150k:
Charleston:
0.0% (0)
State:
7.0% (3,024)
Number of households with income $150k - 200k:
Charleston:
1.5% (15)
South Carolina:
4.6% (1,982)
Number of households with income > $200k:
Charleston:
0.0% (0)
State:
3.2% (1,365)
Aggregate household income in Charleston in 2022: $36,804,300
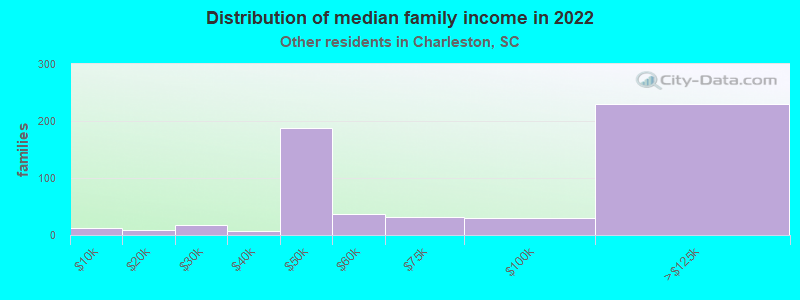
Median family income in Charleston in 2022:
Charleston:
$64,000
State:
$60,279
Number of families with income < $10k:
Charleston:
2.1% (12)
State:
4.7% (1,478)
Number of families with income $10k - 20k:
Charleston:
1.4% (8)
State:
7.4% (2,325)
Number of families with income $20k - 30k:
Charleston:
2.9% (17)
State:
7.6% (2,400)
Number of families with income $30k - 40k:
Charleston:
1.2% (7)
State:
11.9% (3,744)
Number of families with income $40k - 50k:
Charleston:
33.6% (188)
State:
10.5% (3,295)
Number of families with income $50k - 60k:
Charleston:
6.7% (37)
South Carolina:
7.4% (2,322)
Number of families with income $60k - 75k:
Charleston:
5.6% (31)
State:
11.5% (3,606)
Number of families with income $75k - 100k:
Charleston:
5.3% (30)
South Carolina:
14.0% (4,390)
Number of families with income $100k - 125k:
Charleston:
41.1% (230)
State:
8.3% (2,597)
Median non-family income in Charleston in 2022:
Charleston:
$52,917
South Carolina:
$42,981
Change in median non-family income between 2000 and 2022:
Charleston, South Carolina:
+38.8%
State:
+62.1%
Median per capita income in Charleston in 2022:
Charleston:
$22,621
State:
$22,305
Change in median per capita income between 2000 and 2022:
Charleston, South Carolina:
+70.5%
State:
+113.0%
Discuss Charleston, South Carolina (SC) on our hugely popular South Carolina forum.