Chelan Falls, Washington (WA) income map, earnings map, and wages data

Data:
The per capita income in 2022 was $18,884, which means a decrease of 2.1% compared to 2000 when it was $19,273.
Whole page based on the data from 2000 / 2022 when the population of Chelan Falls, Washington was 329 / 107
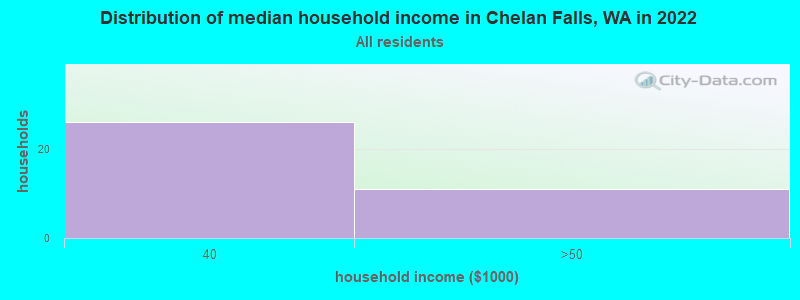
Income statistics for all residents
Number of households with income < $10k:| Chelan Falls: | 0.0% (0) |
| State: | 4.5% (139,331) |
Number of households with income $10k - 20k:| Chelan Falls: | 0.0% (0) |
| State: | 5.0% (154,508) |
Number of households with income $20k - 30k:| Chelan Falls: | 0.0% (0) |
| State: | 5.4% (166,555) |
Number of households with income $30k - 40k:| Chelan Falls: | 70.3% (26) |
| State: | 5.5% (170,324) |
Number of households with income $40k - 50k:| Chelan Falls: | 29.7% (11) |
| State: | 6.0% (183,941) |
Number of households with income $50k - 60k:| Chelan Falls: | 0.0% (0) |
| Washington: | 6.1% (187,395) |
Number of households with income $60k - 75k:| Chelan Falls: | 0.0% (0) |
| Washington: | 8.7% (266,771) |
Number of households with income $75k - 100k:| Chelan Falls: | 0.0% (0) |
| State: | 13.1% (404,672) |
Number of households with income $100k - 125k:| Chelan Falls: | 0.0% (0) |
| Washington: | 11.0% (337,911) |
Number of households with income $125k - 150k:| Chelan Falls: | 0.0% (0) |
| State: | 8.0% (244,934) |
Number of households with income $150k - 200k:| Chelan Falls: | 0.0% (0) |
| State: | 10.5% (323,812) |
Number of households with income > $200k:| Chelan Falls: | 0.0% (0) |
| State: | 16.2% (499,799) |
Aggregate household income in Chelan Falls in 2022: $2,842,529
Median per capita income in Chelan Falls in 2022:| Chelan Falls: | $18,885 |
| State: | $50,764 |
Income statistics for White residents
Number of households with income < $10k:| Chelan Falls: | 0.0% (0) |
| Washington: | 4.3% (95,850) |
Number of households with income $10k - 20k:| Chelan Falls: | 0.0% (0) |
| State: | 4.8% (106,421) |
Number of households with income $20k - 30k:| Chelan Falls: | 0.0% (0) |
| State: | 5.5% (122,860) |
Number of households with income $30k - 40k:| Chelan Falls: | 73.2% (30) |
| State: | 5.4% (119,627) |
Number of households with income $40k - 50k:| Chelan Falls: | 26.8% (11) |
| State: | 5.9% (132,276) |
Number of households with income $50k - 60k:| Chelan Falls: | 0.0% (0) |
| State: | 6.1% (136,212) |
Number of households with income $60k - 75k:| Chelan Falls: | 0.0% (0) |
| State: | 8.8% (196,086) |
Number of households with income $75k - 100k:| Chelan Falls: | 0.0% (0) |
| State: | 13.4% (299,192) |
Number of households with income $100k - 125k:| Chelan Falls: | 0.0% (0) |
| Washington: | 11.3% (252,209) |
Number of households with income $125k - 150k:| Chelan Falls: | 0.0% (0) |
| State: | 7.9% (175,962) |
Number of households with income $150k - 200k:| Chelan Falls: | 0.0% (0) |
| State: | 10.7% (239,156) |
Number of households with income > $200k:| Chelan Falls: | 0.0% (0) |
| State: | 16.1% (359,917) |
Aggregate household income in Chelan Falls in 2022: $2,550,477
Median per capita income in Chelan Falls in 2022:| Chelan Falls: | $17,717 |
| State: | $55,212 |
Income statistics for Hispanic or Latino residents
Median per capita income in Chelan Falls in 2022:| Chelan Falls: | $27,521 |
| State: | $28,252 |
Income statistics for other residents
Median per capita income in Chelan Falls in 2022:| Chelan Falls: | $26,776 |
| Washington: | $27,542 |