Chemung, New York (NY) income map, earnings map, and wages data
The median household income in Chemung, NY in 2022 was $53,931, which was 47.5% less than the median annual income of $79,557 across the entire state of New York. Compared to the median income of $35,167 in 2000 this represents an increase of 34.8%. The per capita income in 2022 was $27,817, which means an increase of 45.4% compared to 2000 when it was $15,201.
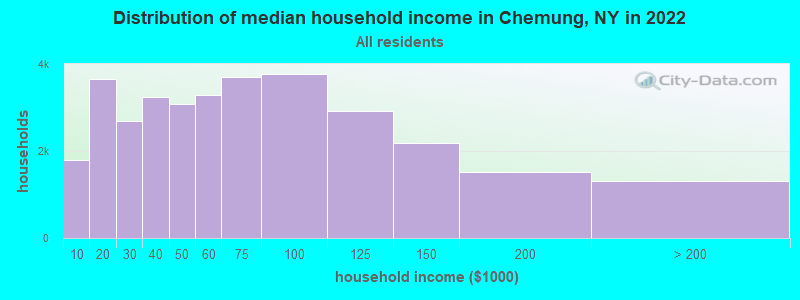
Income statistics for all residents
Median household income in Chemung, NY in 2022:| Chemung: | $53,931 |
| State: | $79,557 |
Change in median household income between 2000 and 2022:| Chemung, New York: | +53.4% |
| State: | +83.3% |
Number of households with income < $10k:| Chemung: | 5.4% (1,795) |
| State: | 6.8% (527,598) |
Number of households with income $10k - 20k:| Chemung: | 11.0% (3,659) |
| State: | 7.4% (574,940) |
Number of households with income $20k - 30k:| Chemung: | 8.1% (2,679) |
| State: | 6.7% (517,718) |
Number of households with income $30k - 40k:| Chemung: | 9.8% (3,252) |
| State: | 6.5% (506,674) |
Number of households with income $40k - 50k:| Chemung: | 9.3% (3,078) |
| State: | 6.1% (470,439) |
Number of households with income $50k - 60k:| Chemung: | 9.9% (3,285) |
| State: | 5.8% (454,042) |
Number of households with income $60k - 75k:| Chemung: | 11.2% (3,705) |
| New York: | 8.5% (657,508) |
Number of households with income $75k - 100k:| Chemung: | 11.3% (3,759) |
| State: | 11.6% (899,824) |
Number of households with income $100k - 125k:| Chemung: | 8.8% (2,917) |
| State: | 9.3% (723,825) |
Number of households with income $125k - 150k:| Chemung: | 6.6% (2,184) |
| New York: | 7.1% (552,420) |
Number of households with income $150k - 200k:| Chemung: | 4.6% (1,517) |
| State: | 9.4% (727,051) |
Number of households with income > $200k:| Chemung: | 4.0% (1,310) |
| New York: | 15.0% (1,162,269) |
Aggregate household income in Chemung in 2022: $65,840,988
Median family income in Chemung in 2022:| Chemung: | $61,872 |
| State: | $99,066 |
Median non-family income in Chemung in 2022:| Chemung: | $39,281 |
| New York: | $50,181 |
Change in median non-family income between 2000 and 2022:| Chemung, New York: | +99.7% |
| State: | +85.4% |
Median per capita income in Chemung in 2022:| Chemung: | $27,818 |
| State: | $47,421 |
Change in median per capita income between 2000 and 2022:| Chemung, New York: | +83.0% |
| State: | +102.7% |
Income statistics for White residents
Median household income in Chemung, NY in 2022:| Chemung: | $53,012 |
| New York: | $89,408 |
Change in median household income between 2000 and 2022:| Chemung, New York: | +51.8% |
| State: | +85.5% |
Number of households with income < $10k:| Chemung: | 5.2% (1,511) |
| State: | 4.8% (225,550) |
Number of households with income $10k - 20k:| Chemung: | 10.3% (3,005) |
| State: | 6.1% (289,425) |
Number of households with income $20k - 30k:| Chemung: | 8.6% (2,510) |
| New York: | 5.9% (280,254) |
Number of households with income $30k - 40k:| Chemung: | 9.9% (2,909) |
| State: | 6.1% (288,263) |
Number of households with income $40k - 50k:| Chemung: | 9.1% (2,668) |
| State: | 5.9% (278,079) |
Number of households with income $50k - 60k:| Chemung: | 10.8% (3,153) |
| State: | 5.7% (267,554) |
Number of households with income $60k - 75k:| Chemung: | 9.9% (2,914) |
| New York: | 8.4% (398,344) |
Number of households with income $75k - 100k:| Chemung: | 11.1% (3,259) |
| State: | 11.8% (554,841) |
Number of households with income $100k - 125k:| Chemung: | 9.3% (2,738) |
| State: | 10.0% (469,794) |
Number of households with income $125k - 150k:| Chemung: | 7.0% (2,042) |
| State: | 7.6% (360,467) |
Number of households with income $150k - 200k:| Chemung: | 4.7% (1,372) |
| New York: | 10.1% (477,078) |
Number of households with income > $200k:| Chemung: | 4.2% (1,223) |
| State: | 17.6% (829,233) |
Aggregate household income in Chemung in 2022: $62,586,249
Median family income in Chemung in 2022:| Chemung: | $66,580 |
| State: | $115,170 |
Number of families with income < $10k:| Chemung: | 4.7% (21) |
| State: | 2.5% (68,851) |
Number of families with income $10k - 20k:| Chemung: | 8.0% (36) |
| State: | 3.0% (83,127) |
Number of families with income $20k - 30k:| Chemung: | 9.1% (41) |
| New York: | 3.5% (97,578) |
Number of families with income $30k - 40k:| Chemung: | 9.7% (43) |
| New York: | 4.1% (114,108) |
Number of families with income $40k - 50k:| Chemung: | 13.2% (59) |
| New York: | 4.7% (130,902) |
Number of families with income $50k - 60k:| Chemung: | 5.3% (24) |
| State: | 4.9% (135,118) |
Number of families with income $60k - 75k:| Chemung: | 16.0% (71) |
| New York: | 7.8% (216,254) |
Number of families with income $75k - 100k:| Chemung: | 15.0% (67) |
| State: | 12.4% (342,382) |
Number of families with income $100k - 125k:| Chemung: | 7.3% (33) |
| New York: | 11.4% (314,917) |
Number of families with income $125k - 150k:| Chemung: | 11.8% (53) |
| New York: | 9.4% (260,489) |
Median non-family income in Chemung in 2022:| Chemung: | $37,697 |
| New York: | $54,783 |
Change in median non-family income between 2000 and 2022:| Chemung, New York: | +95.0% |
| State: | +87.9% |
Median per capita income in Chemung in 2022:| Chemung: | $29,276 |
| New York: | $57,640 |
Change in median per capita income between 2000 and 2022:| Chemung, New York: | +92.2% |
| State: | +111.6% |
Income statistics for Black or African American residents
Median household income in Chemung, NY in 2022:| Chemung: | $23,138 |
| New York: | $57,898 |
Number of households with income < $10k:| Chemung: | 12.0% (17,939) |
| State: | 12.0% (128,500) |
Number of households with income $10k - 20k:| Chemung: | 10.0% (14,998) |
| New York: | 10.0% (107,541) |
Number of households with income $20k - 30k:| Chemung: | 8.4% (12,588) |
| New York: | 8.4% (90,192) |
Number of households with income $30k - 40k:| Chemung: | 7.4% (11,094) |
| State: | 7.4% (79,579) |
Number of households with income $40k - 50k:| Chemung: | 6.8% (10,116) |
| New York: | 6.8% (72,491) |
Number of households with income $50k - 60k:| Chemung: | 6.6% (9,921) |
| State: | 6.7% (71,309) |
Number of households with income $60k - 75k:| Chemung: | 8.9% (13,263) |
| State: | 8.9% (95,050) |
Number of households with income $75k - 100k:| Chemung: | 11.5% (17,209) |
| New York: | 11.5% (123,569) |
Number of households with income $100k - 125k:| Chemung: | 8.1% (12,047) |
| State: | 8.1% (86,632) |
Number of households with income $125k - 150k:| Chemung: | 6.1% (9,039) |
| State: | 6.0% (64,788) |
Number of households with income $150k - 200k:| Chemung: | 7.1% (10,665) |
| State: | 7.2% (76,644) |
Number of households with income > $200k:| Chemung: | 7.0% (10,415) |
| New York: | 7.0% (75,062) |
Aggregate household income in Chemung in 2022: $34,023
Median non-family income in Chemung in 2022:| Chemung: | $41,648 |
| State: | $37,265 |
Median per capita income in Chemung in 2022:| Chemung: | $20,981 |
| New York: | $31,947 |
Change in median per capita income between 2000 and 2022:| Chemung, New York: | +36.0% |
| State: | +106.1% |
Income statistics for Hispanic or Latino residents
Median household income in Chemung, NY in 2022:| Chemung: | $61,424 |
| State: | $60,468 |
Change in median household income between 2000 and 2022:| Chemung, New York: | +96.6% |
| New York: | +98.3% |
Number of households with income < $10k:| Chemung: | 10.0% (65,116) |
| State: | 9.9% (127,185) |
Number of households with income $10k - 20k:| Chemung: | 10.7% (70,095) |
| State: | 10.7% (136,699) |
Number of households with income $20k - 30k:| Chemung: | 8.1% (52,781) |
| New York: | 8.1% (102,991) |
Number of households with income $30k - 40k:| Chemung: | 7.8% (51,125) |
| State: | 7.8% (100,149) |
Number of households with income $40k - 50k:| Chemung: | 6.8% (44,730) |
| New York: | 6.9% (87,760) |
Number of households with income $50k - 60k:| Chemung: | 6.3% (41,421) |
| State: | 6.3% (80,968) |
Number of households with income $60k - 75k:| Chemung: | 8.6% (56,457) |
| State: | 8.7% (110,631) |
Number of households with income $75k - 100k:| Chemung: | 11.2% (72,874) |
| New York: | 11.2% (142,787) |
Number of households with income $100k - 125k:| Chemung: | 8.2% (53,401) |
| New York: | 8.2% (104,850) |
Number of households with income $125k - 150k:| Chemung: | 6.3% (40,973) |
| State: | 6.3% (80,274) |
Number of households with income $150k - 200k:| Chemung: | 7.4% (48,436) |
| New York: | 7.4% (95,117) |
Number of households with income > $200k:| Chemung: | 8.6% (55,861) |
| State: | 8.6% (109,514) |
Aggregate household income in Chemung in 2022: $411,776
Median family income in Chemung in 2022:| Chemung: | $66,269 |
| State: | $68,770 |
Number of families with income < $10k:| Chemung: | 10.4% (13) |
| State: | 6.9% (58,565) |
Number of families with income $10k - 20k:| Chemung: | 12.4% (16) |
| New York: | 7.0% (59,058) |
Number of families with income $20k - 30k:| Chemung: | 15.1% (19) |
| State: | 8.0% (68,048) |
Number of families with income $30k - 40k:| Chemung: | 19.3% (25) |
| State: | 8.4% (70,668) |
Number of families with income $40k - 50k:| Chemung: | 13.5% (17) |
| State: | 7.4% (62,941) |
Number of families with income $50k - 60k:| Chemung: | 5.1% (7) |
| New York: | 6.6% (55,592) |
Number of families with income $60k - 75k:| Chemung: | 11.8% (15) |
| State: | 9.3% (78,564) |
Number of families with income $75k - 100k:| Chemung: | 7.1% (9) |
| State: | 12.6% (106,685) |
Number of families with income $100k - 125k:| Chemung: | 2.8% (4) |
| New York: | 9.4% (79,139) |
Number of families with income $125k - 150k:| Chemung: | 2.5% (3) |
| State: | 6.9% (58,255) |
Median per capita income in Chemung in 2022:| Chemung: | $18,461 |
| State: | $29,761 |
Change in median per capita income between 2000 and 2022:| Chemung, New York: | +14.0% |
| State: | +132.7% |
Income statistics for American Indian and Alaska Native residents
Median household income in Chemung, NY in 2022:| Chemung: | $41,881 |
| State: | $63,208 |
Change in median household income between 2000 and 2022:| Chemung, New York: | +15.5% |
| State: | +110.1% |
Number of households with income < $10k:| Chemung: | 8.6% (2,164) |
| State: | 8.6% (3,559) |
Number of households with income $10k - 20k:| Chemung: | 6.0% (1,503) |
| State: | 5.9% (2,455) |
Number of households with income $20k - 30k:| Chemung: | 8.2% (2,055) |
| State: | 8.2% (3,393) |
Number of households with income $30k - 40k:| Chemung: | 11.9% (2,991) |
| New York: | 11.9% (4,918) |
Number of households with income $40k - 50k:| Chemung: | 6.4% (1,608) |
| State: | 6.5% (2,682) |
Number of households with income $50k - 60k:| Chemung: | 6.0% (1,513) |
| State: | 6.1% (2,516) |
Number of households with income $60k - 75k:| Chemung: | 9.9% (2,486) |
| New York: | 10.0% (4,125) |
Number of households with income $75k - 100k:| Chemung: | 13.4% (3,362) |
| State: | 13.3% (5,517) |
Number of households with income $100k - 125k:| Chemung: | 8.4% (2,099) |
| State: | 8.4% (3,463) |
Number of households with income $125k - 150k:| Chemung: | 7.0% (1,765) |
| State: | 7.0% (2,887) |
Number of households with income $150k - 200k:| Chemung: | 10.0% (2,515) |
| State: | 9.9% (4,106) |
Number of households with income > $200k:| Chemung: | 4.2% (1,063) |
| State: | 4.2% (1,744) |
Aggregate household income in Chemung in 2022: $352,741
Median per capita income in Chemung in 2022:| Chemung: | $12,482 |
| State: | $25,837 |
Change in median per capita income between 2000 and 2022:| Chemung, New York: | +56.5% |
| New York: | +99.6% |
Income statistics for Multirace residents
Median household income in Chemung, NY in 2022:| Chemung: | $84,598 |
| New York: | $73,557 |
Change in median household income between 2000 and 2022:| Chemung, New York: | +115.5% |
| State: | +123.9% |
Number of households with income < $10k:| Chemung: | 8.9% (34,646) |
| State: | 8.9% (57,924) |
Number of households with income $10k - 20k:| Chemung: | 8.7% (33,788) |
| New York: | 8.7% (56,590) |
Number of households with income $20k - 30k:| Chemung: | 7.1% (27,619) |
| New York: | 7.1% (46,287) |
Number of households with income $30k - 40k:| Chemung: | 6.9% (26,902) |
| State: | 6.9% (45,132) |
Number of households with income $40k - 50k:| Chemung: | 5.8% (22,575) |
| State: | 5.8% (37,946) |
Number of households with income $50k - 60k:| Chemung: | 5.6% (21,690) |
| State: | 5.6% (36,410) |
Number of households with income $60k - 75k:| Chemung: | 7.8% (30,255) |
| State: | 7.8% (50,819) |
Number of households with income $75k - 100k:| Chemung: | 11.7% (45,337) |
| State: | 11.7% (76,024) |
Number of households with income $100k - 125k:| Chemung: | 9.3% (36,077) |
| State: | 9.3% (60,635) |
Number of households with income $125k - 150k:| Chemung: | 6.2% (24,174) |
| State: | 6.2% (40,533) |
Number of households with income $150k - 200k:| Chemung: | 8.6% (33,627) |
| State: | 8.6% (56,409) |
Number of households with income > $200k:| Chemung: | 13.4% (52,205) |
| New York: | 13.4% (87,442) |
Aggregate household income in Chemung in 2022: $8,919,996
Median family income in Chemung in 2022:| Chemung: | $74,953 |
| State: | $85,788 |
Number of families with income $10k - 20k:| Chemung: | 46.0% (9) |
| State: | 5.6% (22,512) |
Number of families with income $30k - 40k:| Chemung: | 54.0% (11) |
| State: | 6.5% (26,239) |
Median non-family income in Chemung in 2022:| Chemung: | $116,393 |
| New York: | $46,403 |
Change in median non-family income between 2000 and 2022:| Chemung, New York: | +114.5% |
| State: | +113.6% |
Median per capita income in Chemung in 2022:| Chemung: | $66,188 |
| State: | $36,931 |