Cherry Grove, Washington (WA) income map, earnings map, and wages data

Data:
The per capita income in 2022 was $62,443, which means an increase of 66.8% compared to 2000 when it was $20,760.
Whole page based on the data from 2000 / 2022 when the population of Cherry Grove, Washington was 663 / 467
Income statistics for all residents
Number of households with income < $10k:| Cherry Grove: | 0.0% (0) |
| State: | 4.5% (139,331) |
Number of households with income $10k - 20k:| Cherry Grove: | 4.8% (8) |
| State: | 5.0% (154,508) |
Number of households with income $20k - 30k:| Cherry Grove: | 0.0% (0) |
| State: | 5.4% (166,555) |
Number of households with income $30k - 40k:| Cherry Grove: | 0.0% (0) |
| State: | 5.5% (170,324) |
Number of households with income $40k - 50k:| Cherry Grove: | 11.5% (19) |
| Washington: | 6.0% (183,941) |
Number of households with income $50k - 60k:| Cherry Grove: | 0.0% (0) |
| Washington: | 6.1% (187,395) |
Number of households with income $60k - 75k:| Cherry Grove: | 10.3% (17) |
| State: | 8.7% (266,771) |
Number of households with income $75k - 100k:| Cherry Grove: | 18.8% (31) |
| State: | 13.1% (404,672) |
Number of households with income $100k - 125k:| Cherry Grove: | 0.0% (0) |
| State: | 11.0% (337,911) |
Number of households with income $125k - 150k:| Cherry Grove: | 0.0% (0) |
| State: | 8.0% (244,934) |
Number of households with income $150k - 200k:| Cherry Grove: | 0.0% (0) |
| State: | 10.5% (323,812) |
Number of households with income > $200k:| Cherry Grove: | 54.5% (90) |
| State: | 16.2% (499,799) |
Aggregate household income in Cherry Grove in 2022: $28,688,687
Median family income in Cherry Grove in 2022:| Cherry Grove: | $234,841 |
| State: | $109,192 |
Number of families with income $40k - 50k:| Cherry Grove: | 5.4% (8) |
| State: | 4.9% (94,310) |
Number of families with income $60k - 75k:| Cherry Grove: | 12.0% (17) |
| Washington: | 8.2% (158,348) |
Number of families with income $75k - 100k:| Cherry Grove: | 19.4% (28) |
| State: | 13.8% (267,812) |
Number of families with income > $200k:| Cherry Grove: | 63.2% (90) |
| State: | 20.4% (393,898) |
Median income for families with 0 earners:| Cherry Grove: | $0 |
| Washington: | $60,470 |
Median income for families with 1 earner:| Cherry Grove: | $0 |
| State: | $83,136 |
Median income for families with 2 earners:| Cherry Grove: | $0 |
| Washington: | $135,539 |
Median income for families with 3+ earners:| Cherry Grove: | $274,312 |
| Washington: | $163,538 |
Median per capita income in Cherry Grove in 2022:| Cherry Grove: | $62,443 |
| State: | $50,764 |
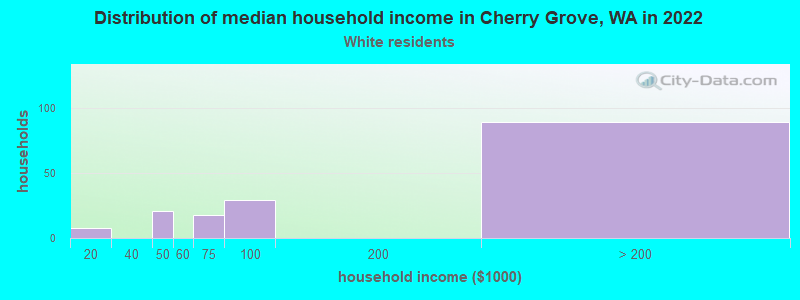
Income statistics for White residents
Number of households with income < $10k:| Cherry Grove: | 0.0% (0) |
| State: | 4.3% (95,850) |
Number of households with income $10k - 20k:| Cherry Grove: | 4.8% (8) |
| State: | 4.8% (106,421) |
Number of households with income $20k - 30k:| Cherry Grove: | 0.0% (0) |
| State: | 5.5% (122,860) |
Number of households with income $30k - 40k:| Cherry Grove: | 0.0% (0) |
| State: | 5.4% (119,627) |
Number of households with income $40k - 50k:| Cherry Grove: | 12.7% (21) |
| State: | 5.9% (132,276) |
Number of households with income $50k - 60k:| Cherry Grove: | 0.0% (0) |
| Washington: | 6.1% (136,212) |
Number of households with income $60k - 75k:| Cherry Grove: | 10.9% (18) |
| Washington: | 8.8% (196,086) |
Number of households with income $75k - 100k:| Cherry Grove: | 17.6% (29) |
| Washington: | 13.4% (299,192) |
Number of households with income $100k - 125k:| Cherry Grove: | 0.0% (0) |
| State: | 11.3% (252,209) |
Number of households with income $125k - 150k:| Cherry Grove: | 0.0% (0) |
| Washington: | 7.9% (175,962) |
Number of households with income $150k - 200k:| Cherry Grove: | 0.0% (0) |
| State: | 10.7% (239,156) |
Number of households with income > $200k:| Cherry Grove: | 53.9% (89) |
| Washington: | 16.1% (359,917) |
Aggregate household income in Cherry Grove in 2022: $27,556,736
Median family income in Cherry Grove in 2022:| Cherry Grove: | $233,992 |
| State: | $112,511 |
Number of families with income $40k - 50k:| Cherry Grove: | 5.3% (7) |
| State: | 4.6% (63,009) |
Number of families with income $60k - 75k:| Cherry Grove: | 12.3% (17) |
| State: | 8.2% (112,369) |
Number of families with income $75k - 100k:| Cherry Grove: | 19.5% (27) |
| Washington: | 14.1% (194,214) |
Number of families with income > $200k:| Cherry Grove: | 62.9% (87) |
| State: | 20.8% (285,982) |
Median per capita income in Cherry Grove in 2022:| Cherry Grove: | $64,185 |
| State: | $55,212 |
Income statistics for Black or African American residents
Median per capita income in Cherry Grove in 2022:| Cherry Grove: | $63,935 |
| State: | $38,209 |
Change in median per capita income between 2000 and 2022:| Cherry Grove, Washington: | +93.7% |
| State: | +115.3% |
Income statistics for Hispanic or Latino residents
Median per capita income in Cherry Grove in 2022:| Cherry Grove: | $10,775 |
| State: | $28,252 |
Change in median per capita income between 2000 and 2022:| Cherry Grove, Washington: | +137.1% |
| State: | +150.2% |
Income statistics for Multirace residents
Median per capita income in Cherry Grove in 2022:| Cherry Grove: | $25,182 |
| Washington: | $32,496 |
Change in median per capita income between 2000 and 2022:| Cherry Grove, Washington: | +146.5% |
| State: | +156.8% |