The median household income in Chesterfield, SC in 2022 was $52,635, which was 21.8% less than the median annual income of $64,115 across the entire state of South Carolina. Compared to the median income of $25,833 in 2000 this represents an increase of 50.9%. The per capita income in 2022 was $26,624, which means an increase of 38.1% compared to 2000 when it was $16,481.
Whole page based on the data from 2000 / 2022 when the population of Chesterfield, South Carolina was 1,318 / 1,463
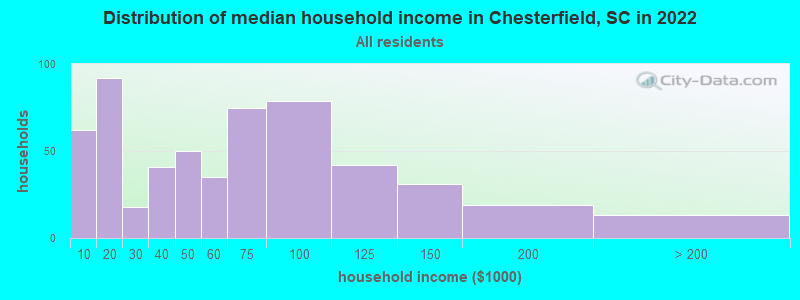
Income statistics for all residents
Median household income in Chesterfield, SC in 2022:
Chesterfield:
$52,636
South Carolina:
$64,115
Change in median household income between 2000 and 2022:
Chesterfield, South Carolina:
+103.8%
State:
+72.9%
Number of households with income < $10k:
Chesterfield:
11.1% (62)
State:
6.1% (130,922)
Number of households with income $10k - 20k:
Chesterfield:
16.5% (92)
State:
7.9% (168,918)
Number of households with income $20k - 30k:
Chesterfield:
3.2% (18)
South Carolina:
8.0% (171,564)
Number of households with income $30k - 40k:
Chesterfield:
7.4% (41)
State:
9.2% (195,662)
Number of households with income $40k - 50k:
Chesterfield:
9.0% (50)
State:
8.2% (176,179)
Number of households with income $50k - 60k:
Chesterfield:
6.3% (35)
State:
7.5% (159,159)
Number of households with income $60k - 75k:
Chesterfield:
13.5% (75)
State:
9.9% (211,862)
Number of households with income $75k - 100k:
Chesterfield:
14.2% (79)
State:
13.5% (287,601)
Number of households with income $100k - 125k:
Chesterfield:
7.5% (42)
State:
9.3% (199,068)
Number of households with income $125k - 150k:
Chesterfield:
5.6% (31)
South Carolina:
6.2% (133,330)
Number of households with income $150k - 200k:
Chesterfield:
3.4% (19)
State:
6.6% (141,363)
Number of households with income > $200k:
Chesterfield:
2.3% (13)
State:
7.5% (160,452)
Aggregate household income in Chesterfield in 2022: $37,798,468
Median family income in Chesterfield in 2022:
Chesterfield:
$66,575
South Carolina:
$79,886
Number of families with income < $10k:
Chesterfield:
12.2% (43)
South Carolina:
3.7% (51,214)
Number of families with income $10k - 20k:
Chesterfield:
10.7% (38)
South Carolina:
4.5% (63,460)
Number of families with income $30k - 40k:
Chesterfield:
4.3% (15)
South Carolina:
7.5% (105,475)
Number of families with income $40k - 50k:
Chesterfield:
9.1% (32)
State:
7.7% (107,666)
Number of families with income $50k - 60k:
Chesterfield:
5.7% (20)
State:
7.1% (98,803)
Number of families with income $60k - 75k:
Chesterfield:
16.7% (59)
State:
9.9% (138,412)
Number of families with income $75k - 100k:
Chesterfield:
15.2% (54)
State:
15.4% (214,716)
Number of families with income $100k - 125k:
Chesterfield:
10.8% (38)
State:
11.4% (159,999)
Number of families with income $125k - 150k:
Chesterfield:
8.1% (29)
State:
8.0% (112,152)
Number of families with income $150k - 200k:
Chesterfield:
5.5% (19)
State:
8.8% (123,525)
Number of families with income > $200k:
Chesterfield:
1.8% (7)
South Carolina:
10.1% (140,575)
Median non-family income in Chesterfield in 2022:
Chesterfield:
$31,840
State:
$38,426
Change in median non-family income between 2000 and 2022:
Chesterfield, South Carolina:
+104.3%
South Carolina:
+78.7%
Median per capita income in Chesterfield in 2022:
Chesterfield:
$26,625
State:
$36,675
Change in median per capita income between 2000 and 2022:
Chesterfield, South Carolina:
+61.5%
South Carolina:
+95.1%
Income statistics for White residents
Median household income in Chesterfield, SC in 2022:
Chesterfield:
$60,256
State:
$73,516
Change in median household income between 2000 and 2022:
Chesterfield, South Carolina:
+74.2%
State:
+74.8%
Number of households with income < $10k:
Chesterfield:
8.5% (33)
State:
4.8% (68,379)
Number of households with income $10k - 20k:
Chesterfield:
13.4% (52)
State:
5.9% (85,105)
Number of households with income $20k - 30k:
Chesterfield:
4.6% (18)
State:
7.1% (101,178)
Number of households with income $30k - 40k:
Chesterfield:
9.5% (37)
State:
8.0% (114,877)
Number of households with income $40k - 50k:
Chesterfield:
7.2% (28)
State:
7.9% (112,749)
Number of households with income $50k - 60k:
Chesterfield:
6.2% (24)
South Carolina:
7.1% (101,835)
Number of households with income $60k - 75k:
Chesterfield:
13.4% (52)
State:
10.2% (145,879)
Number of households with income $75k - 100k:
Chesterfield:
14.7% (57)
South Carolina:
14.0% (200,068)
Number of households with income $100k - 125k:
Chesterfield:
10.6% (41)
State:
10.4% (148,542)
Number of households with income $125k - 150k:
Chesterfield:
4.9% (19)
South Carolina:
7.3% (105,118)
Number of households with income $150k - 200k:
Chesterfield:
3.6% (14)
State:
8.0% (114,506)
Number of households with income > $200k:
Chesterfield:
3.4% (13)
State:
9.3% (133,550)
Aggregate household income in Chesterfield in 2022: $28,840,573
Median family income in Chesterfield in 2022:
Chesterfield:
$72,714
State:
$90,709
Number of families with income < $10k:
Chesterfield:
10.2% (23)
State:
2.4% (22,376)
Number of families with income $10k - 20k:
Chesterfield:
7.9% (18)
State:
3.0% (28,325)
Number of families with income $30k - 40k:
Chesterfield:
6.6% (15)
State:
6.1% (57,510)
Number of families with income $40k - 50k:
Chesterfield:
6.1% (14)
South Carolina:
7.0% (66,712)
Number of families with income $50k - 60k:
Chesterfield:
4.3% (10)
State:
6.6% (62,489)
Number of families with income $60k - 75k:
Chesterfield:
16.4% (37)
State:
10.0% (94,724)
Number of families with income $75k - 100k:
Chesterfield:
15.9% (36)
State:
15.5% (147,207)
Number of families with income $100k - 125k:
Chesterfield:
16.4% (37)
South Carolina:
12.5% (118,160)
Number of families with income $125k - 150k:
Chesterfield:
7.4% (17)
State:
9.5% (90,395)
Number of families with income $150k - 200k:
Chesterfield:
6.1% (14)
State:
10.6% (100,043)
Number of families with income > $200k:
Chesterfield:
2.8% (6)
State:
12.4% (117,500)
Median non-family income in Chesterfield in 2022:
Chesterfield:
$38,796
State:
$42,596
Change in median non-family income between 2000 and 2022:
Chesterfield, South Carolina:
+112.8%
State:
+74.9%
Median per capita income in Chesterfield in 2022:
Chesterfield:
$34,100
State:
$42,728
Change in median per capita income between 2000 and 2022:
Chesterfield, South Carolina:
+61.4%
South Carolina:
+93.4%
Income statistics for Black or African American residents
Number of households with income < $10k:
Chesterfield:
21.1% (28)
South Carolina:
10.0% (52,303)
Number of households with income $10k - 20k:
Chesterfield:
27.8% (37)
State:
13.4% (69,913)
Number of households with income $20k - 30k:
Chesterfield:
0.0% (0)
State:
10.4% (54,216)
Number of households with income $30k - 40k:
Chesterfield:
0.0% (0)
State:
12.0% (62,722)
Number of households with income $40k - 50k:
Chesterfield:
15.8% (21)
State:
9.2% (47,773)
Number of households with income $50k - 60k:
Chesterfield:
7.5% (10)
State:
8.3% (43,083)
Number of households with income $60k - 75k:
Chesterfield:
15.8% (21)
State:
9.3% (48,640)
Number of households with income $75k - 100k:
Chesterfield:
12.0% (16)
State:
12.2% (63,723)
Number of households with income $100k - 125k:
Chesterfield:
0.0% (0)
South Carolina:
6.4% (33,117)
Number of households with income $125k - 150k:
Chesterfield:
0.0% (0)
State:
3.2% (16,465)
Number of households with income $150k - 200k:
Chesterfield:
0.0% (0)
South Carolina:
3.2% (16,672)
Number of households with income > $200k:
Chesterfield:
0.0% (0)
State:
2.3% (12,213)
Aggregate household income in Chesterfield in 2022: $5,184,075
Median family income in Chesterfield in 2022:
Chesterfield:
$47,164
State:
$54,267
Number of families with income < $10k:
Chesterfield:
19.4% (19)
State:
7.3% (23,752)
Number of families with income $10k - 20k:
Chesterfield:
18.2% (18)
State:
8.5% (27,789)
Number of families with income $40k - 50k:
Chesterfield:
19.0% (19)
South Carolina:
9.5% (30,858)
Number of families with income $50k - 60k:
Chesterfield:
11.0% (11)
State:
8.7% (28,419)
Number of families with income $60k - 75k:
Chesterfield:
20.0% (20)
State:
9.6% (31,402)
Number of families with income $75k - 100k:
Chesterfield:
12.4% (12)
South Carolina:
15.2% (49,441)
Median non-family income in Chesterfield in 2022:
Chesterfield:
$18,573
State:
$28,585
Change in median non-family income between 2000 and 2022:
Chesterfield, South Carolina:
+72.3%
State:
+100.5%
Median per capita income in Chesterfield in 2022:
Chesterfield:
$11,412
State:
$24,863
Change in median per capita income between 2000 and 2022:
Chesterfield, South Carolina:
+42.7%
South Carolina:
+111.1%
Income statistics for Asian residents
Aggregate household income in Chesterfield in 2022: $810,376
Median per capita income in Chesterfield in 2022:
Chesterfield:
$65,768
State:
$48,909
Income statistics for Hispanic or Latino residents
Median per capita income in Chesterfield in 2022:
Chesterfield:
$36,412
State:
$23,692
Change in median per capita income between 2000 and 2022:
Chesterfield, South Carolina:
+87.9%
State:
+95.1%
Income statistics for Multirace residents
Median household income in Chesterfield, SC in 2022:
Chesterfield:
$131,168
South Carolina:
$61,314
Number of households with income < $10k:
Chesterfield:
0.0% (0)
State:
6.9% (6,974)
Number of households with income $10k - 20k:
Chesterfield:
0.0% (0)
State:
8.0% (8,052)
Number of households with income $20k - 30k:
Chesterfield:
0.0% (0)
State:
9.9% (9,972)
Number of households with income $30k - 40k:
Chesterfield:
17.4% (4)
State:
10.0% (10,121)
Number of households with income $40k - 50k:
Chesterfield:
0.0% (0)
State:
8.1% (8,188)
Number of households with income $50k - 60k:
Chesterfield:
0.0% (0)
South Carolina:
6.5% (6,530)
Number of households with income $60k - 75k:
Chesterfield:
0.0% (0)
South Carolina:
8.9% (9,021)
Number of households with income $75k - 100k:
Chesterfield:
0.0% (0)
South Carolina:
13.4% (13,544)
Number of households with income $100k - 125k:
Chesterfield:
0.0% (0)
State:
9.8% (9,916)
Number of households with income $125k - 150k:
Chesterfield:
52.2% (12)
South Carolina:
6.6% (6,657)
Number of households with income $150k - 200k:
Chesterfield:
30.4% (7)
State:
5.9% (5,979)
Number of households with income > $200k:
Chesterfield:
0.0% (0)
State:
6.2% (6,266)
Aggregate household income in Chesterfield in 2022: $2,925,399
Median per capita income in Chesterfield in 2022:
Chesterfield:
$40,272
South Carolina:
$26,391
Discuss Chesterfield, South Carolina (SC) on our hugely popular South Carolina forum.