The median household income in Chinook, MT in 2022 was $47,982, which was 41.0% less than the median annual income of $67,631 across the entire state of Montana. Compared to the median income of $25,461 in 2000 this represents an increase of 46.9%. The per capita income in 2022 was $37,525, which means an increase of 57.3% compared to 2000 when it was $16,038.
Whole page based on the data from 2000 / 2022 when the population of Chinook, Montana was 1,386 / 1,530
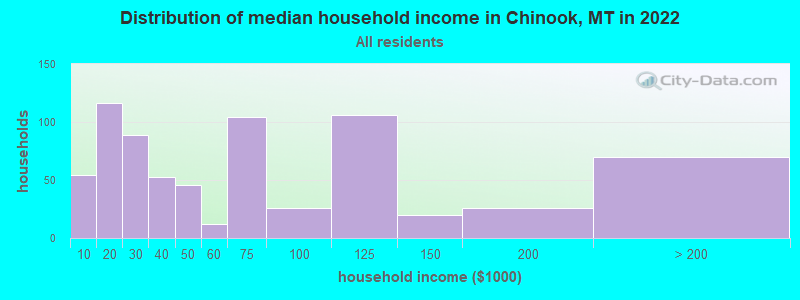
Income statistics for all residents
Median household income in Chinook, MT in 2022:
Chinook:
$47,982
Montana:
$67,631
Change in median household income between 2000 and 2022:
Chinook, Montana:
+88.5%
State:
+104.8%
Number of households with income < $10k:
Chinook:
7.5% (54)
Montana:
5.0% (23,231)
Number of households with income $10k - 20k:
Chinook:
16.1% (116)
State:
8.1% (37,478)
Number of households with income $20k - 30k:
Chinook:
12.3% (89)
Montana:
7.3% (33,880)
Number of households with income $30k - 40k:
Chinook:
7.3% (53)
State:
8.4% (38,912)
Number of households with income $40k - 50k:
Chinook:
6.4% (46)
State:
8.3% (38,441)
Number of households with income $50k - 60k:
Chinook:
1.7% (12)
State:
7.4% (34,172)
Number of households with income $60k - 75k:
Chinook:
14.4% (104)
State:
10.5% (48,783)
Number of households with income $75k - 100k:
Chinook:
3.6% (26)
State:
15.0% (69,571)
Number of households with income $100k - 125k:
Chinook:
14.7% (106)
Montana:
9.9% (45,889)
Number of households with income $125k - 150k:
Chinook:
2.8% (20)
Montana:
6.1% (28,538)
Number of households with income $150k - 200k:
Chinook:
3.6% (26)
State:
6.6% (30,552)
Number of households with income > $200k:
Chinook:
9.7% (70)
State:
7.5% (34,625)
Aggregate household income in Chinook in 2022: $55,694,640
Median family income in Chinook in 2022:
Chinook:
$102,162
State:
$83,580
Number of families with income < $10k:
Chinook:
1.1% (4)
State:
2.6% (7,229)
Number of families with income $10k - 20k:
Chinook:
3.3% (13)
State:
3.4% (9,550)
Number of families with income $20k - 30k:
Chinook:
6.8% (26)
Montana:
4.8% (13,650)
Number of families with income $30k - 40k:
Chinook:
3.2% (12)
Montana:
6.5% (18,237)
Number of families with income $40k - 50k:
Chinook:
7.1% (27)
State:
6.8% (19,174)
Number of families with income $60k - 75k:
Chinook:
15.9% (60)
Montana:
11.6% (32,619)
Number of families with income $75k - 100k:
Chinook:
6.9% (26)
State:
17.1% (48,328)
Number of families with income $100k - 125k:
Chinook:
28.0% (105)
State:
12.8% (36,048)
Number of families with income $125k - 150k:
Chinook:
2.7% (10)
Montana:
8.3% (23,444)
Number of families with income $150k - 200k:
Chinook:
7.2% (27)
Montana:
9.3% (26,290)
Number of families with income > $200k:
Chinook:
17.8% (67)
Montana:
9.5% (26,804)
Median non-family income in Chinook in 2022:
Chinook:
$25,530
State:
$40,582
Change in median non-family income between 2000 and 2022:
Chinook, Montana:
+42.6%
Montana:
+108.3%
Median per capita income in Chinook in 2022:
Chinook:
$37,526
Montana:
$38,329
Change in median per capita income between 2000 and 2022:
Chinook, Montana:
+134.0%
State:
+123.5%
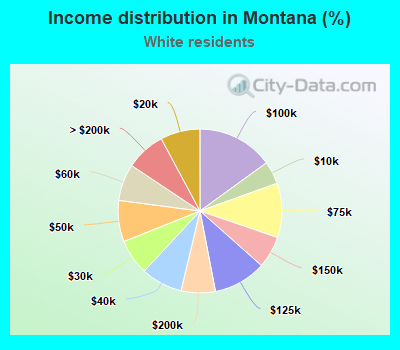
Income statistics for White residents
Median household income in Chinook, MT in 2022:
Chinook:
$48,369
Montana:
$69,744
Change in median household income between 2000 and 2022:
Chinook, Montana:
+84.3%
Montana:
+106.5%
Number of households with income < $10k:
Chinook:
7.7% (53)
Montana:
4.5% (18,406)
Number of households with income $10k - 20k:
Chinook:
14.8% (102)
State:
7.8% (32,061)
Number of households with income $20k - 30k:
Chinook:
12.4% (86)
Montana:
7.0% (28,825)
Number of households with income $30k - 40k:
Chinook:
7.5% (52)
State:
8.2% (33,552)
Number of households with income $40k - 50k:
Chinook:
6.7% (46)
Montana:
8.2% (33,446)
Number of households with income $50k - 60k:
Chinook:
1.7% (12)
State:
7.3% (29,753)
Number of households with income $60k - 75k:
Chinook:
14.9% (103)
State:
10.7% (44,051)
Number of households with income $75k - 100k:
Chinook:
3.6% (25)
Montana:
15.0% (61,580)
Number of households with income $100k - 125k:
Chinook:
15.3% (106)
State:
10.4% (42,636)
Number of households with income $125k - 150k:
Chinook:
1.4% (10)
State:
6.3% (25,938)
Number of households with income $150k - 200k:
Chinook:
3.8% (26)
State:
6.8% (27,704)
Number of households with income > $200k:
Chinook:
10.1% (70)
State:
7.8% (32,101)
Aggregate household income in Chinook in 2022: $52,907,324
Median family income in Chinook in 2022:
Chinook:
$102,783
State:
$86,163
Number of families with income < $10k:
Chinook:
1.1% (4)
Montana:
2.0% (4,963)
Number of families with income $10k - 20k:
Chinook:
0.5% (2)
State:
2.8% (7,063)
Number of families with income $20k - 30k:
Chinook:
7.0% (25)
State:
4.5% (11,218)
Number of families with income $30k - 40k:
Chinook:
3.3% (12)
State:
6.0% (14,834)
Number of families with income $40k - 50k:
Chinook:
7.4% (26)
Montana:
6.8% (16,997)
Number of families with income $60k - 75k:
Chinook:
16.2% (58)
State:
11.6% (28,681)
Number of families with income $75k - 100k:
Chinook:
7.0% (25)
State:
17.2% (42,622)
Number of families with income $100k - 125k:
Chinook:
29.2% (105)
Montana:
13.5% (33,620)
Number of families with income $125k - 150k:
Chinook:
2.8% (10)
State:
8.7% (21,654)
Number of families with income $150k - 200k:
Chinook:
7.2% (26)
State:
9.6% (23,873)
Number of families with income > $200k:
Chinook:
18.4% (66)
Montana:
10.0% (24,758)
Median non-family income in Chinook in 2022:
Chinook:
$24,755
Montana:
$41,403
Change in median non-family income between 2000 and 2022:
Chinook, Montana:
+35.3%
State:
+109.4%
Median per capita income in Chinook in 2022:
Chinook:
$38,646
State:
$40,453
Change in median per capita income between 2000 and 2022:
Chinook, Montana:
+133.6%
State:
+125.6%
Income statistics for Black or African American residents
Aggregate household income in Chinook in 2022: $52,386
Median per capita income in Chinook in 2022:
Chinook:
$14,972
State:
$55,327
Income statistics for American Indian and Alaska Native residents
Median per capita income in Chinook in 2022:
Chinook:
$4,060
State:
$19,038
Change in median per capita income between 2000 and 2022:: -63.3%
Chinook, Montana:
-63.3%
Montana:
+114.7%
Income statistics for other residents
Number of households with income < $10k:
Chinook:
0.0% (0)
State:
4.0% (142)
Number of households with income $10k - 20k:
Chinook:
0.0% (0)
State:
8.0% (282)
Number of households with income $20k - 30k:
Chinook:
0.0% (0)
State:
7.4% (260)
Number of households with income $30k - 40k:
Chinook:
0.0% (0)
State:
12.9% (455)
Number of households with income $40k - 50k:
Chinook:
0.0% (0)
Montana:
7.1% (251)
Number of households with income $50k - 60k:
Chinook:
0.0% (0)
State:
7.4% (262)
Number of households with income $60k - 75k:
Chinook:
0.0% (0)
Montana:
7.8% (277)
Number of households with income $75k - 100k:
Chinook:
0.0% (0)
State:
10.6% (376)
Number of households with income $100k - 125k:
Chinook:
0.0% (0)
Montana:
10.3% (365)
Number of households with income $125k - 150k:
Chinook:
100.0% (13)
State:
12.1% (426)
Number of households with income $150k - 200k:
Chinook:
0.0% (0)
State:
4.5% (159)
Number of households with income > $200k:
Chinook:
0.0% (0)
State:
7.8% (277)
Median per capita income in Chinook in 2022:
Chinook:
$148,779
Montana:
$23,968
Discuss Chinook, Montana (MT) on our hugely popular Montana forum.