Clinchmore, Tennessee (TN) income map, earnings map, and wages data
The median household income in Clinchmore, TN in 2022 was $38,675, which was 68.7% less than the median annual income of $65,254 across the entire state of Tennessee. Compared to the median income of $21,591 in 2000 this represents an increase of 44.2%. The per capita income in 2022 was $17,657, which means an increase of 47.0% compared to 2000 when it was $9,362.
Income statistics for all residents
Median household income in Clinchmore, TN in 2022:| Clinchmore: | $38,676 |
| Tennessee: | $65,254 |
Change in median household income between 2000 and 2022:| Clinchmore, Tennessee: | +79.1% |
| State: | +79.5% |
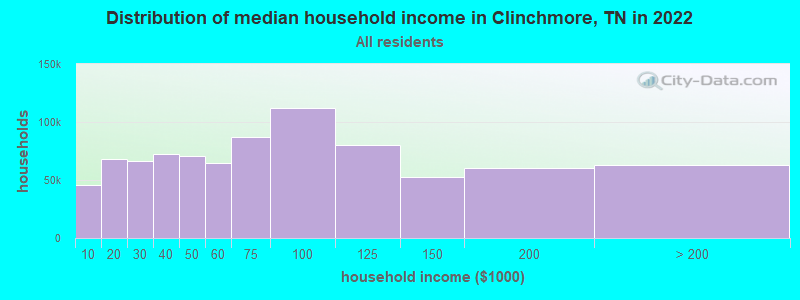
Number of households with income < $10k:| Clinchmore: | 5.4% (45,894) |
| Tennessee: | 5.4% (154,793) |
Number of households with income $10k - 20k:| Clinchmore: | 8.0% (67,875) |
| State: | 8.0% (228,599) |
Number of households with income $20k - 30k:| Clinchmore: | 7.9% (66,750) |
| State: | 7.9% (224,908) |
Number of households with income $30k - 40k:| Clinchmore: | 8.6% (72,454) |
| State: | 8.6% (244,297) |
Number of households with income $40k - 50k:| Clinchmore: | 8.4% (70,859) |
| State: | 8.4% (238,949) |
Number of households with income $50k - 60k:| Clinchmore: | 7.7% (64,785) |
| State: | 7.7% (218,438) |
Number of households with income $60k - 75k:| Clinchmore: | 10.3% (87,259) |
| State: | 10.3% (294,172) |
Number of households with income $75k - 100k:| Clinchmore: | 13.3% (111,912) |
| Tennessee: | 13.3% (377,310) |
Number of households with income $100k - 125k:| Clinchmore: | 9.5% (79,866) |
| State: | 9.5% (269,124) |
Number of households with income $125k - 150k:| Clinchmore: | 6.3% (52,859) |
| State: | 6.3% (178,328) |
Number of households with income $150k - 200k:| Clinchmore: | 7.2% (60,452) |
| State: | 7.2% (204,030) |
Number of households with income > $200k:| Clinchmore: | 7.5% (63,205) |
| Tennessee: | 7.5% (213,736) |
Aggregate household income in Clinchmore in 2022: $160,497,399
Median family income in Clinchmore in 2022:| Clinchmore: | $49,196 |
| State: | $80,910 |
Median non-family income in Clinchmore in 2022:| Clinchmore: | $31,133 |
| State: | $40,285 |
Change in median non-family income between 2000 and 2022:| Clinchmore, Tennessee: | +91.6% |
| State: | +91.5% |
Median per capita income in Clinchmore in 2022:| Clinchmore: | $17,658 |
| State: | $36,704 |
Change in median per capita income between 2000 and 2022:| Clinchmore, Tennessee: | +88.6% |
| State: | +89.3% |
Income statistics for White residents
Median household income in Clinchmore, TN in 2022:| Clinchmore: | $39,046 |
| State: | $69,826 |
Change in median household income between 2000 and 2022:| Clinchmore, Tennessee: | +80.8% |
| Tennessee: | +82.9% |
Number of households with income < $10k:| Clinchmore: | 4.7% (28,407) |
| Tennessee: | 4.6% (100,279) |
Number of households with income $10k - 20k:| Clinchmore: | 7.7% (46,824) |
| State: | 7.6% (165,031) |
Number of households with income $20k - 30k:| Clinchmore: | 7.5% (45,446) |
| State: | 7.4% (160,229) |
Number of households with income $30k - 40k:| Clinchmore: | 8.1% (49,309) |
| State: | 8.1% (174,784) |
Number of households with income $40k - 50k:| Clinchmore: | 7.9% (47,916) |
| State: | 7.8% (169,622) |
Number of households with income $50k - 60k:| Clinchmore: | 7.7% (46,640) |
| State: | 7.6% (165,508) |
Number of households with income $60k - 75k:| Clinchmore: | 10.4% (63,192) |
| State: | 10.3% (223,937) |
Number of households with income $75k - 100k:| Clinchmore: | 13.5% (82,394) |
| State: | 13.5% (292,688) |
Number of households with income $100k - 125k:| Clinchmore: | 10.1% (61,720) |
| Tennessee: | 10.1% (219,251) |
Number of households with income $125k - 150k:| Clinchmore: | 6.6% (39,994) |
| State: | 6.6% (142,574) |
Number of households with income $150k - 200k:| Clinchmore: | 7.6% (46,468) |
| Tennessee: | 7.7% (166,039) |
Number of households with income > $200k:| Clinchmore: | 8.4% (51,207) |
| State: | 8.5% (184,546) |
Aggregate household income in Clinchmore in 2022: $129,092,638
Median family income in Clinchmore in 2022:| Clinchmore: | $49,398 |
| State: | $86,015 |
Number of families with income < $10k:| Clinchmore: | 10.6% (5) |
| State: | 3.1% (43,751) |
Number of families with income $10k - 20k:| Clinchmore: | 22.2% (9) |
| State: | 3.5% (49,925) |
Number of families with income $20k - 30k:| Clinchmore: | 7.9% (3) |
| Tennessee: | 5.0% (70,431) |
Number of families with income $30k - 40k:| Clinchmore: | 32.5% (14) |
| State: | 6.6% (93,498) |
Number of families with income $40k - 50k:| Clinchmore: | 11.2% (5) |
| State: | 6.8% (96,726) |
Number of families with income $75k - 100k:| Clinchmore: | 15.5% (7) |
| Tennessee: | 15.4% (218,373) |
Median non-family income in Clinchmore in 2022:| Clinchmore: | $31,051 |
| State: | $41,178 |
Change in median non-family income between 2000 and 2022:| Clinchmore, Tennessee: | +91.1% |
| State: | +91.1% |
Median per capita income in Clinchmore in 2022:| Clinchmore: | $18,566 |
| State: | $40,126 |
Change in median per capita income between 2000 and 2022:| Clinchmore, Tennessee: | +91.8% |
| Tennessee: | +92.6% |