Dryville, Pennsylvania (PA) income map, earnings map, and wages data

Data:
The per capita income in 2022 was $40,518, which means an increase of 47.6% compared to 2000 when it was $21,232.
Whole page based on the data from 2000 / 2022 when the population of Dryville, Pennsylvania was 398 / 186
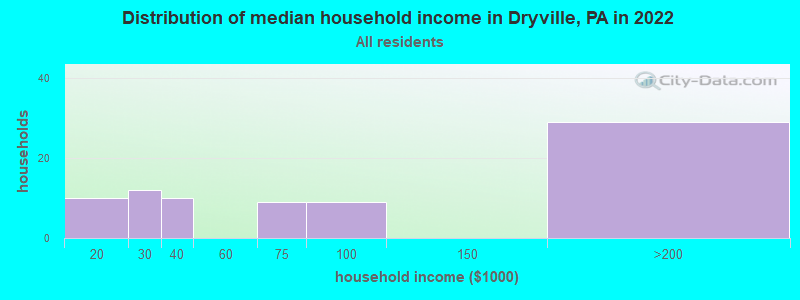
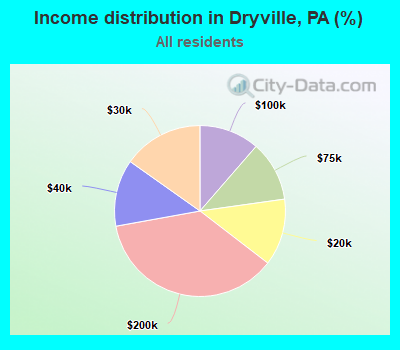
Income statistics for all residents
Number of households with income < $10k:| Dryville: | 0.0% (0) |
| Pennsylvania: | 5.5% (291,562) |
Number of households with income $10k - 20k:| Dryville: | 12.7% (10) |
| State: | 7.3% (384,726) |
Number of households with income $20k - 30k:| Dryville: | 15.2% (12) |
| State: | 7.4% (389,464) |
Number of households with income $30k - 40k:| Dryville: | 12.7% (10) |
| State: | 7.6% (402,138) |
Number of households with income $40k - 50k:| Dryville: | 0.0% (0) |
| Pennsylvania: | 7.3% (387,945) |
Number of households with income $50k - 60k:| Dryville: | 0.0% (0) |
| State: | 7.0% (372,468) |
Number of households with income $60k - 75k:| Dryville: | 11.4% (9) |
| State: | 9.9% (524,786) |
Number of households with income $75k - 100k:| Dryville: | 11.4% (9) |
| State: | 12.6% (666,253) |
Number of households with income $100k - 125k:| Dryville: | 0.0% (0) |
| Pennsylvania: | 9.9% (526,402) |
Number of households with income $125k - 150k:| Dryville: | 0.0% (0) |
| State: | 6.9% (362,702) |
Number of households with income $150k - 200k:| Dryville: | 36.7% (29) |
| State: | 8.3% (440,827) |
Number of households with income > $200k:| Dryville: | 0.0% (0) |
| State: | 10.3% (544,792) |
Aggregate household income in Dryville in 2022: $7,152,285
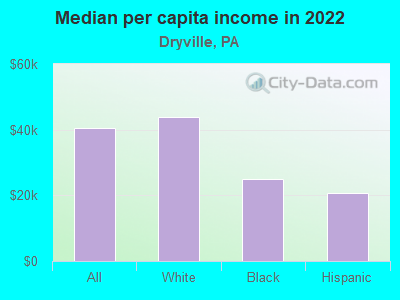
Median per capita income in Dryville in 2022:| Dryville: | $40,518 |
| State: | $41,489 |
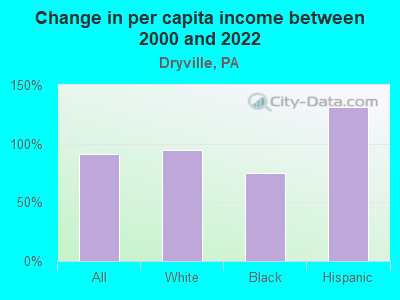
Change in median per capita income between 2000 and 2022:| Dryville, Pennsylvania: | +90.8% |
| Pennsylvania: | +98.7% |
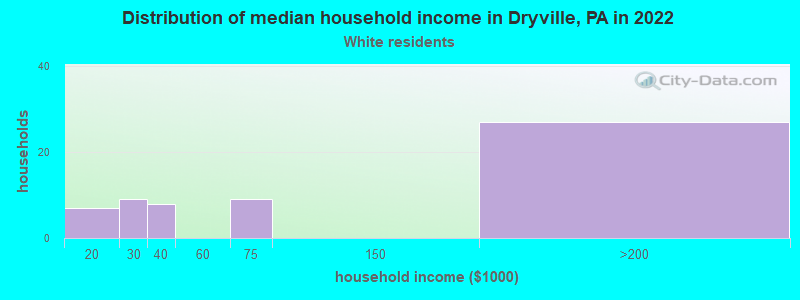
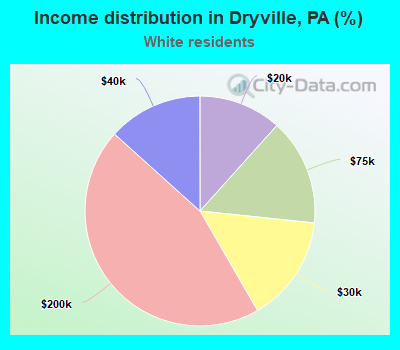
Income statistics for White residents
Number of households with income < $10k:| Dryville: | 0.0% (0) |
| Pennsylvania: | 4.3% (179,792) |
Number of households with income $10k - 20k:| Dryville: | 11.7% (7) |
| Pennsylvania: | 6.5% (268,738) |
Number of households with income $20k - 30k:| Dryville: | 15.0% (9) |
| State: | 7.0% (288,138) |
Number of households with income $30k - 40k:| Dryville: | 13.3% (8) |
| Pennsylvania: | 7.2% (300,208) |
Number of households with income $40k - 50k:| Dryville: | 0.0% (0) |
| State: | 7.2% (298,756) |
Number of households with income $50k - 60k:| Dryville: | 0.0% (0) |
| Pennsylvania: | 6.8% (283,251) |
Number of households with income $60k - 75k:| Dryville: | 15.0% (9) |
| Pennsylvania: | 9.9% (408,159) |
Number of households with income $75k - 100k:| Dryville: | 0.0% (0) |
| Pennsylvania: | 13.2% (547,809) |
Number of households with income $100k - 125k:| Dryville: | 0.0% (0) |
| State: | 10.5% (436,652) |
Number of households with income $125k - 150k:| Dryville: | 0.0% (0) |
| Pennsylvania: | 7.3% (304,132) |
Number of households with income $150k - 200k:| Dryville: | 45.0% (27) |
| State: | 9.0% (374,658) |
Number of households with income > $200k:| Dryville: | 0.0% (0) |
| Pennsylvania: | 10.9% (452,618) |
Aggregate household income in Dryville in 2022: $6,145,364
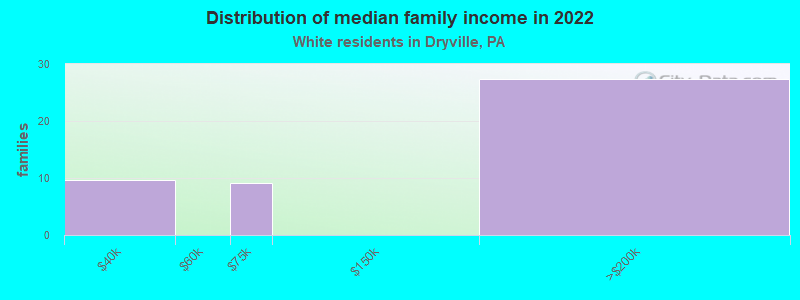
Median family income in Dryville in 2022:| Dryville: | $164,828 |
| State: | $99,396 |
Number of families with income $30k - 40k:| Dryville: | 20.9% (10) |
| Pennsylvania: | 5.2% (134,367) |
Number of families with income $60k - 75k:| Dryville: | 19.9% (9) |
| Pennsylvania: | 9.6% (249,292) |
Number of families with income $150k - 200k:| Dryville: | 59.2% (27) |
| State: | 12.2% (314,926) |
Median per capita income in Dryville in 2022:| Dryville: | $43,948 |
| Pennsylvania: | $45,306 |
Change in median per capita income between 2000 and 2022:| Dryville, Pennsylvania: | +95.5% |
| State: | +105.4% |
Income statistics for Black or African American residents
Aggregate household income in Dryville in 2022: $436,499,700
Median per capita income in Dryville in 2022:| Dryville: | $25,060 |
| State: | $28,010 |
Change in median per capita income between 2000 and 2022:| Dryville, Pennsylvania: | +75.0% |
| Pennsylvania: | +101.5% |
Income statistics for Hispanic or Latino residents
Aggregate household income in Dryville in 2022: $2,004,309,600
Median per capita income in Dryville in 2022:| Dryville: | $20,648 |
| State: | $23,829 |
Change in median per capita income between 2000 and 2022:| Dryville, Pennsylvania: | +131.4% |
| State: | +116.4% |