East Greenwich, Rhode Island (RI) income map, earnings map, and wages data
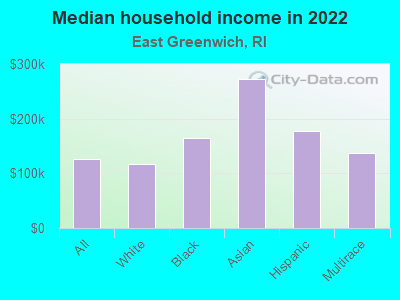
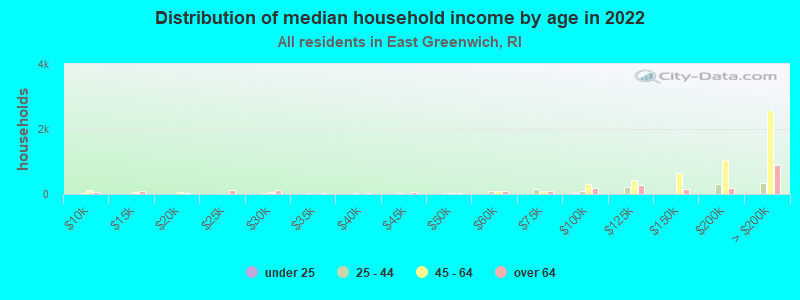
The median household income in East Greenwich, RI in 2022 was $125,649, which was 34.9% greater than the median annual income of $81,854 across the entire state of Rhode Island. Compared to the median income of $70,063 in 2000 this represents an increase of 44.2%. The per capita income in 2022 was $73,539, which means an increase of 47.5% compared to 2000 when it was $38,593.
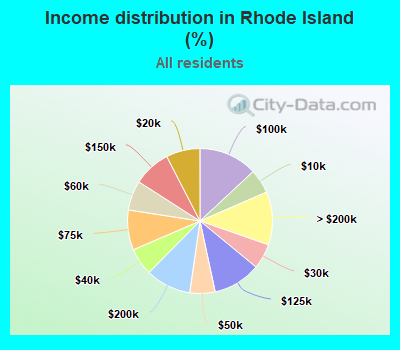
Income statistics for all residents
Median household income in East Greenwich, RI in 2022:| East Greenwich: | $125,649 |
| State: | $81,854 |
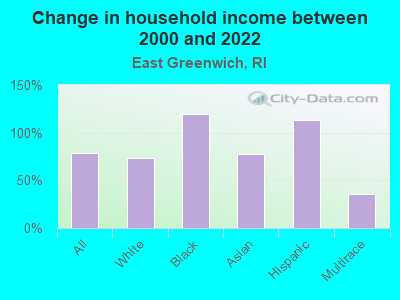
Change in median household income between 2000 and 2022:| East Greenwich, Rhode Island: | +79.3% |
| State: | +94.5% |
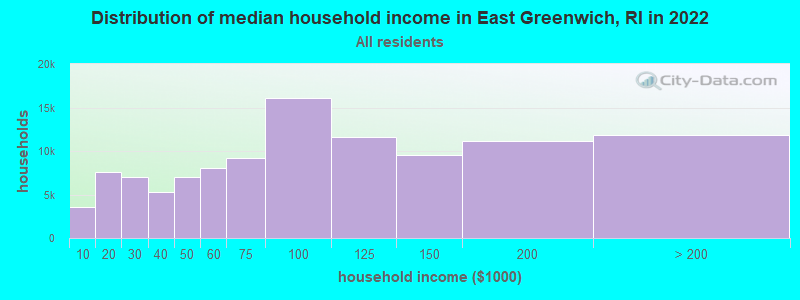
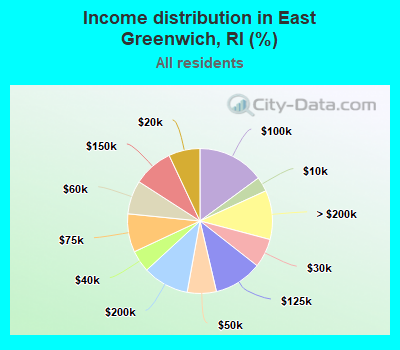
Number of households with income < $10k:| East Greenwich: | 3.3% (3,511) |
| State: | 5.4% (24,165) |
Number of households with income $10k - 20k:| East Greenwich: | 7.0% (7,545) |
| State: | 7.6% (33,817) |
Number of households with income $20k - 30k:| East Greenwich: | 6.5% (6,971) |
| State: | 5.6% (25,137) |
Number of households with income $30k - 40k:| East Greenwich: | 4.9% (5,247) |
| State: | 6.1% (27,221) |
Number of households with income $40k - 50k:| East Greenwich: | 6.5% (6,986) |
| Rhode Island: | 5.6% (25,200) |
Number of households with income $50k - 60k:| East Greenwich: | 7.5% (8,096) |
| Rhode Island: | 6.6% (29,522) |
Number of households with income $60k - 75k:| East Greenwich: | 8.6% (9,226) |
| State: | 8.9% (39,922) |
Number of households with income $75k - 100k:| East Greenwich: | 14.9% (16,082) |
| State: | 13.1% (58,406) |
Number of households with income $100k - 125k:| East Greenwich: | 10.8% (11,618) |
| State: | 10.7% (47,690) |
Number of households with income $125k - 150k:| East Greenwich: | 8.9% (9,593) |
| State: | 8.4% (37,334) |
Number of households with income $150k - 200k:| East Greenwich: | 10.3% (11,130) |
| State: | 10.1% (45,318) |
Number of households with income > $200k:| East Greenwich: | 11.0% (11,806) |
| Rhode Island: | 11.9% (52,956) |
Aggregate household income in East Greenwich in 2022: $1,824,085,541
Median family income in East Greenwich in 2022:| East Greenwich: | $167,577 |
| State: | $105,989 |
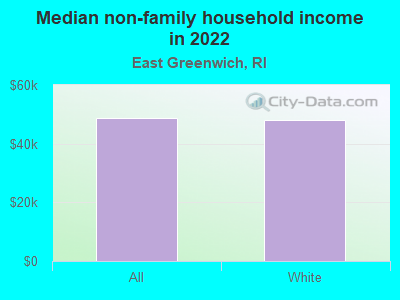
Median non-family income in East Greenwich in 2022:| East Greenwich: | $48,822 |
| State: | $48,459 |
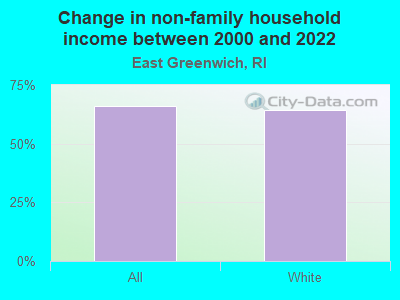
Change in median non-family income between 2000 and 2022:| East Greenwich, Rhode Island: | +65.8% |
| State: | +105.7% |
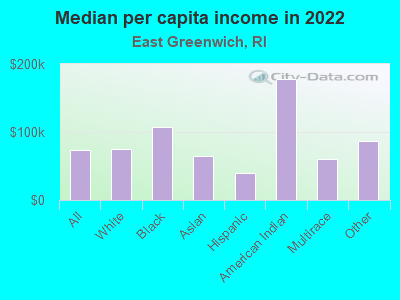
Median per capita income in East Greenwich in 2022:| East Greenwich: | $73,539 |
| State: | $44,538 |
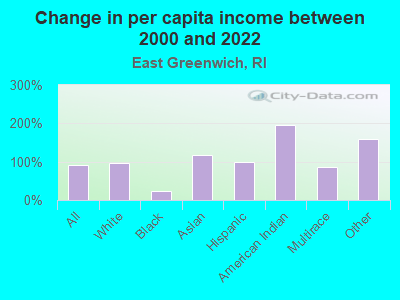
Change in median per capita income between 2000 and 2022:| East Greenwich, Rhode Island: | +90.6% |
| Rhode Island: | +105.4% |
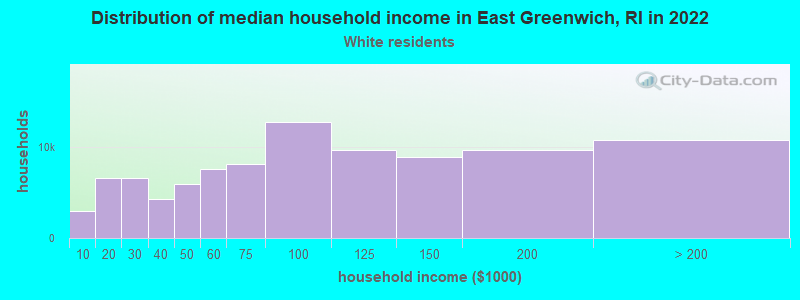
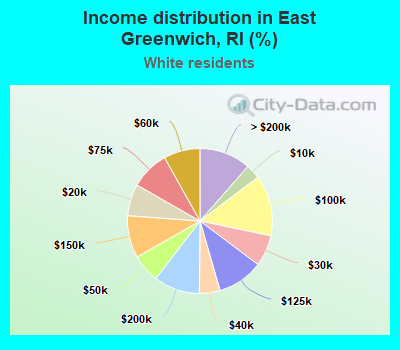
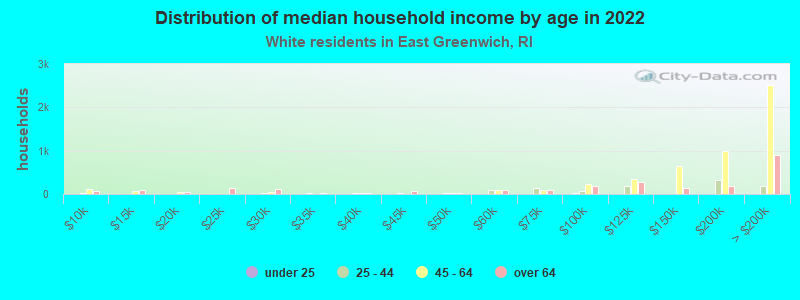
Income statistics for White residents
Median household income in East Greenwich, RI in 2022:| East Greenwich: | $116,874 |
| Rhode Island: | $86,507 |
Change in median household income between 2000 and 2022:| East Greenwich, Rhode Island: | +72.8% |
| Rhode Island: | +93.9% |
Number of households with income < $10k:| East Greenwich: | 3.2% (3,009) |
| Rhode Island: | 4.1% (14,023) |
Number of households with income $10k - 20k:| East Greenwich: | 7.1% (6,608) |
| State: | 6.3% (21,775) |
Number of households with income $20k - 30k:| East Greenwich: | 7.0% (6,528) |
| Rhode Island: | 5.6% (19,359) |
Number of households with income $30k - 40k:| East Greenwich: | 4.6% (4,312) |
| State: | 5.8% (20,001) |
Number of households with income $40k - 50k:| East Greenwich: | 6.3% (5,916) |
| State: | 5.8% (20,112) |
Number of households with income $50k - 60k:| East Greenwich: | 8.1% (7,591) |
| Rhode Island: | 6.8% (23,542) |
Number of households with income $60k - 75k:| East Greenwich: | 8.6% (8,063) |
| State: | 8.8% (30,321) |
Number of households with income $75k - 100k:| East Greenwich: | 13.6% (12,716) |
| State: | 13.0% (44,807) |
Number of households with income $100k - 125k:| East Greenwich: | 10.3% (9,594) |
| State: | 10.9% (37,478) |
Number of households with income $125k - 150k:| East Greenwich: | 9.5% (8,866) |
| State: | 9.3% (32,110) |
Number of households with income $150k - 200k:| East Greenwich: | 10.3% (9,616) |
| Rhode Island: | 10.5% (36,226) |
Number of households with income > $200k:| East Greenwich: | 11.5% (10,750) |
| State: | 13.1% (45,303) |
Aggregate household income in East Greenwich in 2022: $1,565,736,605
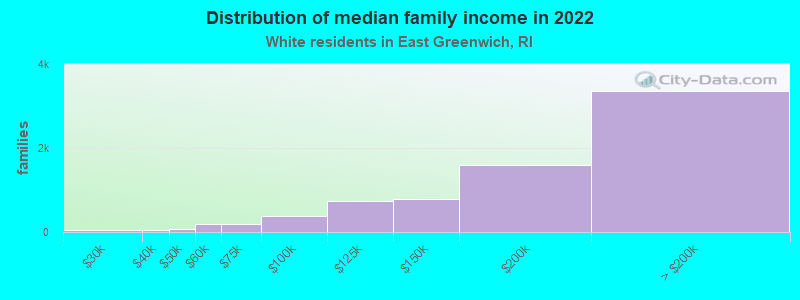
Median family income in East Greenwich in 2022:| East Greenwich: | $173,858 |
| Rhode Island: | $116,800 |
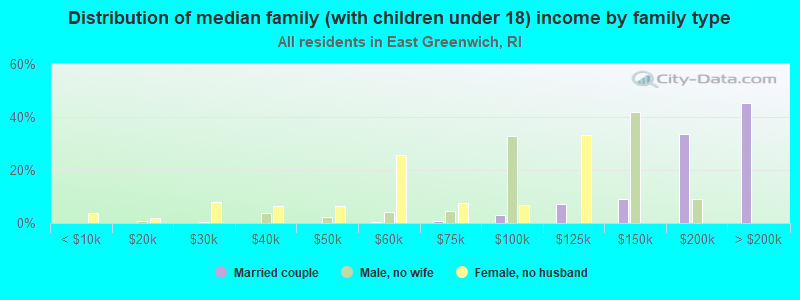
Number of families with income < $10k:| East Greenwich: | 0.3% (20) |
| Rhode Island: | 1.7% (3,325) |
Number of families with income $10k - 20k:| East Greenwich: | 0.3% (25) |
| State: | 2.0% (3,971) |
Number of families with income $20k - 30k:| East Greenwich: | 0.6% (46) |
| State: | 2.3% (4,461) |
Number of families with income $30k - 40k:| East Greenwich: | 0.7% (54) |
| State: | 3.7% (7,222) |
Number of families with income $40k - 50k:| East Greenwich: | 1.0% (72) |
| State: | 3.8% (7,533) |
Number of families with income $50k - 60k:| East Greenwich: | 2.5% (183) |
| Rhode Island: | 6.0% (11,742) |
Number of families with income $60k - 75k:| East Greenwich: | 2.6% (190) |
| State: | 9.1% (17,914) |
Number of families with income $75k - 100k:| East Greenwich: | 5.2% (385) |
| Rhode Island: | 12.9% (25,502) |
Number of families with income $100k - 125k:| East Greenwich: | 10.0% (744) |
| State: | 13.2% (25,978) |
Number of families with income $125k - 150k:| East Greenwich: | 10.4% (776) |
| Rhode Island: | 11.5% (22,743) |
Number of families with income $150k - 200k:| East Greenwich: | 21.3% (1,585) |
| Rhode Island: | 14.6% (28,758) |
Number of families with income > $200k:| East Greenwich: | 45.1% (3,347) |
| State: | 19.3% (38,074) |
Median non-family income in East Greenwich in 2022:| East Greenwich: | $47,921 |
| Rhode Island: | $51,671 |
Change in median non-family income between 2000 and 2022:| East Greenwich, Rhode Island: | +64.5% |
| State: | +111.1% |
Median per capita income in East Greenwich in 2022:| East Greenwich: | $75,400 |
| State: | $50,823 |
Change in median per capita income between 2000 and 2022:| East Greenwich, Rhode Island: | +96.2% |
| State: | +116.7% |
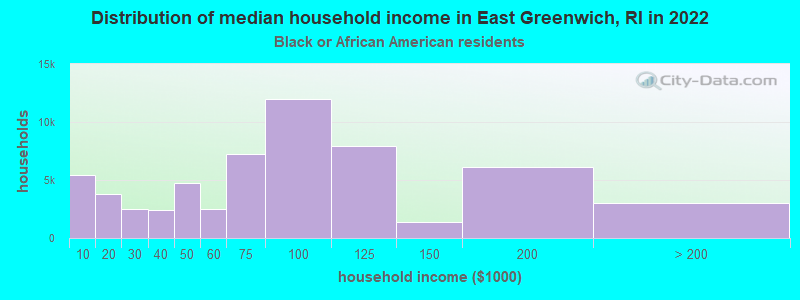
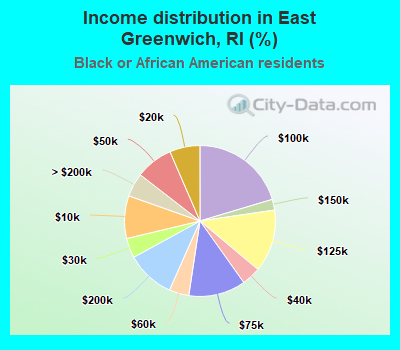
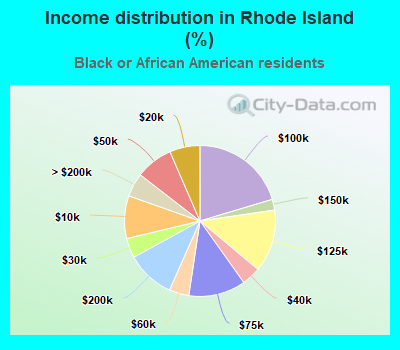
Income statistics for Black or African American residents
Median household income in East Greenwich, RI in 2022:| East Greenwich: | $163,902 |
| State: | $80,953 |
Change in median household income between 2000 and 2022:| East Greenwich, Rhode Island: | +120.1% |
| State: | +224.2% |
Number of households with income < $10k:| East Greenwich: | 9.2% (5,388) |
| State: | 9.2% (1,807) |
Number of households with income $10k - 20k:| East Greenwich: | 6.5% (3,826) |
| Rhode Island: | 6.5% (1,283) |
Number of households with income $20k - 30k:| East Greenwich: | 4.2% (2,486) |
| Rhode Island: | 4.2% (834) |
Number of households with income $30k - 40k:| East Greenwich: | 4.1% (2,391) |
| State: | 4.1% (802) |
Number of households with income $40k - 50k:| East Greenwich: | 8.0% (4,714) |
| State: | 8.0% (1,581) |
Number of households with income $50k - 60k:| East Greenwich: | 4.2% (2,484) |
| Rhode Island: | 4.2% (833) |
Number of households with income $60k - 75k:| East Greenwich: | 12.2% (7,204) |
| State: | 12.2% (2,416) |
Number of households with income $75k - 100k:| East Greenwich: | 20.4% (11,996) |
| State: | 20.4% (4,023) |
Number of households with income $100k - 125k:| East Greenwich: | 13.4% (7,896) |
| State: | 13.4% (2,648) |
Number of households with income $125k - 150k:| East Greenwich: | 2.3% (1,360) |
| State: | 2.3% (456) |
Number of households with income $150k - 200k:| East Greenwich: | 10.4% (6,134) |
| State: | 10.4% (2,057) |
Number of households with income > $200k:| East Greenwich: | 5.1% (2,991) |
| Rhode Island: | 5.1% (1,003) |
Aggregate household income in East Greenwich in 2022: $30,832,344
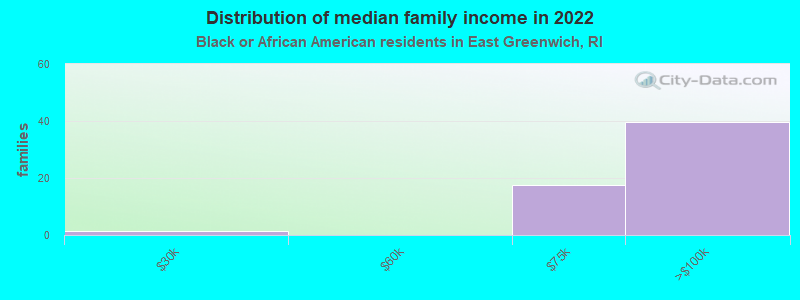
Median family income in East Greenwich in 2022:| East Greenwich: | $161,542 |
| Rhode Island: | $89,073 |
Number of families with income $20k - 30k:| East Greenwich: | 2.3% (1) |
| State: | 2.2% (300) |
Number of families with income $60k - 75k:| East Greenwich: | 30.2% (18) |
| State: | 10.5% (1,454) |
Number of families with income $75k - 100k:| East Greenwich: | 67.5% (40) |
| State: | 23.6% (3,273) |
Median per capita income in East Greenwich in 2022:| East Greenwich: | $107,608 |
| State: | $29,819 |
Change in median per capita income between 2000 and 2022:| East Greenwich, Rhode Island: | +23.8% |
| State: | +135.9% |
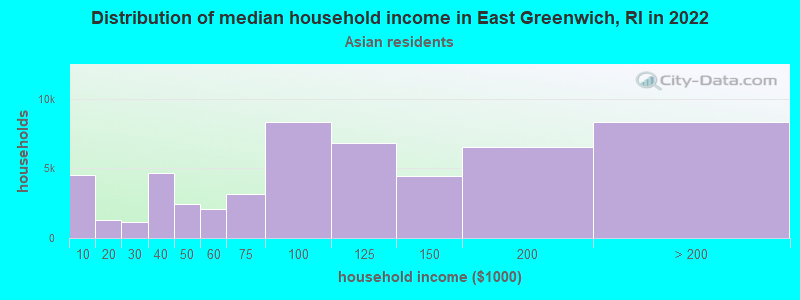
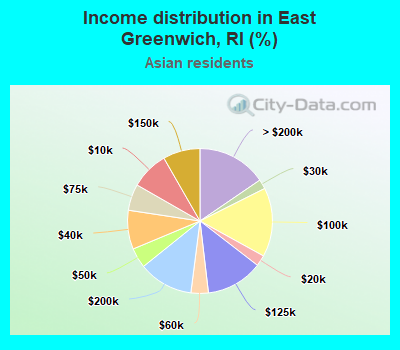
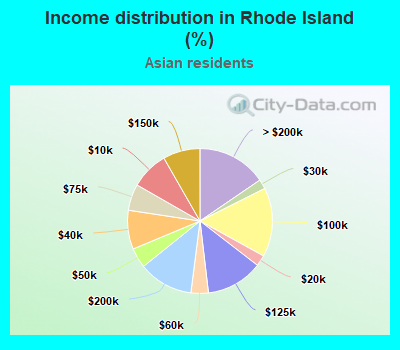
Income statistics for Asian residents
Median household income in East Greenwich, RI in 2022:| East Greenwich: | $272,710 |
| State: | $97,307 |
Change in median household income between 2000 and 2022:| East Greenwich, Rhode Island: | +78.2% |
| Rhode Island: | +166.8% |
Number of households with income < $10k:| East Greenwich: | 8.4% (4,549) |
| State: | 8.4% (1,084) |
Number of households with income $10k - 20k:| East Greenwich: | 2.5% (1,321) |
| Rhode Island: | 2.5% (315) |
Number of households with income $20k - 30k:| East Greenwich: | 2.1% (1,150) |
| State: | 2.1% (274) |
Number of households with income $30k - 40k:| East Greenwich: | 8.7% (4,683) |
| State: | 8.7% (1,116) |
Number of households with income $40k - 50k:| East Greenwich: | 4.5% (2,408) |
| Rhode Island: | 4.5% (574) |
Number of households with income $50k - 60k:| East Greenwich: | 3.9% (2,094) |
| Rhode Island: | 3.9% (499) |
Number of households with income $60k - 75k:| East Greenwich: | 5.9% (3,168) |
| Rhode Island: | 5.9% (755) |
Number of households with income $75k - 100k:| East Greenwich: | 15.4% (8,304) |
| State: | 15.4% (1,979) |
Number of households with income $100k - 125k:| East Greenwich: | 12.7% (6,819) |
| Rhode Island: | 12.7% (1,625) |
Number of households with income $125k - 150k:| East Greenwich: | 8.3% (4,456) |
| State: | 8.3% (1,062) |
Number of households with income $150k - 200k:| East Greenwich: | 12.2% (6,567) |
| Rhode Island: | 12.2% (1,565) |
Number of households with income > $200k:| East Greenwich: | 15.5% (8,330) |
| State: | 15.5% (1,985) |
Aggregate household income in East Greenwich in 2022: $56,288,066
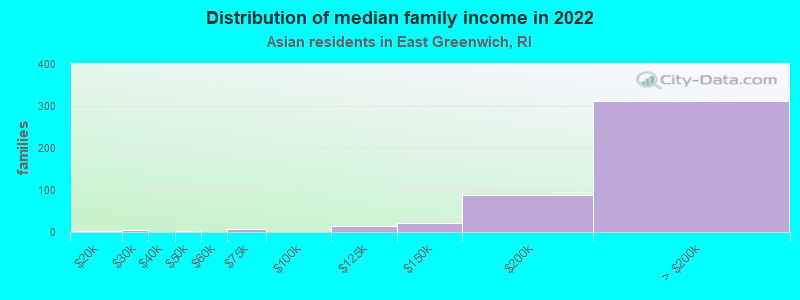
Median family income in East Greenwich in 2022:| East Greenwich: | $280,067 |
| Rhode Island: | $114,184 |
Number of families with income $10k - 20k:| East Greenwich: | 0.8% (3) |
| State: | 2.2% (173) |
Number of families with income $20k - 30k:| East Greenwich: | 0.9% (4) |
| State: | 3.6% (286) |
Number of families with income $40k - 50k:| East Greenwich: | 0.6% (3) |
| State: | 4.0% (319) |
Number of families with income $60k - 75k:| East Greenwich: | 1.5% (7) |
| State: | 8.2% (649) |
Number of families with income $100k - 125k:| East Greenwich: | 3.1% (14) |
| State: | 13.9% (1,102) |
Number of families with income $125k - 150k:| East Greenwich: | 4.6% (21) |
| Rhode Island: | 9.3% (739) |
Number of families with income $150k - 200k:| East Greenwich: | 19.4% (87) |
| Rhode Island: | 15.6% (1,237) |
Number of families with income > $200k:| East Greenwich: | 69.0% (311) |
| State: | 20.5% (1,631) |
Median per capita income in East Greenwich in 2022:| East Greenwich: | $64,822 |
| State: | $43,866 |
Change in median per capita income between 2000 and 2022:| East Greenwich, Rhode Island: | +118.3% |
| State: | +192.2% |
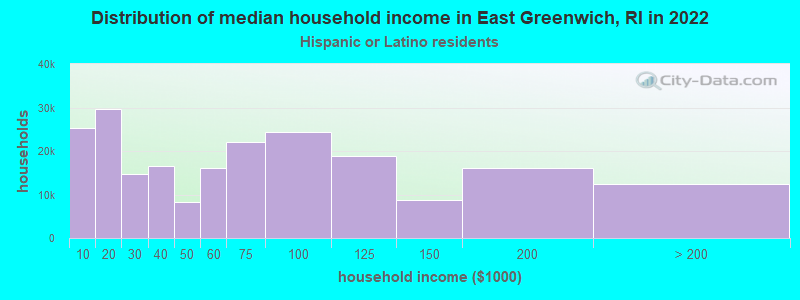
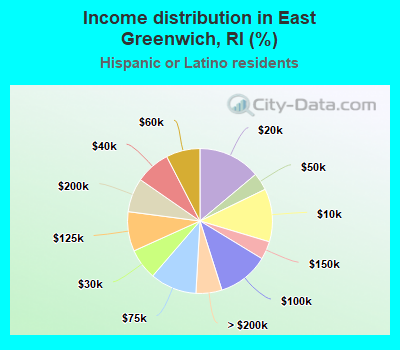
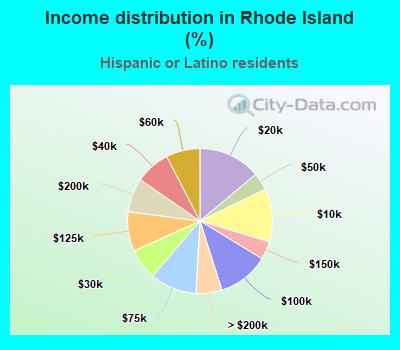
Income statistics for Hispanic or Latino residents
Median household income in East Greenwich, RI in 2022:| East Greenwich: | $177,250 |
| State: | $56,119 |
Change in median household income between 2000 and 2022:| East Greenwich, Rhode Island: | +112.8% |
| State: | +145.6% |
Number of households with income < $10k:| East Greenwich: | 11.9% (25,247) |
| Rhode Island: | 11.9% (6,928) |
Number of households with income $10k - 20k:| East Greenwich: | 13.9% (29,614) |
| Rhode Island: | 13.9% (8,126) |
Number of households with income $20k - 30k:| East Greenwich: | 6.9% (14,730) |
| State: | 6.9% (4,042) |
Number of households with income $30k - 40k:| East Greenwich: | 7.8% (16,567) |
| Rhode Island: | 7.8% (4,546) |
Number of households with income $40k - 50k:| East Greenwich: | 3.9% (8,305) |
| State: | 3.9% (2,279) |
Number of households with income $50k - 60k:| East Greenwich: | 7.6% (16,137) |
| State: | 7.6% (4,428) |
Number of households with income $60k - 75k:| East Greenwich: | 10.4% (22,172) |
| Rhode Island: | 10.4% (6,084) |
Number of households with income $75k - 100k:| East Greenwich: | 11.4% (24,315) |
| Rhode Island: | 11.4% (6,672) |
Number of households with income $100k - 125k:| East Greenwich: | 8.8% (18,826) |
| Rhode Island: | 8.8% (5,166) |
Number of households with income $125k - 150k:| East Greenwich: | 4.1% (8,641) |
| Rhode Island: | 4.1% (2,371) |
Number of households with income $150k - 200k:| East Greenwich: | 7.6% (16,133) |
| State: | 7.6% (4,427) |
Number of households with income > $200k:| East Greenwich: | 5.8% (12,350) |
| State: | 5.8% (3,389) |
Aggregate household income in East Greenwich in 2022: $16,056,295
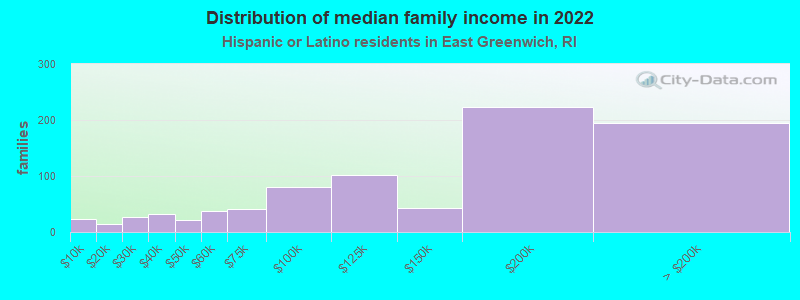
Median family income in East Greenwich in 2022:| East Greenwich: | $162,005 |
| Rhode Island: | $64,267 |
Number of families with income < $10k:| East Greenwich: | 2.8% (24) |
| State: | 9.7% (3,983) |
Number of families with income $10k - 20k:| East Greenwich: | 1.7% (14) |
| State: | 5.6% (2,310) |
Number of families with income $20k - 30k:| East Greenwich: | 3.2% (27) |
| State: | 7.0% (2,878) |
Number of families with income $30k - 40k:| East Greenwich: | 4.0% (33) |
| State: | 9.9% (4,068) |
Number of families with income $40k - 50k:| East Greenwich: | 2.7% (22) |
| Rhode Island: | 6.3% (2,564) |
Number of families with income $50k - 60k:| East Greenwich: | 4.5% (38) |
| Rhode Island: | 8.2% (3,370) |
Number of families with income $60k - 75k:| East Greenwich: | 4.8% (41) |
| State: | 10.5% (4,297) |
Number of families with income $75k - 100k:| East Greenwich: | 9.5% (80) |
| Rhode Island: | 13.2% (5,397) |
Number of families with income $100k - 125k:| East Greenwich: | 12.1% (101) |
| Rhode Island: | 10.1% (4,157) |
Number of families with income $125k - 150k:| East Greenwich: | 5.0% (42) |
| Rhode Island: | 4.2% (1,733) |
Number of families with income $150k - 200k:| East Greenwich: | 26.5% (223) |
| State: | 9.8% (4,031) |
Number of families with income > $200k:| East Greenwich: | 23.1% (194) |
| Rhode Island: | 5.4% (2,228) |
Median per capita income in East Greenwich in 2022:| East Greenwich: | $39,680 |
| State: | $25,485 |
Change in median per capita income between 2000 and 2022:| East Greenwich, Rhode Island: | +97.7% |
| Rhode Island: | +168.3% |
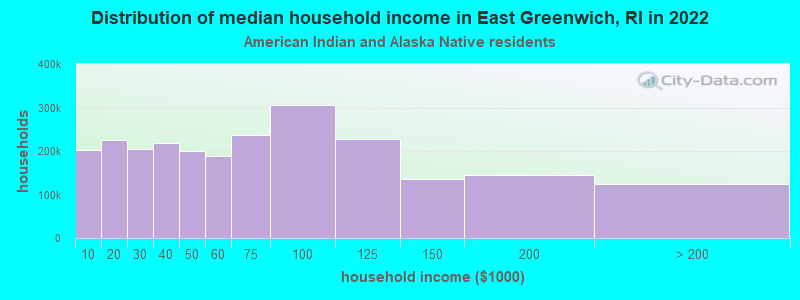
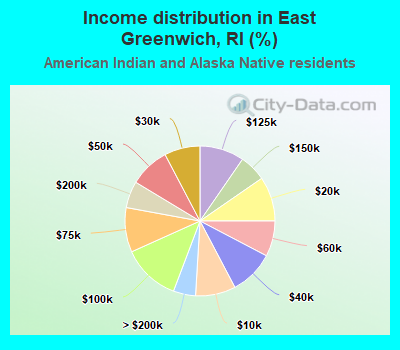
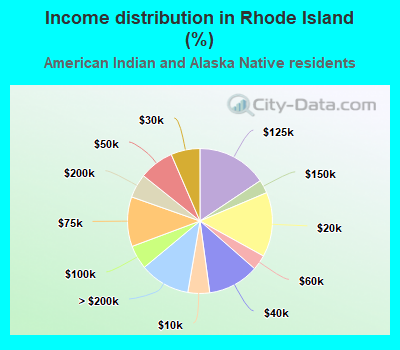
Income statistics for American Indian and Alaska Native residents
Number of households with income < $10k:| East Greenwich: | 8.7% (9) |
| State: | 4.9% (60) |
Number of households with income $10k - 20k:| East Greenwich: | 9.6% (10) |
| State: | 14.4% (178) |
Number of households with income $20k - 30k:| East Greenwich: | 7.7% (8) |
| Rhode Island: | 6.5% (80) |
Number of households with income $30k - 40k:| East Greenwich: | 9.6% (10) |
| State: | 11.4% (141) |
Number of households with income $40k - 50k:| East Greenwich: | 8.7% (9) |
| State: | 7.8% (96) |
Number of households with income $50k - 60k:| East Greenwich: | 7.7% (8) |
| State: | 3.4% (42) |
Number of households with income $60k - 75k:| East Greenwich: | 9.6% (10) |
| State: | 11.1% (137) |
Number of households with income $75k - 100k:| East Greenwich: | 12.5% (13) |
| State: | 5.3% (66) |
Number of households with income $100k - 125k:| East Greenwich: | 9.6% (10) |
| Rhode Island: | 15.6% (193) |
Number of households with income $125k - 150k:| East Greenwich: | 5.8% (6) |
| State: | 3.0% (37) |
Number of households with income $150k - 200k:| East Greenwich: | 5.8% (6) |
| State: | 5.3% (66) |
Number of households with income > $200k:| East Greenwich: | 4.8% (5) |
| State: | 11.3% (139) |
Aggregate household income in East Greenwich in 2022: $666,181
Median per capita income in East Greenwich in 2022:| East Greenwich: | $177,444 |
| Rhode Island: | $31,547 |
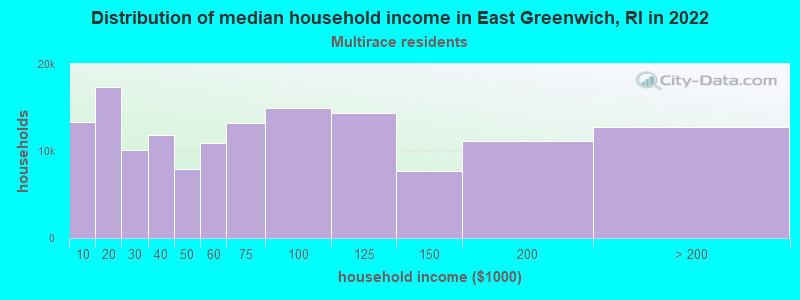
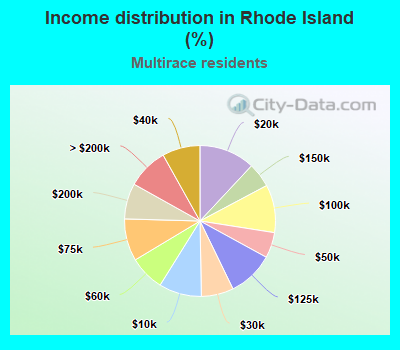
Income statistics for Multirace residents
Median household income in East Greenwich, RI in 2022:| East Greenwich: | $137,500 |
| State: | $62,970 |
Change in median household income between 2000 and 2022:| East Greenwich, Rhode Island: | +36.4% |
| State: | +131.0% |
Number of households with income < $10k:| East Greenwich: | 9.1% (13,306) |
| Rhode Island: | 9.1% (3,599) |
Number of households with income $10k - 20k:| East Greenwich: | 12.0% (17,403) |
| State: | 12.0% (4,707) |
Number of households with income $20k - 30k:| East Greenwich: | 6.9% (10,068) |
| State: | 6.9% (2,723) |
Number of households with income $30k - 40k:| East Greenwich: | 8.1% (11,787) |
| Rhode Island: | 8.1% (3,188) |
Number of households with income $40k - 50k:| East Greenwich: | 5.5% (7,979) |
| Rhode Island: | 5.5% (2,158) |
Number of households with income $50k - 60k:| East Greenwich: | 7.5% (10,958) |
| State: | 7.5% (2,964) |
Number of households with income $60k - 75k:| East Greenwich: | 9.1% (13,177) |
| State: | 9.1% (3,564) |
Number of households with income $75k - 100k:| East Greenwich: | 10.2% (14,910) |
| State: | 10.2% (4,033) |
Number of households with income $100k - 125k:| East Greenwich: | 9.8% (14,315) |
| State: | 9.8% (3,872) |
Number of households with income $125k - 150k:| East Greenwich: | 5.3% (7,679) |
| State: | 5.3% (2,077) |
Number of households with income $150k - 200k:| East Greenwich: | 7.6% (11,128) |
| Rhode Island: | 7.6% (3,010) |
Number of households with income > $200k:| East Greenwich: | 8.8% (12,803) |
| State: | 8.8% (3,463) |
Aggregate household income in East Greenwich in 2022: $5,443,469
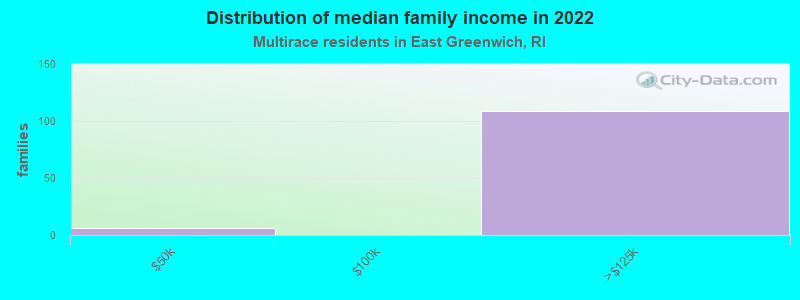
Median family income in East Greenwich in 2022:| East Greenwich: | $159,166 |
| State: | $78,140 |
Number of families with income $40k - 50k:| East Greenwich: | 5.2% (6) |
| State: | 5.4% (1,426) |
Number of families with income $100k - 125k:| East Greenwich: | 94.8% (109) |
| State: | 13.1% (3,468) |
Median per capita income in East Greenwich in 2022:| East Greenwich: | $59,642 |
| Rhode Island: | $28,809 |
Change in median per capita income between 2000 and 2022:| East Greenwich, Rhode Island: | +85.6% |
| State: | +141.3% |
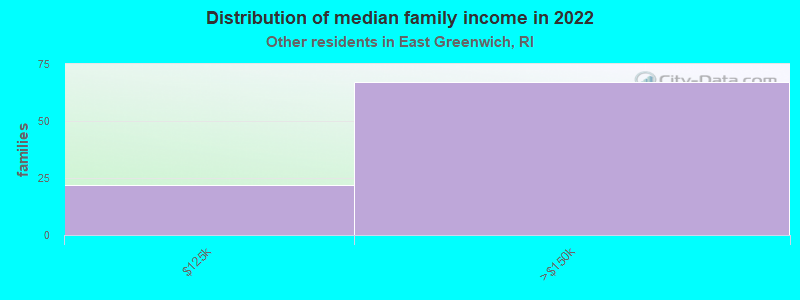
Income statistics for other residents
Number of households with income < $10k:| East Greenwich: | 13.0% (12) |
| Rhode Island: | 13.0% (3,652) |
Number of households with income $10k - 20k:| East Greenwich: | 19.6% (18) |
| State: | 19.2% (5,381) |
Number of households with income $20k - 30k:| East Greenwich: | 6.5% (6) |
| Rhode Island: | 6.9% (1,947) |
Number of households with income $30k - 40k:| East Greenwich: | 7.6% (7) |
| State: | 6.9% (1,944) |
Number of households with income $40k - 50k:| East Greenwich: | 2.2% (2) |
| State: | 2.6% (724) |
Number of households with income $50k - 60k:| East Greenwich: | 5.4% (5) |
| State: | 5.7% (1,612) |
Number of households with income $60k - 75k:| East Greenwich: | 9.8% (9) |
| Rhode Island: | 9.9% (2,785) |
Number of households with income $75k - 100k:| East Greenwich: | 12.0% (11) |
| State: | 11.7% (3,283) |
Number of households with income $100k - 125k:| East Greenwich: | 6.5% (6) |
| State: | 6.5% (1,829) |
Number of households with income $125k - 150k:| East Greenwich: | 5.4% (5) |
| Rhode Island: | 5.7% (1,607) |
Number of households with income $150k - 200k:| East Greenwich: | 8.7% (8) |
| State: | 8.3% (2,333) |
Number of households with income > $200k:| East Greenwich: | 3.3% (3) |
| Rhode Island: | 3.4% (967) |
Aggregate household income in East Greenwich in 2022: $13,448,980
Median family income in East Greenwich in 2022:| East Greenwich: | $241,119 |
| State: | $63,909 |
Number of families with income $100k - 125k:| East Greenwich: | 24.6% (22) |
| State: | 4.5% (871) |
Number of families with income $125k - 150k:| East Greenwich: | 75.4% (67) |
| State: | 5.6% (1,077) |
Median per capita income in East Greenwich in 2022:| East Greenwich: | $86,952 |
| State: | $23,882 |