The median household income in East Hampton, CT in 2022 was $120,004, which was 26.3% greater than the median annual income of $88,429 across the entire state of Connecticut. Compared to the median income of $53,464 in 2000 this represents an increase of 55.4%. The per capita income in 2022 was $42,137, which means an increase of 40.2% compared to 2000 when it was $25,207.
Whole page based on the data from 2000 / 2022 when the population of East Hampton, Connecticut was 2,254 / 2,956
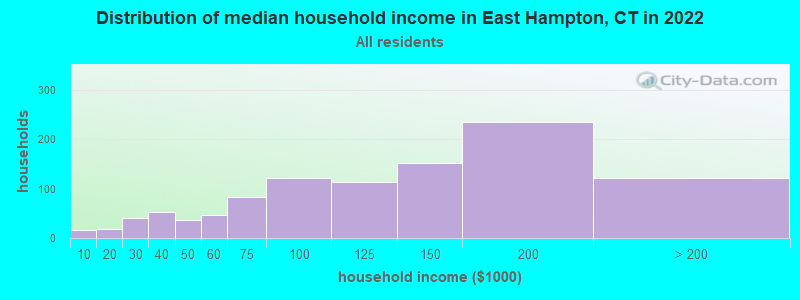
Income statistics for all residents
Median household income in East Hampton, CT in 2022:
East Hampton:
$120,005
State:
$88,429
Change in median household income between 2000 and 2022:
East Hampton, Connecticut:
+124.5%
State:
+64.0%
Number of households with income < $10k:
East Hampton:
1.5% (16)
State:
5.1% (72,746)
Number of households with income $10k - 20k:
East Hampton:
1.7% (18)
State:
5.7% (81,643)
Number of households with income $20k - 30k:
East Hampton:
4.0% (41)
Connecticut:
6.5% (92,844)
Number of households with income $30k - 40k:
East Hampton:
5.0% (52)
State:
5.9% (83,934)
Number of households with income $40k - 50k:
East Hampton:
3.5% (36)
State:
5.8% (83,025)
Number of households with income $50k - 60k:
East Hampton:
4.4% (46)
State:
5.7% (81,788)
Number of households with income $60k - 75k:
East Hampton:
8.1% (84)
State:
8.1% (115,651)
Number of households with income $75k - 100k:
East Hampton:
11.7% (121)
State:
12.6% (180,173)
Number of households with income $100k - 125k:
East Hampton:
10.9% (113)
Connecticut:
9.9% (141,231)
Number of households with income $125k - 150k:
East Hampton:
14.7% (152)
State:
7.9% (112,826)
Number of households with income $150k - 200k:
East Hampton:
22.7% (235)
Connecticut:
10.8% (154,641)
Number of households with income > $200k:
East Hampton:
11.8% (122)
Connecticut:
16.3% (233,133)
Aggregate household income in East Hampton in 2022: $123,868,719
Median family income in East Hampton in 2022:
East Hampton:
$128,061
State:
$115,183
Number of families with income < $10k:
East Hampton:
1.7% (14)
Connecticut:
2.6% (23,251)
Number of families with income $30k - 40k:
East Hampton:
2.4% (20)
State:
4.2% (38,052)
Number of families with income $40k - 50k:
East Hampton:
2.9% (25)
State:
4.8% (43,104)
Number of families with income $50k - 60k:
East Hampton:
4.4% (36)
State:
4.8% (43,284)
Number of families with income $60k - 75k:
East Hampton:
7.3% (61)
State:
7.4% (66,521)
Number of families with income $75k - 100k:
East Hampton:
13.2% (110)
State:
12.9% (116,232)
Number of families with income $100k - 125k:
East Hampton:
10.3% (86)
State:
10.6% (95,504)
Number of families with income $125k - 150k:
East Hampton:
18.0% (150)
State:
9.5% (86,149)
Number of families with income $150k - 200k:
East Hampton:
25.4% (212)
State:
14.0% (125,908)
Number of families with income > $200k:
East Hampton:
14.6% (122)
State:
22.4% (202,515)
Median non-family income in East Hampton in 2022:
East Hampton:
$47,485
State:
$50,964
Change in median non-family income between 2000 and 2022:
East Hampton, Connecticut:
+75.5%
State:
+65.1%
Median per capita income in East Hampton in 2022:
East Hampton:
$42,138
State:
$51,581
Change in median per capita income between 2000 and 2022:
East Hampton, Connecticut:
+67.2%
State:
+79.3%
Income statistics for White residents
Median household income in East Hampton, CT in 2022:
East Hampton:
$122,878
State:
$96,890
Change in median household income between 2000 and 2022:
East Hampton, Connecticut:
+130.4%
State:
+68.5%
Number of households with income < $10k:
East Hampton:
1.6% (15)
State:
4.2% (42,265)
Number of households with income $10k - 20k:
East Hampton:
1.9% (18)
State:
4.8% (48,323)
Number of households with income $20k - 30k:
East Hampton:
4.0% (38)
Connecticut:
5.7% (57,716)
Number of households with income $30k - 40k:
East Hampton:
5.1% (49)
State:
5.3% (53,827)
Number of households with income $40k - 50k:
East Hampton:
2.7% (26)
State:
5.3% (53,301)
Number of households with income $50k - 60k:
East Hampton:
4.7% (45)
State:
5.5% (55,690)
Number of households with income $60k - 75k:
East Hampton:
7.7% (74)
State:
8.0% (80,329)
Number of households with income $75k - 100k:
East Hampton:
11.0% (105)
State:
12.7% (128,070)
Number of households with income $100k - 125k:
East Hampton:
11.0% (105)
State:
10.0% (101,210)
Number of households with income $125k - 150k:
East Hampton:
14.5% (138)
State:
8.0% (81,250)
Number of households with income $150k - 200k:
East Hampton:
23.6% (225)
State:
11.8% (119,527)
Number of households with income > $200k:
East Hampton:
12.3% (117)
State:
18.6% (187,875)
Aggregate household income in East Hampton in 2022: $115,394,769
Median family income in East Hampton in 2022:
East Hampton:
$130,238
Connecticut:
$128,955
Number of families with income < $10k:
East Hampton:
1.8% (14)
State:
1.9% (11,537)
Number of families with income $30k - 40k:
East Hampton:
2.1% (16)
State:
2.9% (18,160)
Number of families with income $40k - 50k:
East Hampton:
3.1% (24)
State:
3.9% (24,550)
Number of families with income $50k - 60k:
East Hampton:
4.4% (34)
Connecticut:
4.3% (26,723)
Number of families with income $60k - 75k:
East Hampton:
6.9% (53)
State:
7.1% (44,075)
Number of families with income $75k - 100k:
East Hampton:
12.1% (93)
State:
12.5% (77,679)
Number of families with income $100k - 125k:
East Hampton:
10.5% (81)
State:
11.1% (69,086)
Number of families with income $125k - 150k:
East Hampton:
17.3% (133)
Connecticut:
9.6% (59,616)
Number of families with income $150k - 200k:
East Hampton:
26.6% (205)
State:
15.7% (97,890)
Number of families with income > $200k:
East Hampton:
15.1% (116)
Connecticut:
26.3% (163,417)
Median per capita income in East Hampton in 2022:
East Hampton:
$43,079
State:
$59,916
Change in median per capita income between 2000 and 2022:
East Hampton, Connecticut:
+74.7%
State:
+90.2%
Income statistics for Hispanic or Latino residents
Median household income in East Hampton, CT in 2022:
East Hampton:
$160,730
State:
$60,275
Number of households with income < $10k:
East Hampton:
0.0% (0)
State:
8.7% (18,584)
Number of households with income $10k - 20k:
East Hampton:
0.0% (0)
Connecticut:
9.1% (19,235)
Number of households with income $20k - 30k:
East Hampton:
0.0% (0)
State:
8.9% (18,989)
Number of households with income $30k - 40k:
East Hampton:
0.0% (0)
State:
7.5% (15,967)
Number of households with income $40k - 50k:
East Hampton:
0.0% (0)
Connecticut:
8.7% (18,466)
Number of households with income $50k - 60k:
East Hampton:
0.0% (0)
Connecticut:
6.9% (14,706)
Number of households with income $60k - 75k:
East Hampton:
0.0% (0)
Connecticut:
8.9% (18,888)
Number of households with income $75k - 100k:
East Hampton:
27.0% (10)
State:
13.5% (28,669)
Number of households with income $100k - 125k:
East Hampton:
0.0% (0)
State:
8.2% (17,434)
Number of households with income $125k - 150k:
East Hampton:
0.0% (0)
Connecticut:
6.5% (13,752)
Number of households with income $150k - 200k:
East Hampton:
73.0% (27)
State:
6.6% (14,114)
Number of households with income > $200k:
East Hampton:
0.0% (0)
Connecticut:
6.4% (13,630)
Aggregate household income in East Hampton in 2022: $4,895,811
Median family income in East Hampton in 2022:
East Hampton:
$164,880
State:
$68,336
Number of families with income $75k - 100k:
East Hampton:
27.7% (10)
Connecticut:
14.3% (20,457)
Number of families with income $150k - 200k:
East Hampton:
72.3% (25)
State:
7.1% (10,096)
Median per capita income in East Hampton in 2022:
East Hampton:
$22,965
State:
$28,507
Change in median per capita income between 2000 and 2022:: -61.7%
East Hampton, Connecticut:
-61.7%
State:
+117.2%
Income statistics for Multirace residents
Number of households with income < $10k:
East Hampton:
0.0% (0)
State:
6.0% (7,457)
Number of households with income $10k - 20k:
East Hampton:
0.0% (0)
State:
8.1% (10,139)
Number of households with income $20k - 30k:
East Hampton:
0.0% (0)
State:
7.0% (8,702)
Number of households with income $30k - 40k:
East Hampton:
0.0% (0)
State:
6.9% (8,546)
Number of households with income $40k - 50k:
East Hampton:
48.1% (13)
Connecticut:
7.0% (8,712)
Number of households with income $50k - 60k:
East Hampton:
0.0% (0)
State:
5.9% (7,331)
Number of households with income $60k - 75k:
East Hampton:
0.0% (0)
State:
8.5% (10,634)
Number of households with income $75k - 100k:
East Hampton:
51.9% (14)
State:
14.1% (17,600)
Number of households with income $100k - 125k:
East Hampton:
0.0% (0)
State:
9.9% (12,383)
Number of households with income $125k - 150k:
East Hampton:
0.0% (0)
State:
7.2% (8,921)
Number of households with income $150k - 200k:
East Hampton:
0.0% (0)
State:
8.8% (10,922)
Number of households with income > $200k:
East Hampton:
0.0% (0)
State:
10.6% (13,247)
Aggregate household income in East Hampton in 2022: $2,716,967
Median per capita income in East Hampton in 2022:
East Hampton:
$32,566
State:
$32,794
Discuss East Hampton, Connecticut (CT) on our hugely popular Connecticut forum.