The median household income in East Peoria, IL in 2022 was $72,063, which was 6.4% less than the median annual income of $76,708 across the entire state of Illinois. Compared to the median income of $41,538 in 2000 this represents an increase of 42.4%. The per capita income in 2022 was $38,573, which means an increase of 47.8% compared to 2000 when it was $20,147.
Whole page based on the data from 2000 / 2022 when the population of East Peoria, Illinois was 22,638 / 22,318
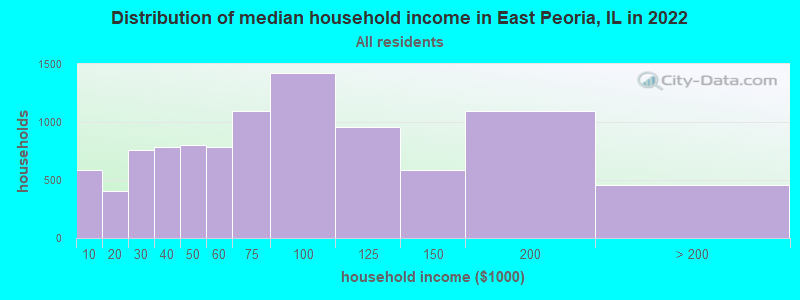
Income statistics for all residents
Median household income in East Peoria, IL in 2022:
East Peoria:
$72,064
State:
$76,708
Change in median household income between 2000 and 2022:
East Peoria, Illinois:
+73.5%
Illinois:
+64.6%
Number of households with income < $10k:
East Peoria:
6.0% (588)
Illinois:
5.9% (296,090)
Number of households with income $10k - 20k:
East Peoria:
4.1% (401)
State:
6.6% (333,259)
Number of households with income $20k - 30k:
East Peoria:
7.8% (759)
Illinois:
6.8% (342,921)
Number of households with income $30k - 40k:
East Peoria:
8.0% (783)
State:
7.0% (355,254)
Number of households with income $40k - 50k:
East Peoria:
8.2% (798)
State:
6.7% (340,678)
Number of households with income $50k - 60k:
East Peoria:
8.1% (787)
State:
6.7% (339,405)
Number of households with income $60k - 75k:
East Peoria:
11.2% (1,093)
State:
9.2% (465,709)
Number of households with income $75k - 100k:
East Peoria:
14.7% (1,426)
State:
12.9% (651,353)
Number of households with income $100k - 125k:
East Peoria:
9.9% (959)
State:
10.3% (522,359)
Number of households with income $125k - 150k:
East Peoria:
6.1% (590)
Illinois:
7.3% (367,136)
Number of households with income $150k - 200k:
East Peoria:
11.2% (1,093)
State:
9.0% (455,249)
Number of households with income > $200k:
East Peoria:
4.7% (456)
Illinois:
11.6% (586,947)
Aggregate household income in East Peoria in 2022: $845,934,798
Median family income in East Peoria in 2022:
East Peoria:
$84,357
Illinois:
$96,948
Number of families with income < $10k:
East Peoria:
2.9% (176)
Illinois:
3.4% (105,875)
Number of families with income $10k - 20k:
East Peoria:
1.1% (66)
Illinois:
3.3% (105,017)
Number of families with income $20k - 30k:
East Peoria:
4.2% (257)
Illinois:
4.7% (146,403)
Number of families with income $30k - 40k:
East Peoria:
6.3% (389)
Illinois:
5.3% (167,069)
Number of families with income $40k - 50k:
East Peoria:
6.4% (391)
State:
5.8% (181,164)
Number of families with income $50k - 60k:
East Peoria:
7.3% (448)
Illinois:
6.1% (191,561)
Number of families with income $60k - 75k:
East Peoria:
13.6% (833)
State:
9.0% (282,985)
Number of families with income $75k - 100k:
East Peoria:
17.6% (1,081)
State:
13.8% (432,725)
Number of families with income $100k - 125k:
East Peoria:
11.9% (732)
State:
11.9% (373,296)
Number of families with income $125k - 150k:
East Peoria:
8.2% (501)
Illinois:
8.9% (279,791)
Number of families with income $150k - 200k:
East Peoria:
15.7% (966)
Illinois:
11.9% (372,004)
Number of families with income > $200k:
East Peoria:
4.8% (293)
State:
15.9% (500,033)
Median non-family income in East Peoria in 2022:
East Peoria:
$40,422
State:
$46,533
Change in median non-family income between 2000 and 2022:
East Peoria, Illinois:
+96.2%
State:
+64.0%
Median per capita income in East Peoria in 2022:
East Peoria:
$38,574
State:
$43,317
Change in median per capita income between 2000 and 2022:
East Peoria, Illinois:
+91.5%
State:
+87.5%
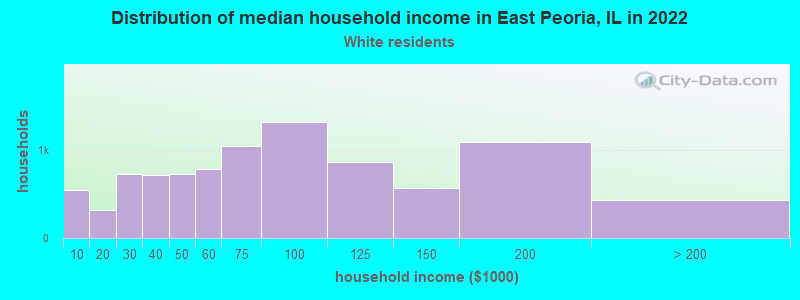
Income statistics for White residents
Median household income in East Peoria, IL in 2022:
East Peoria:
$72,104
State:
$83,346
Change in median household income between 2000 and 2022:
East Peoria, Illinois:
+73.3%
State:
+67.5%
Number of households with income < $10k:
East Peoria:
6.0% (549)
Illinois:
4.5% (149,895)
Number of households with income $10k - 20k:
East Peoria:
3.4% (316)
Illinois:
5.5% (184,529)
Number of households with income $20k - 30k:
East Peoria:
8.0% (729)
State:
6.1% (205,767)
Number of households with income $30k - 40k:
East Peoria:
7.9% (722)
State:
6.7% (225,572)
Number of households with income $40k - 50k:
East Peoria:
8.0% (730)
State:
6.5% (216,965)
Number of households with income $50k - 60k:
East Peoria:
8.5% (782)
State:
6.6% (222,841)
Number of households with income $60k - 75k:
East Peoria:
11.4% (1,045)
Illinois:
9.3% (312,758)
Number of households with income $75k - 100k:
East Peoria:
14.4% (1,323)
Illinois:
12.9% (433,180)
Number of households with income $100k - 125k:
East Peoria:
9.4% (864)
Illinois:
10.7% (360,753)
Number of households with income $125k - 150k:
East Peoria:
6.2% (568)
Illinois:
7.9% (266,532)
Number of households with income $150k - 200k:
East Peoria:
12.0% (1,100)
Illinois:
10.0% (337,357)
Number of households with income > $200k:
East Peoria:
4.7% (435)
State:
13.3% (446,069)
Aggregate household income in East Peoria in 2022: $810,152,047
Median family income in East Peoria in 2022:
East Peoria:
$84,178
State:
$107,938
Number of families with income < $10k:
East Peoria:
2.5% (149)
Illinois:
2.2% (45,983)
Number of families with income $10k - 20k:
East Peoria:
1.2% (68)
State:
2.5% (50,574)
Number of families with income $20k - 30k:
East Peoria:
4.3% (251)
State:
3.5% (70,927)
Number of families with income $30k - 40k:
East Peoria:
6.2% (363)
Illinois:
4.4% (90,563)
Number of families with income $40k - 50k:
East Peoria:
6.7% (395)
Illinois:
5.0% (102,597)
Number of families with income $50k - 60k:
East Peoria:
7.7% (455)
State:
5.8% (119,129)
Number of families with income $60k - 75k:
East Peoria:
13.6% (797)
Illinois:
8.8% (179,665)
Number of families with income $75k - 100k:
East Peoria:
17.0% (997)
Illinois:
13.5% (276,887)
Number of families with income $100k - 125k:
East Peoria:
11.4% (668)
Illinois:
12.5% (256,099)
Number of families with income $125k - 150k:
East Peoria:
8.2% (483)
State:
9.8% (199,855)
Number of families with income $150k - 200k:
East Peoria:
16.6% (972)
Illinois:
13.4% (274,569)
Number of families with income > $200k:
East Peoria:
4.6% (272)
Illinois:
18.6% (381,354)
Median non-family income in East Peoria in 2022:
East Peoria:
$41,664
State:
$50,934
Change in median non-family income between 2000 and 2022:
East Peoria, Illinois:
+105.4%
State:
+70.7%
Median per capita income in East Peoria in 2022:
East Peoria:
$39,670
State:
$50,738
Change in median per capita income between 2000 and 2022:
East Peoria, Illinois:
+95.6%
State:
+95.5%
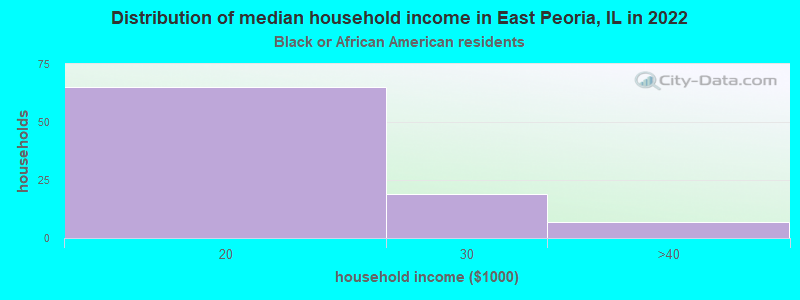
Income statistics for Black or African American residents
Median household income in East Peoria, IL in 2022:
East Peoria:
$16,213
State:
$45,019
Change in median household income between 2000 and 2022:: -72.2%
East Peoria, Illinois:
-72.2%
State:
+42.0%
Number of households with income < $10k:
East Peoria:
0.0% (0)
State:
13.3% (92,224)
Number of households with income $10k - 20k:
East Peoria:
71.4% (65)
State:
13.5% (93,732)
Number of households with income $20k - 30k:
East Peoria:
20.9% (19)
Illinois:
9.9% (68,453)
Number of households with income $30k - 40k:
East Peoria:
7.7% (7)
State:
8.5% (59,072)
Number of households with income $40k - 50k:
East Peoria:
0.0% (0)
Illinois:
7.9% (55,033)
Number of households with income $50k - 60k:
East Peoria:
0.0% (0)
State:
7.2% (49,556)
Number of households with income $60k - 75k:
East Peoria:
0.0% (0)
State:
7.8% (53,726)
Number of households with income $75k - 100k:
East Peoria:
0.0% (0)
State:
11.6% (80,439)
Number of households with income $100k - 125k:
East Peoria:
0.0% (0)
State:
7.5% (52,244)
Number of households with income $125k - 150k:
East Peoria:
0.0% (0)
State:
3.9% (27,058)
Number of households with income $150k - 200k:
East Peoria:
0.0% (0)
Illinois:
4.6% (32,057)
Number of households with income > $200k:
East Peoria:
0.0% (0)
State:
4.1% (28,731)
Aggregate household income in East Peoria in 2022: $1,009,571
Median non-family income in East Peoria in 2022:
East Peoria:
$11,176
State:
$29,966
Change in median non-family income between 2000 and 2022:: -72.9%
East Peoria, Illinois:
-72.9%
State:
+44.4%
Median per capita income in East Peoria in 2022:
East Peoria:
$24,506
Illinois:
$28,045
Change in median per capita income between 2000 and 2022:: -7.4%
East Peoria, Illinois:
-7.4%
Illinois:
+90.2%
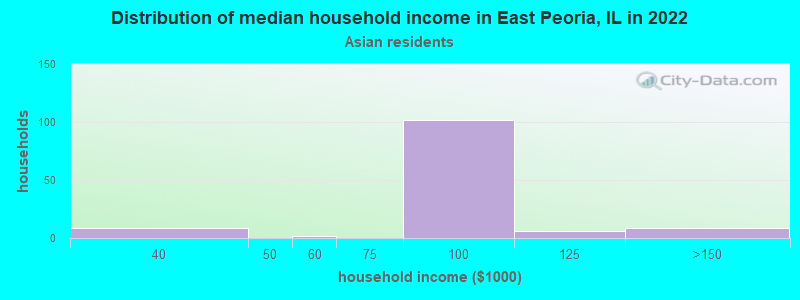
Income statistics for Asian residents
Median household income in East Peoria, IL in 2022:
East Peoria:
$91,503
State:
$104,287
Number of households with income < $10k:
East Peoria:
0.0% (0)
State:
5.3% (14,653)
Number of households with income $10k - 20k:
East Peoria:
0.0% (0)
Illinois:
4.5% (12,283)
Number of households with income $20k - 30k:
East Peoria:
0.0% (0)
Illinois:
4.8% (13,135)
Number of households with income $30k - 40k:
East Peoria:
7.0% (9)
State:
5.0% (13,655)
Number of households with income $40k - 50k:
East Peoria:
0.0% (0)
State:
4.5% (12,357)
Number of households with income $50k - 60k:
East Peoria:
1.6% (2)
State:
4.9% (13,568)
Number of households with income $60k - 75k:
East Peoria:
0.0% (0)
State:
7.1% (19,606)
Number of households with income $75k - 100k:
East Peoria:
79.7% (102)
State:
12.1% (33,349)
Number of households with income $100k - 125k:
East Peoria:
4.7% (6)
Illinois:
9.7% (26,669)
Number of households with income $125k - 150k:
East Peoria:
7.0% (9)
State:
7.3% (20,172)
Number of households with income $150k - 200k:
East Peoria:
0.0% (0)
Illinois:
11.5% (31,711)
Number of households with income > $200k:
East Peoria:
0.0% (0)
State:
23.1% (63,411)
Aggregate household income in East Peoria in 2022: $12,896,593
Median family income in East Peoria in 2022:
East Peoria:
$90,596
Illinois:
$124,630
Number of families with income $30k - 40k:
East Peoria:
8.2% (9)
Illinois:
4.4% (8,628)
Number of families with income $50k - 60k:
East Peoria:
2.0% (2)
Illinois:
4.1% (7,974)
Number of families with income $75k - 100k:
East Peoria:
75.6% (79)
Illinois:
12.3% (24,156)
Number of families with income $100k - 125k:
East Peoria:
5.5% (6)
State:
9.6% (18,808)
Number of families with income $125k - 150k:
East Peoria:
8.8% (9)
State:
8.0% (15,639)
Median per capita income in East Peoria in 2022:
East Peoria:
$32,938
Illinois:
$52,977
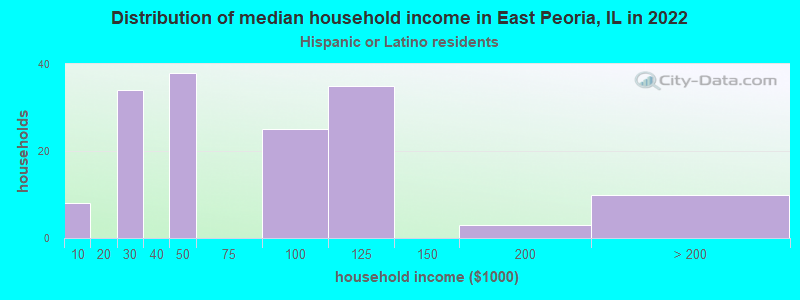
Income statistics for Hispanic or Latino residents
Number of households with income < $10k:
East Peoria:
5.2% (8)
Illinois:
4.9% (33,145)
Number of households with income $10k - 20k:
East Peoria:
0.0% (0)
State:
5.4% (36,345)
Number of households with income $20k - 30k:
East Peoria:
22.2% (34)
Illinois:
7.5% (50,677)
Number of households with income $30k - 40k:
East Peoria:
0.0% (0)
State:
7.7% (52,008)
Number of households with income $40k - 50k:
East Peoria:
24.8% (38)
State:
8.1% (54,702)
Number of households with income $50k - 60k:
East Peoria:
0.0% (0)
State:
7.5% (51,062)
Number of households with income $60k - 75k:
East Peoria:
0.0% (0)
State:
11.3% (76,576)
Number of households with income $75k - 100k:
East Peoria:
16.3% (25)
State:
15.5% (105,152)
Number of households with income $100k - 125k:
East Peoria:
22.9% (35)
State:
11.5% (77,760)
Number of households with income $125k - 150k:
East Peoria:
0.0% (0)
State:
7.3% (49,310)
Number of households with income $150k - 200k:
East Peoria:
2.0% (3)
State:
7.6% (51,233)
Number of households with income > $200k:
East Peoria:
6.5% (10)
State:
5.9% (40,028)
Aggregate household income in East Peoria in 2022: $10,606,598
Median family income in East Peoria in 2022:
East Peoria:
$91,473
State:
$76,467
Number of families with income < $10k:
East Peoria:
9.5% (8)
State:
3.8% (19,330)
Number of families with income $20k - 30k:
East Peoria:
24.4% (21)
State:
6.8% (34,467)
Number of families with income $75k - 100k:
East Peoria:
8.9% (8)
Illinois:
16.0% (81,055)
Number of families with income $100k - 125k:
East Peoria:
41.6% (36)
State:
12.1% (61,491)
Number of families with income $150k - 200k:
East Peoria:
3.7% (3)
Illinois:
8.6% (43,536)
Number of families with income > $200k:
East Peoria:
11.9% (10)
State:
6.6% (33,240)
Median non-family income in East Peoria in 2022:
East Peoria:
$56,490
State:
$45,965
Change in median non-family income between 2000 and 2022:
East Peoria, Illinois:
+84.5%
State:
+75.9%
Median per capita income in East Peoria in 2022:
East Peoria:
$20,070
Illinois:
$26,551
Change in median per capita income between 2000 and 2022:
East Peoria, Illinois:
+47.2%
Illinois:
+111.0%
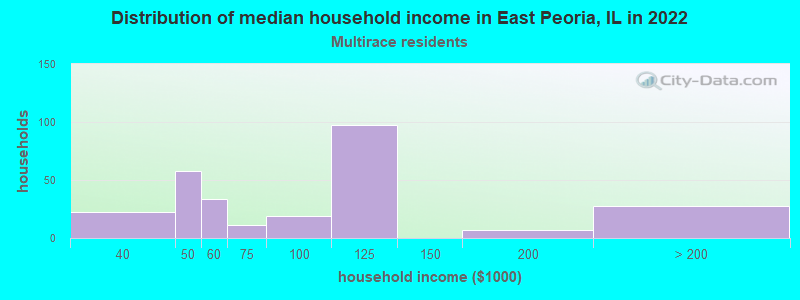
Income statistics for Multirace residents
Median household income in East Peoria, IL in 2022:
East Peoria:
$83,236
State:
$71,185
Change in median household income between 2000 and 2022:
East Peoria, Illinois:
+131.0%
State:
+81.4%
Number of households with income < $10k:
East Peoria:
0.0% (0)
Illinois:
5.3% (21,595)
Number of households with income $10k - 20k:
East Peoria:
0.0% (0)
State:
6.5% (26,720)
Number of households with income $20k - 30k:
East Peoria:
0.0% (0)
State:
8.0% (32,573)
Number of households with income $30k - 40k:
East Peoria:
8.0% (22)
State:
8.4% (34,383)
Number of households with income $40k - 50k:
East Peoria:
21.0% (58)
Illinois:
7.4% (30,234)
Number of households with income $50k - 60k:
East Peoria:
12.3% (34)
Illinois:
6.9% (28,432)
Number of households with income $60k - 75k:
East Peoria:
4.0% (11)
State:
10.2% (41,780)
Number of households with income $75k - 100k:
East Peoria:
6.9% (19)
State:
13.0% (53,426)
Number of households with income $100k - 125k:
East Peoria:
35.1% (97)
State:
10.5% (43,126)
Number of households with income $125k - 150k:
East Peoria:
0.0% (0)
State:
7.6% (31,153)
Number of households with income $150k - 200k:
East Peoria:
2.5% (7)
State:
7.6% (30,946)
Number of households with income > $200k:
East Peoria:
10.1% (28)
State:
8.6% (35,208)
Aggregate household income in East Peoria in 2022: $23,426,652
Median family income in East Peoria in 2022:
East Peoria:
$104,856
Illinois:
$84,400
Number of families with income $60k - 75k:
East Peoria:
6.9% (10)
State:
9.3% (25,936)
Number of families with income $75k - 100k:
East Peoria:
12.4% (19)
State:
13.6% (37,857)
Number of families with income $100k - 125k:
East Peoria:
57.0% (86)
State:
12.2% (33,852)
Number of families with income $150k - 200k:
East Peoria:
5.0% (8)
State:
9.5% (26,306)
Number of families with income > $200k:
East Peoria:
18.7% (28)
Illinois:
10.4% (28,926)
Median non-family income in East Peoria in 2022:
East Peoria:
$30,007
Illinois:
$43,615
Change in median non-family income between 2000 and 2022:
East Peoria, Illinois:
+21.2%
Illinois:
+77.3%
Median per capita income in East Peoria in 2022:
East Peoria:
$19,101
State:
$29,285
Change in median per capita income between 2000 and 2022:
East Peoria, Illinois:
+80.4%
Illinois:
+112.9%
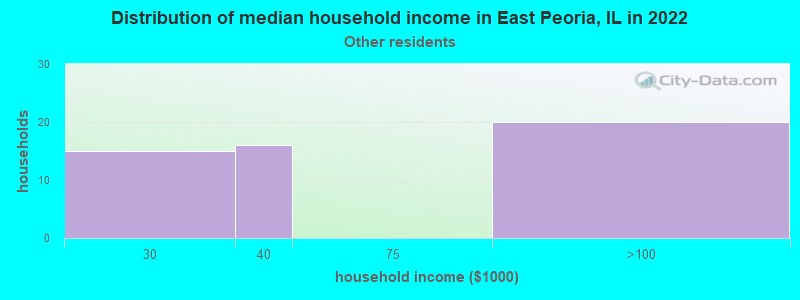
Income statistics for other residents
Number of households with income < $10k:
East Peoria:
0.0% (0)
Illinois:
5.7% (16,383)
Number of households with income $10k - 20k:
East Peoria:
0.0% (0)
State:
4.8% (13,886)
Number of households with income $20k - 30k:
East Peoria:
29.4% (15)
State:
7.0% (20,054)
Number of households with income $30k - 40k:
East Peoria:
31.4% (16)
State:
7.0% (20,038)
Number of households with income $40k - 50k:
East Peoria:
0.0% (0)
State:
8.3% (23,759)
Number of households with income $50k - 60k:
East Peoria:
0.0% (0)
Illinois:
7.8% (22,410)
Number of households with income $60k - 75k:
East Peoria:
0.0% (0)
State:
12.0% (34,448)
Number of households with income $75k - 100k:
East Peoria:
39.2% (20)
Illinois:
16.2% (46,508)
Number of households with income $100k - 125k:
East Peoria:
0.0% (0)
State:
12.5% (35,952)
Number of households with income $125k - 150k:
East Peoria:
0.0% (0)
Illinois:
6.9% (19,732)
Number of households with income $150k - 200k:
East Peoria:
0.0% (0)
Illinois:
7.5% (21,422)
Number of households with income > $200k:
East Peoria:
0.0% (0)
Illinois:
4.3% (12,194)
Aggregate household income in East Peoria in 2022: $2,794,055
Median per capita income in East Peoria in 2022:
East Peoria:
$42,532
State:
$25,392
Change in median per capita income between 2000 and 2022:
East Peoria, Illinois:
+49.4%
State:
+117.4%
Discuss East Peoria, Illinois (IL) on our hugely popular Illinois forum.