East Tom Green, Texas (TX) income map, earnings map, and wages data
The median household income in East Tom Green, TX in 2022 was $76,112, which was 5.0% greater than the median annual income of $72,284 across the entire state of Texas. Compared to the median income of $42,153 in 2000 this represents an increase of 44.6%. The per capita income in 2022 was $36,389, which means an increase of 49.5% compared to 2000 when it was $18,380.
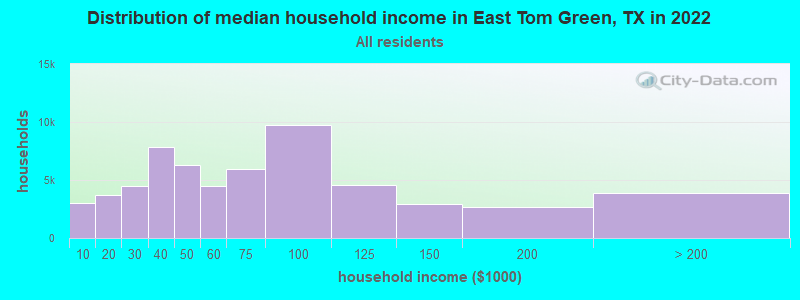
Income statistics for all residents
Median household income in East Tom Green, TX in 2022:| East Tom Green: | $76,113 |
| State: | $72,284 |
Change in median household income between 2000 and 2022:| East Tom Green, Texas: | +80.6% |
| State: | +81.0% |
Number of households with income < $10k:| East Tom Green: | 5.1% (3,048) |
| State: | 5.5% (611,011) |
Number of households with income $10k - 20k:| East Tom Green: | 6.2% (3,684) |
| Texas: | 6.7% (743,157) |
Number of households with income $20k - 30k:| East Tom Green: | 7.5% (4,469) |
| Texas: | 7.2% (803,381) |
Number of households with income $30k - 40k:| East Tom Green: | 13.2% (7,845) |
| State: | 7.8% (866,080) |
Number of households with income $40k - 50k:| East Tom Green: | 10.6% (6,324) |
| State: | 7.3% (810,440) |
Number of households with income $50k - 60k:| East Tom Green: | 7.5% (4,469) |
| State: | 7.2% (799,783) |
Number of households with income $60k - 75k:| East Tom Green: | 9.9% (5,909) |
| State: | 9.9% (1,095,384) |
Number of households with income $75k - 100k:| East Tom Green: | 16.4% (9,757) |
| State: | 12.8% (1,419,057) |
Number of households with income $100k - 125k:| East Tom Green: | 7.7% (4,577) |
| State: | 9.5% (1,054,577) |
Number of households with income $125k - 150k:| East Tom Green: | 5.0% (2,954) |
| State: | 6.7% (741,518) |
Number of households with income $150k - 200k:| East Tom Green: | 4.5% (2,658) |
| Texas: | 8.7% (961,776) |
Number of households with income > $200k:| East Tom Green: | 6.5% (3,875) |
| State: | 10.7% (1,181,544) |
Aggregate household income in East Tom Green in 2022: $189,188,702
Median family income in East Tom Green in 2022:| East Tom Green: | $88,091 |
| State: | $86,267 |
Median non-family income in East Tom Green in 2022:| East Tom Green: | $42,501 |
| Texas: | $45,999 |
Change in median non-family income between 2000 and 2022:| East Tom Green, Texas: | +106.8% |
| State: | +79.5% |
Median per capita income in East Tom Green in 2022:| East Tom Green: | $36,390 |
| Texas: | $38,123 |
Change in median per capita income between 2000 and 2022:| East Tom Green, Texas: | +98.0% |
| Texas: | +94.3% |
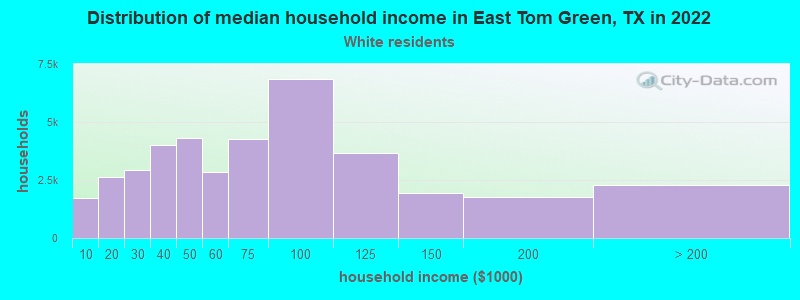
Income statistics for White residents
Median household income in East Tom Green, TX in 2022:| East Tom Green: | $79,735 |
| Texas: | $82,032 |
Change in median household income between 2000 and 2022:| East Tom Green, Texas: | +81.1% |
| Texas: | +91.0% |
Number of households with income < $10k:| East Tom Green: | 4.4% (1,733) |
| State: | 4.7% (273,716) |
Number of households with income $10k - 20k:| East Tom Green: | 6.7% (2,629) |
| State: | 5.5% (322,702) |
Number of households with income $20k - 30k:| East Tom Green: | 7.5% (2,938) |
| State: | 6.2% (363,947) |
Number of households with income $30k - 40k:| East Tom Green: | 10.2% (3,993) |
| State: | 6.8% (399,275) |
Number of households with income $40k - 50k:| East Tom Green: | 11.0% (4,315) |
| Texas: | 6.5% (383,417) |
Number of households with income $50k - 60k:| East Tom Green: | 7.2% (2,840) |
| Texas: | 6.6% (388,535) |
Number of households with income $60k - 75k:| East Tom Green: | 10.9% (4,275) |
| Texas: | 9.7% (566,295) |
Number of households with income $75k - 100k:| East Tom Green: | 17.4% (6,841) |
| State: | 13.0% (760,276) |
Number of households with income $100k - 125k:| East Tom Green: | 9.3% (3,660) |
| State: | 10.2% (597,596) |
Number of households with income $125k - 150k:| East Tom Green: | 5.0% (1,948) |
| State: | 7.4% (436,830) |
Number of households with income $150k - 200k:| East Tom Green: | 4.5% (1,747) |
| State: | 9.9% (583,067) |
Number of households with income > $200k:| East Tom Green: | 5.9% (2,301) |
| Texas: | 13.5% (792,647) |
Aggregate household income in East Tom Green in 2022: $141,905,800
Median family income in East Tom Green in 2022:| East Tom Green: | $92,741 |
| Texas: | $101,788 |
Number of families with income < $10k:| East Tom Green: | 1.2% (15) |
| State: | 2.8% (108,142) |
Number of families with income $10k - 20k:| East Tom Green: | 2.1% (26) |
| State: | 2.9% (113,421) |
Number of families with income $20k - 30k:| East Tom Green: | 4.2% (53) |
| Texas: | 4.1% (157,688) |
Number of families with income $30k - 40k:| East Tom Green: | 6.2% (79) |
| State: | 5.2% (198,847) |
Number of families with income $40k - 50k:| East Tom Green: | 6.6% (84) |
| Texas: | 5.6% (216,490) |
Number of families with income $50k - 60k:| East Tom Green: | 8.1% (103) |
| Texas: | 5.7% (220,689) |
Number of families with income $60k - 75k:| East Tom Green: | 9.2% (116) |
| Texas: | 9.0% (346,106) |
Number of families with income $75k - 100k:| East Tom Green: | 28.1% (356) |
| Texas: | 13.7% (527,363) |
Number of families with income $100k - 125k:| East Tom Green: | 12.4% (157) |
| State: | 11.6% (448,411) |
Number of families with income $125k - 150k:| East Tom Green: | 7.4% (94) |
| State: | 9.2% (355,798) |
Number of families with income $150k - 200k:| East Tom Green: | 5.0% (63) |
| Texas: | 12.5% (480,185) |
Number of families with income > $200k:| East Tom Green: | 9.5% (120) |
| State: | 17.6% (677,490) |
Median non-family income in East Tom Green in 2022:| East Tom Green: | $44,260 |
| State: | $50,587 |
Change in median non-family income between 2000 and 2022:| East Tom Green, Texas: | +114.7% |
| Texas: | +87.7% |
Median per capita income in East Tom Green in 2022:| East Tom Green: | $39,052 |
| State: | $47,740 |
Change in median per capita income between 2000 and 2022:| East Tom Green, Texas: | +97.1% |
| Texas: | +114.3% |
Income statistics for Black or African American residents
Number of households with income < $10k:| East Tom Green: | 8.9% (28,709) |
| State: | 8.9% (126,378) |
Number of households with income $10k - 20k:| East Tom Green: | 9.9% (32,033) |
| State: | 9.9% (140,369) |
Number of households with income $20k - 30k:| East Tom Green: | 8.5% (27,551) |
| State: | 8.5% (120,639) |
Number of households with income $30k - 40k:| East Tom Green: | 9.7% (31,227) |
| State: | 9.7% (137,517) |
Number of households with income $40k - 50k:| East Tom Green: | 7.9% (25,654) |
| Texas: | 8.0% (112,973) |
Number of households with income $50k - 60k:| East Tom Green: | 8.2% (26,588) |
| State: | 8.3% (117,156) |
Number of households with income $60k - 75k:| East Tom Green: | 10.4% (33,534) |
| State: | 10.4% (147,462) |
Number of households with income $75k - 100k:| East Tom Green: | 11.5% (37,020) |
| Texas: | 11.5% (162,718) |
Number of households with income $100k - 125k:| East Tom Green: | 8.1% (26,305) |
| State: | 8.2% (115,829) |
Number of households with income $125k - 150k:| East Tom Green: | 4.9% (15,897) |
| Texas: | 4.9% (69,556) |
Number of households with income $150k - 200k:| East Tom Green: | 6.4% (20,631) |
| Texas: | 6.4% (90,701) |
Number of households with income > $200k:| East Tom Green: | 5.5% (17,729) |
| Texas: | 5.5% (77,988) |
Median per capita income in East Tom Green in 2022:| East Tom Green: | $20,385 |
| State: | $30,490 |
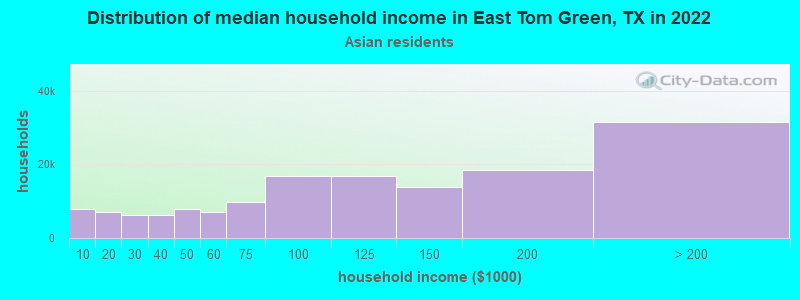
Income statistics for Asian residents
Median household income in East Tom Green, TX in 2022:| East Tom Green: | $60,139 |
| State: | $107,673 |
Change in median household income between 2000 and 2022:| East Tom Green, Texas: | +129.1% |
| Texas: | +115.1% |
Number of households with income < $10k:| East Tom Green: | 5.3% (7,847) |
| State: | 5.2% (29,885) |
Number of households with income $10k - 20k:| East Tom Green: | 4.8% (7,101) |
| State: | 4.7% (27,044) |
Number of households with income $20k - 30k:| East Tom Green: | 4.1% (6,120) |
| Texas: | 4.1% (23,363) |
Number of households with income $30k - 40k:| East Tom Green: | 4.1% (6,118) |
| State: | 4.1% (23,309) |
Number of households with income $40k - 50k:| East Tom Green: | 5.2% (7,821) |
| Texas: | 5.2% (29,826) |
Number of households with income $50k - 60k:| East Tom Green: | 4.6% (6,937) |
| Texas: | 4.7% (26,512) |
Number of households with income $60k - 75k:| East Tom Green: | 6.5% (9,689) |
| Texas: | 6.5% (36,905) |
Number of households with income $75k - 100k:| East Tom Green: | 11.3% (16,849) |
| State: | 11.3% (64,350) |
Number of households with income $100k - 125k:| East Tom Green: | 11.3% (16,956) |
| State: | 11.4% (64,714) |
Number of households with income $125k - 150k:| East Tom Green: | 9.3% (13,823) |
| State: | 9.3% (52,719) |
Number of households with income $150k - 200k:| East Tom Green: | 12.5% (18,608) |
| State: | 12.5% (70,953) |
Number of households with income > $200k:| East Tom Green: | 21.1% (31,537) |
| State: | 21.1% (120,260) |
Aggregate household income in East Tom Green in 2022: $161,939
Median family income in East Tom Green in 2022:| East Tom Green: | $58,680 |
| Texas: | $123,328 |
Median per capita income in East Tom Green in 2022:| East Tom Green: | $15,954 |
| Texas: | $48,626 |
Change in median per capita income between 2000 and 2022:| East Tom Green, Texas: | +50.0% |
| State: | +132.0% |
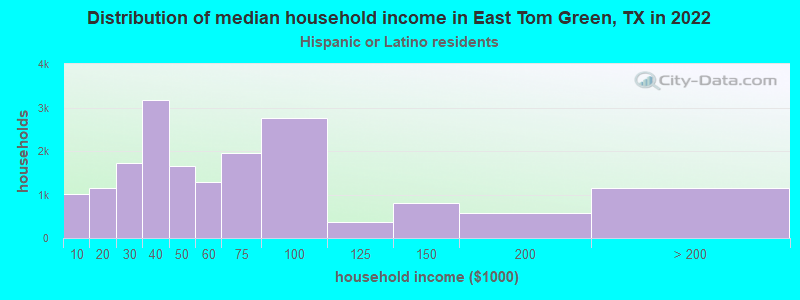
Income statistics for Hispanic or Latino residents
Median household income in East Tom Green, TX in 2022:| East Tom Green: | $50,045 |
| State: | $60,504 |
Change in median household income between 2000 and 2022:| East Tom Green, Texas: | +86.8% |
| Texas: | +102.5% |
Number of households with income < $10k:| East Tom Green: | 5.8% (1,015) |
| Texas: | 5.8% (213,953) |
Number of households with income $10k - 20k:| East Tom Green: | 6.5% (1,152) |
| State: | 8.0% (297,456) |
Number of households with income $20k - 30k:| East Tom Green: | 9.7% (1,713) |
| State: | 9.2% (340,166) |
Number of households with income $30k - 40k:| East Tom Green: | 18.0% (3,162) |
| State: | 9.5% (354,336) |
Number of households with income $40k - 50k:| East Tom Green: | 9.4% (1,661) |
| Texas: | 8.8% (327,013) |
Number of households with income $50k - 60k:| East Tom Green: | 7.3% (1,290) |
| State: | 8.3% (308,818) |
Number of households with income $60k - 75k:| East Tom Green: | 11.1% (1,951) |
| State: | 10.9% (405,109) |
Number of households with income $75k - 100k:| East Tom Green: | 15.6% (2,749) |
| State: | 13.8% (511,639) |
Number of households with income $100k - 125k:| East Tom Green: | 2.1% (375) |
| State: | 8.6% (319,728) |
Number of households with income $125k - 150k:| East Tom Green: | 4.6% (814) |
| Texas: | 5.7% (210,932) |
Number of households with income $150k - 200k:| East Tom Green: | 3.2% (569) |
| State: | 6.4% (236,055) |
Number of households with income > $200k:| East Tom Green: | 6.6% (1,158) |
| State: | 5.1% (189,259) |
Aggregate household income in East Tom Green in 2022: $31,498,972
Median family income in East Tom Green in 2022:| East Tom Green: | $59,014 |
| Texas: | $65,080 |
Number of families with income < $10k:| East Tom Green: | 1.0% (8) |
| State: | 5.3% (147,493) |
Number of families with income $10k - 20k:| East Tom Green: | 4.3% (35) |
| State: | 6.3% (174,531) |
Number of families with income $20k - 30k:| East Tom Green: | 6.3% (51) |
| State: | 8.6% (238,528) |
Number of families with income $30k - 40k:| East Tom Green: | 15.6% (126) |
| State: | 9.1% (251,999) |
Number of families with income $40k - 50k:| East Tom Green: | 6.4% (52) |
| State: | 8.6% (240,188) |
Number of families with income $50k - 60k:| East Tom Green: | 10.3% (83) |
| State: | 8.0% (223,566) |
Number of families with income $60k - 75k:| East Tom Green: | 10.4% (84) |
| State: | 10.9% (302,688) |
Number of families with income $75k - 100k:| East Tom Green: | 20.8% (167) |
| State: | 14.3% (398,554) |
Number of families with income $100k - 125k:| East Tom Green: | 3.4% (27) |
| State: | 9.5% (264,007) |
Number of families with income $125k - 150k:| East Tom Green: | 6.0% (48) |
| State: | 6.2% (171,274) |
Number of families with income $150k - 200k:| East Tom Green: | 3.5% (28) |
| State: | 7.3% (202,259) |
Number of families with income > $200k:| East Tom Green: | 11.9% (96) |
| State: | 5.9% (165,129) |
Median non-family income in East Tom Green in 2022:| East Tom Green: | $41,136 |
| State: | $39,934 |
Change in median non-family income between 2000 and 2022:| East Tom Green, Texas: | +140.8% |
| State: | +109.1% |
Median per capita income in East Tom Green in 2022:| East Tom Green: | $21,325 |
| Texas: | $24,862 |
Change in median per capita income between 2000 and 2022:| East Tom Green, Texas: | +148.8% |
| State: | +130.8% |
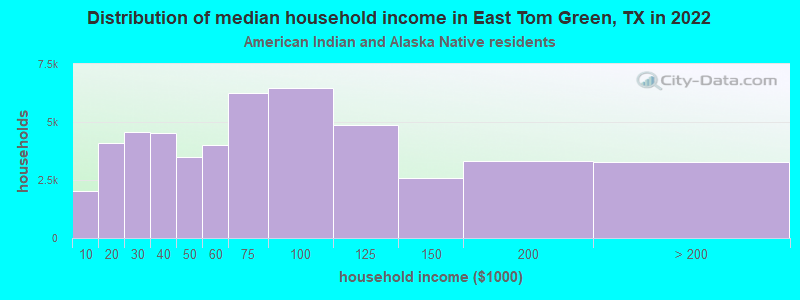
Income statistics for American Indian and Alaska Native residents
Median household income in East Tom Green, TX in 2022:| East Tom Green: | $59,389 |
| State: | $65,765 |
Change in median household income between 2000 and 2022:| East Tom Green, Texas: | +44.0% |
| Texas: | +88.3% |
Number of households with income < $10k:| East Tom Green: | 4.1% (2,010) |
| Texas: | 4.1% (3,398) |
Number of households with income $10k - 20k:| East Tom Green: | 8.3% (4,111) |
| State: | 8.3% (6,949) |
Number of households with income $20k - 30k:| East Tom Green: | 9.3% (4,580) |
| State: | 9.3% (7,742) |
Number of households with income $30k - 40k:| East Tom Green: | 9.1% (4,506) |
| State: | 9.1% (7,627) |
Number of households with income $40k - 50k:| East Tom Green: | 7.1% (3,506) |
| State: | 7.1% (5,922) |
Number of households with income $50k - 60k:| East Tom Green: | 8.1% (4,001) |
| State: | 8.1% (6,761) |
Number of households with income $60k - 75k:| East Tom Green: | 12.7% (6,261) |
| Texas: | 12.7% (10,588) |
Number of households with income $75k - 100k:| East Tom Green: | 13.0% (6,451) |
| State: | 13.0% (10,903) |
Number of households with income $100k - 125k:| East Tom Green: | 9.9% (4,885) |
| Texas: | 9.9% (8,256) |
Number of households with income $125k - 150k:| East Tom Green: | 5.2% (2,574) |
| State: | 5.2% (4,355) |
Number of households with income $150k - 200k:| East Tom Green: | 6.7% (3,323) |
| Texas: | 6.7% (5,623) |
Number of households with income > $200k:| East Tom Green: | 6.6% (3,262) |
| State: | 6.6% (5,522) |
Aggregate household income in East Tom Green in 2022: $288,519
Median per capita income in East Tom Green in 2022:| East Tom Green: | $13,934 |
| State: | $28,166 |
Change in median per capita income between 2000 and 2022:| East Tom Green, Texas: | +78.9% |
| State: | +77.2% |
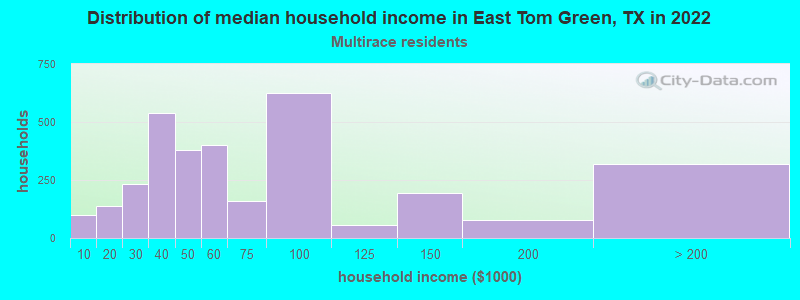
Income statistics for Multirace residents
Median household income in East Tom Green, TX in 2022:| East Tom Green: | $20,836 |
| State: | $62,748 |
Change in median household income between 2000 and 2022:| East Tom Green, Texas: | +88.7% |
| State: | +92.3% |
Number of households with income < $10k:| East Tom Green: | 3.1% (99) |
| State: | 5.5% (122,324) |
Number of households with income $10k - 20k:| East Tom Green: | 4.3% (139) |
| State: | 8.2% (182,232) |
Number of households with income $20k - 30k:| East Tom Green: | 7.3% (234) |
| State: | 8.5% (189,456) |
Number of households with income $30k - 40k:| East Tom Green: | 16.7% (539) |
| State: | 8.9% (197,499) |
Number of households with income $40k - 50k:| East Tom Green: | 11.8% (380) |
| State: | 8.7% (191,735) |
Number of households with income $50k - 60k:| East Tom Green: | 12.5% (401) |
| State: | 8.0% (177,535) |
Number of households with income $60k - 75k:| East Tom Green: | 4.9% (158) |
| State: | 10.5% (232,479) |
Number of households with income $75k - 100k:| East Tom Green: | 19.4% (623) |
| Texas: | 13.1% (290,448) |
Number of households with income $100k - 125k:| East Tom Green: | 1.7% (56) |
| State: | 8.6% (191,595) |
Number of households with income $125k - 150k:| East Tom Green: | 6.1% (195) |
| Texas: | 6.0% (133,361) |
Number of households with income $150k - 200k:| East Tom Green: | 2.4% (77) |
| State: | 7.2% (159,195) |
Number of households with income > $200k:| East Tom Green: | 9.9% (317) |
| Texas: | 6.7% (148,064) |
Aggregate household income in East Tom Green in 2022: $13,771,852
Median family income in East Tom Green in 2022:| East Tom Green: | $20,176 |
| State: | $69,780 |
Number of families with income $75k - 100k:| East Tom Green: | 100.0% (202) |
| State: | 14.0% (226,284) |
Median non-family income in East Tom Green in 2022:| East Tom Green: | $16,527 |
| State: | $40,634 |
Change in median non-family income between 2000 and 2022:| East Tom Green, Texas: | +83.6% |
| Texas: | +77.2% |
Median per capita income in East Tom Green in 2022:| East Tom Green: | $25,261 |
| State: | $26,785 |
Income statistics for other residents
Number of households with income < $10k:| East Tom Green: | 6.0% (38) |
| State: | 5.9% (54,162) |
Number of households with income $10k - 20k:| East Tom Green: | 6.9% (44) |
| State: | 6.8% (62,891) |
Number of households with income $20k - 30k:| East Tom Green: | 10.5% (67) |
| Texas: | 10.6% (97,294) |
Number of households with income $30k - 40k:| East Tom Green: | 10.8% (69) |
| Texas: | 10.8% (99,670) |
Number of households with income $40k - 50k:| East Tom Green: | 9.3% (59) |
| State: | 9.3% (85,548) |
Number of households with income $50k - 60k:| East Tom Green: | 8.9% (57) |
| State: | 9.0% (82,757) |
Number of households with income $60k - 75k:| East Tom Green: | 11.0% (70) |
| State: | 10.9% (100,326) |
Number of households with income $75k - 100k:| East Tom Green: | 14.0% (89) |
| State: | 14.0% (128,767) |
Number of households with income $100k - 125k:| East Tom Green: | 8.2% (52) |
| State: | 8.2% (75,218) |
Number of households with income $125k - 150k:| East Tom Green: | 4.9% (31) |
| State: | 4.8% (44,223) |
Number of households with income $150k - 200k:| East Tom Green: | 5.7% (36) |
| State: | 5.6% (51,376) |
Number of households with income > $200k:| East Tom Green: | 3.9% (25) |
| Texas: | 4.0% (36,393) |
Aggregate household income in East Tom Green in 2022: $6,376,161
Median family income in East Tom Green in 2022:| East Tom Green: | $63,993 |
| State: | $60,064 |
Number of families with income < $10k:| East Tom Green: | 7.6% (6) |
| Texas: | 6.8% (47,502) |
Number of families with income $10k - 20k:| East Tom Green: | 7.1% (6) |
| State: | 6.0% (41,763) |
Number of families with income $20k - 30k:| East Tom Green: | 11.0% (9) |
| State: | 9.9% (68,761) |
Number of families with income $30k - 40k:| East Tom Green: | 12.3% (10) |
| State: | 9.7% (67,685) |
Number of families with income $40k - 50k:| East Tom Green: | 8.7% (7) |
| State: | 9.0% (62,441) |
Number of families with income $50k - 60k:| East Tom Green: | 17.2% (14) |
| Texas: | 8.5% (59,321) |
Number of families with income $60k - 75k:| East Tom Green: | 15.5% (13) |
| State: | 11.2% (77,588) |
Number of families with income $75k - 100k:| East Tom Green: | 20.5% (17) |
| State: | 14.5% (101,032) |
Median non-family income in East Tom Green in 2022:| East Tom Green: | $64,413 |
| Texas: | $38,690 |
Change in median non-family income between 2000 and 2022:| East Tom Green, Texas: | +145.4% |
| State: | +90.2% |
Median per capita income in East Tom Green in 2022:| East Tom Green: | $19,284 |
| Texas: | $23,899 |