East Whatcom, Washington (WA) income map, earnings map, and wages data
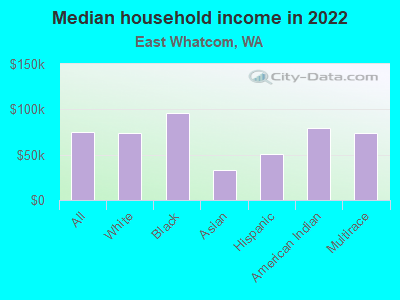
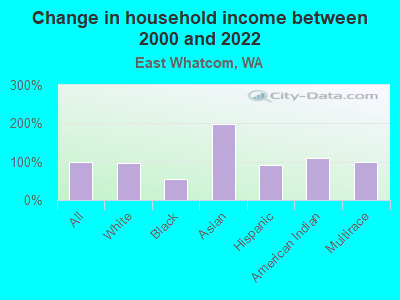
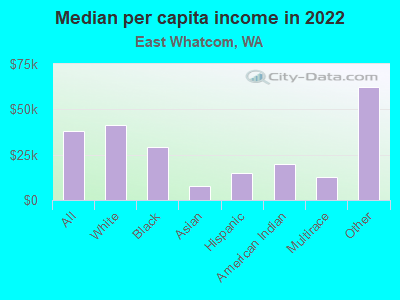
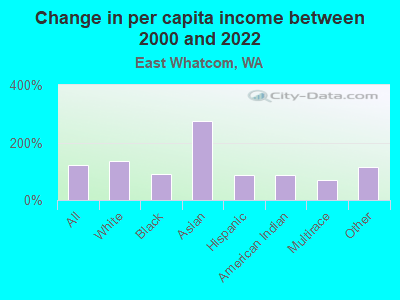
The median household income in East Whatcom, WA in 2022 was $75,126, which was 21.5% less than the median annual income of $91,306 across the entire state of Washington. Compared to the median income of $37,938 in 2000 this represents an increase of 49.5%. The per capita income in 2022 was $38,001, which means an increase of 55.1% compared to 2000 when it was $17,064.
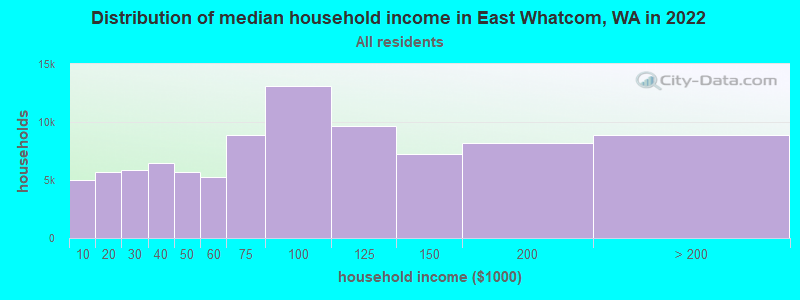
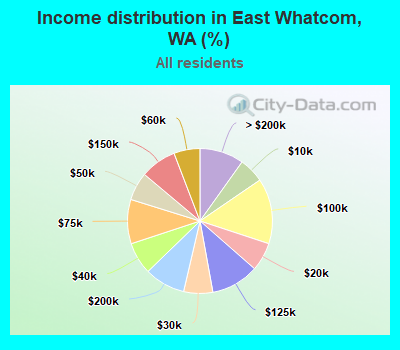
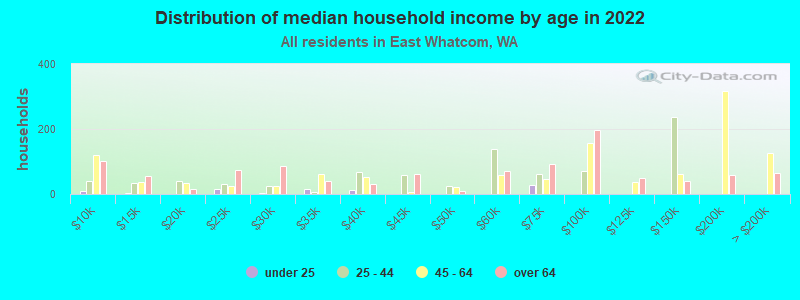
Income statistics for all residents
Median household income in East Whatcom, WA in 2022:| East Whatcom: | $75,127 |
| State: | $91,306 |
Change in median household income between 2000 and 2022:| East Whatcom, Washington: | +98.0% |
| State: | +99.5% |
Number of households with income < $10k:| East Whatcom: | 5.6% (5,037) |
| State: | 4.5% (139,331) |
Number of households with income $10k - 20k:| East Whatcom: | 6.4% (5,727) |
| Washington: | 5.0% (154,508) |
Number of households with income $20k - 30k:| East Whatcom: | 6.5% (5,833) |
| Washington: | 5.4% (166,555) |
Number of households with income $30k - 40k:| East Whatcom: | 7.2% (6,453) |
| State: | 5.5% (170,324) |
Number of households with income $40k - 50k:| East Whatcom: | 6.3% (5,663) |
| State: | 6.0% (183,941) |
Number of households with income $50k - 60k:| East Whatcom: | 5.8% (5,228) |
| Washington: | 6.1% (187,395) |
Number of households with income $60k - 75k:| East Whatcom: | 9.9% (8,889) |
| Washington: | 8.7% (266,771) |
Number of households with income $75k - 100k:| East Whatcom: | 14.6% (13,135) |
| State: | 13.1% (404,672) |
Number of households with income $100k - 125k:| East Whatcom: | 10.7% (9,627) |
| State: | 11.0% (337,911) |
Number of households with income $125k - 150k:| East Whatcom: | 8.1% (7,261) |
| State: | 8.0% (244,934) |
Number of households with income $150k - 200k:| East Whatcom: | 9.1% (8,184) |
| State: | 10.5% (323,812) |
Number of households with income > $200k:| East Whatcom: | 9.9% (8,876) |
| Washington: | 16.2% (499,799) |
Aggregate household income in East Whatcom in 2022: $529,461,640
Median family income in East Whatcom in 2022:| East Whatcom: | $89,639 |
| State: | $109,192 |
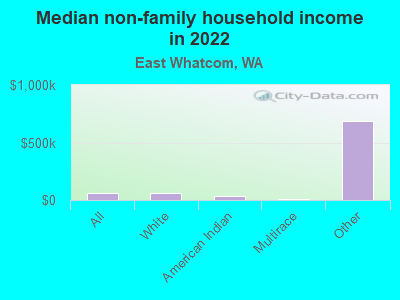
Median non-family income in East Whatcom in 2022:| East Whatcom: | $58,209 |
| State: | $57,299 |
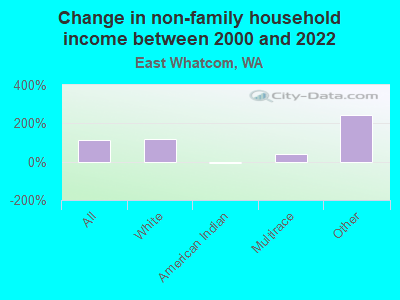
Change in median non-family income between 2000 and 2022:| East Whatcom, Washington: | +113.8% |
| Washington: | +94.9% |
Median per capita income in East Whatcom in 2022:| East Whatcom: | $38,002 |
| State: | $50,764 |
Change in median per capita income between 2000 and 2022:| East Whatcom, Washington: | +122.7% |
| State: | +121.0% |
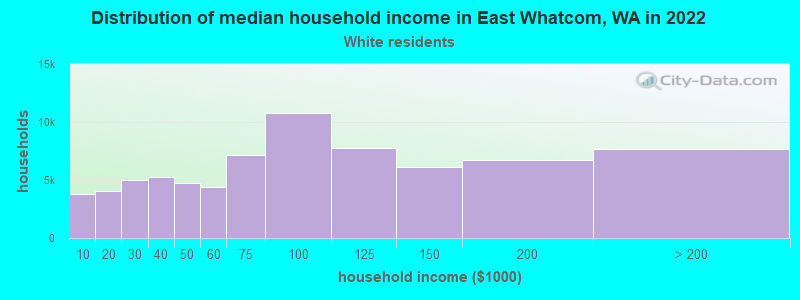
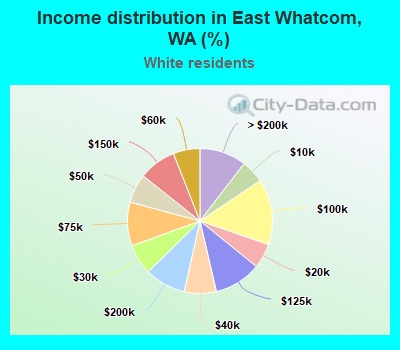
Income statistics for White residents
Median household income in East Whatcom, WA in 2022:| East Whatcom: | $74,083 |
| Washington: | $91,916 |
Change in median household income between 2000 and 2022:| East Whatcom, Washington: | +97.2% |
| State: | +95.4% |
Number of households with income < $10k:| East Whatcom: | 5.2% (3,816) |
| State: | 4.3% (95,850) |
Number of households with income $10k - 20k:| East Whatcom: | 5.5% (4,085) |
| State: | 4.8% (106,421) |
Number of households with income $20k - 30k:| East Whatcom: | 6.8% (5,033) |
| State: | 5.5% (122,860) |
Number of households with income $30k - 40k:| East Whatcom: | 7.2% (5,270) |
| State: | 5.4% (119,627) |
Number of households with income $40k - 50k:| East Whatcom: | 6.5% (4,758) |
| Washington: | 5.9% (132,276) |
Number of households with income $50k - 60k:| East Whatcom: | 6.0% (4,387) |
| State: | 6.1% (136,212) |
Number of households with income $60k - 75k:| East Whatcom: | 9.7% (7,179) |
| State: | 8.8% (196,086) |
Number of households with income $75k - 100k:| East Whatcom: | 14.7% (10,804) |
| State: | 13.4% (299,192) |
Number of households with income $100k - 125k:| East Whatcom: | 10.5% (7,768) |
| State: | 11.3% (252,209) |
Number of households with income $125k - 150k:| East Whatcom: | 8.4% (6,162) |
| Washington: | 7.9% (175,962) |
Number of households with income $150k - 200k:| East Whatcom: | 9.1% (6,713) |
| State: | 10.7% (239,156) |
Number of households with income > $200k:| East Whatcom: | 10.4% (7,687) |
| State: | 16.1% (359,917) |
Aggregate household income in East Whatcom in 2022: $428,527,937
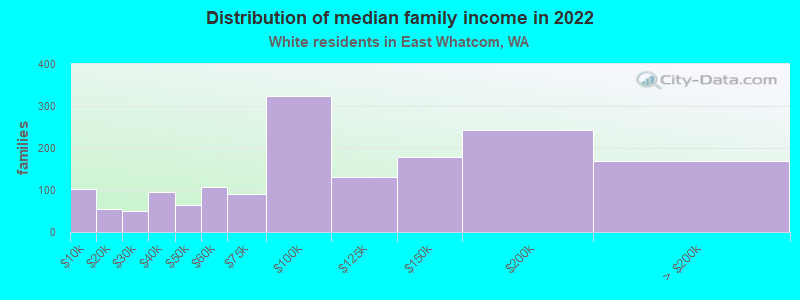
Median family income in East Whatcom in 2022:| East Whatcom: | $89,423 |
| Washington: | $112,511 |
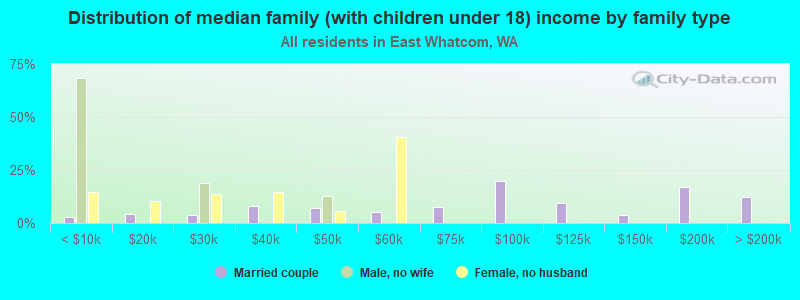
Number of families with income < $10k:| East Whatcom: | 6.3% (102) |
| State: | 2.4% (33,676) |
Number of families with income $10k - 20k:| East Whatcom: | 3.4% (54) |
| Washington: | 2.0% (28,228) |
Number of families with income $20k - 30k:| East Whatcom: | 3.2% (51) |
| State: | 2.9% (39,288) |
Number of families with income $30k - 40k:| East Whatcom: | 5.9% (96) |
| State: | 3.6% (50,190) |
Number of families with income $40k - 50k:| East Whatcom: | 4.0% (64) |
| Washington: | 4.6% (63,009) |
Number of families with income $50k - 60k:| East Whatcom: | 6.7% (107) |
| Washington: | 5.0% (69,270) |
Number of families with income $60k - 75k:| East Whatcom: | 5.6% (91) |
| State: | 8.2% (112,369) |
Number of families with income $75k - 100k:| East Whatcom: | 20.1% (324) |
| State: | 14.1% (194,214) |
Number of families with income $100k - 125k:| East Whatcom: | 8.2% (132) |
| State: | 13.2% (182,184) |
Number of families with income $125k - 150k:| East Whatcom: | 11.1% (179) |
| Washington: | 9.5% (130,928) |
Number of families with income $150k - 200k:| East Whatcom: | 15.0% (242) |
| State: | 13.7% (188,621) |
Number of families with income > $200k:| East Whatcom: | 10.5% (169) |
| State: | 20.8% (285,982) |
Median non-family income in East Whatcom in 2022:| East Whatcom: | $59,691 |
| State: | $56,103 |
Change in median non-family income between 2000 and 2022:| East Whatcom, Washington: | +120.3% |
| Washington: | +87.7% |
Median per capita income in East Whatcom in 2022:| East Whatcom: | $41,469 |
| State: | $55,212 |
Change in median per capita income between 2000 and 2022:| East Whatcom, Washington: | +135.5% |
| State: | +123.8% |
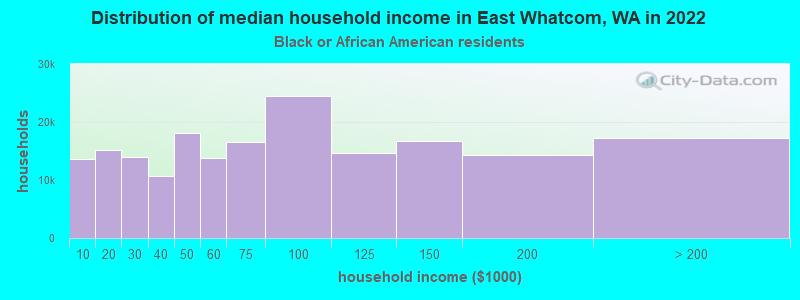
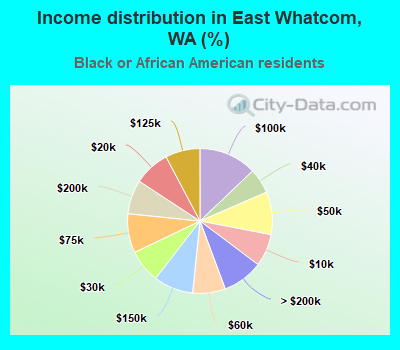
Income statistics for Black or African American residents
Median household income in East Whatcom, WA in 2022:| East Whatcom: | $95,531 |
| Washington: | $68,202 |
Change in median household income between 2000 and 2022:| East Whatcom, Washington: | +56.0% |
| State: | +89.9% |
Number of households with income < $10k:| East Whatcom: | 7.2% (13,666) |
| State: | 7.2% (8,014) |
Number of households with income $10k - 20k:| East Whatcom: | 8.0% (15,183) |
| State: | 8.0% (8,904) |
Number of households with income $20k - 30k:| East Whatcom: | 7.4% (13,995) |
| State: | 7.4% (8,207) |
Number of households with income $30k - 40k:| East Whatcom: | 5.6% (10,606) |
| Washington: | 5.6% (6,220) |
Number of households with income $40k - 50k:| East Whatcom: | 9.5% (18,049) |
| State: | 9.5% (10,585) |
Number of households with income $50k - 60k:| East Whatcom: | 7.3% (13,775) |
| Washington: | 7.3% (8,078) |
Number of households with income $60k - 75k:| East Whatcom: | 8.7% (16,548) |
| State: | 8.7% (9,704) |
Number of households with income $75k - 100k:| East Whatcom: | 12.9% (24,410) |
| State: | 12.9% (14,315) |
Number of households with income $100k - 125k:| East Whatcom: | 7.7% (14,651) |
| Washington: | 7.7% (8,592) |
Number of households with income $125k - 150k:| East Whatcom: | 8.9% (16,779) |
| State: | 8.9% (9,840) |
Number of households with income $150k - 200k:| East Whatcom: | 7.6% (14,382) |
| Washington: | 7.6% (8,434) |
Number of households with income > $200k:| East Whatcom: | 9.1% (17,180) |
| State: | 9.1% (10,075) |
Aggregate household income in East Whatcom in 2022: $755,768
Median family income in East Whatcom in 2022:| East Whatcom: | $124,210 |
| Washington: | $82,165 |
Median per capita income in East Whatcom in 2022:| East Whatcom: | $28,984 |
| State: | $38,209 |
Change in median per capita income between 2000 and 2022:| East Whatcom, Washington: | +89.2% |
| Washington: | +115.3% |
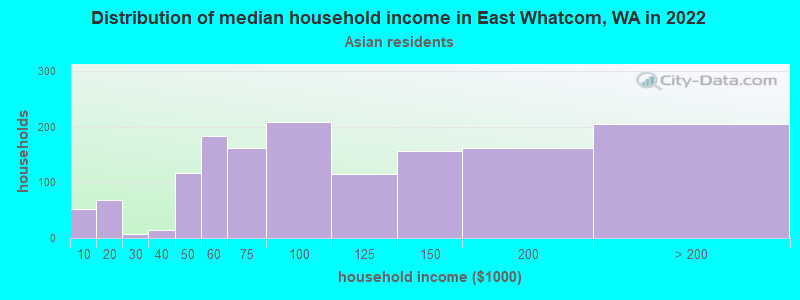
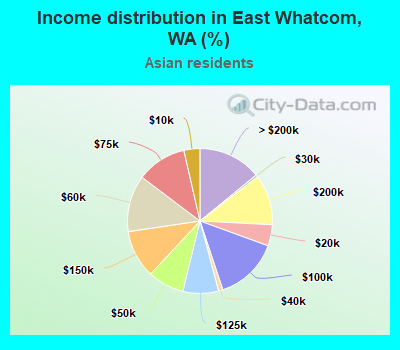
Income statistics for Asian residents
Median household income in East Whatcom, WA in 2022:| East Whatcom: | $33,464 |
| State: | $125,692 |
Number of households with income < $10k:| East Whatcom: | 3.6% (52) |
| State: | 4.9% (14,099) |
Number of households with income $10k - 20k:| East Whatcom: | 4.7% (69) |
| State: | 3.5% (9,873) |
Number of households with income $20k - 30k:| East Whatcom: | 0.5% (8) |
| State: | 2.9% (8,352) |
Number of households with income $30k - 40k:| East Whatcom: | 1.0% (14) |
| Washington: | 4.0% (11,415) |
Number of households with income $40k - 50k:| East Whatcom: | 8.1% (118) |
| State: | 4.0% (11,421) |
Number of households with income $50k - 60k:| East Whatcom: | 12.6% (184) |
| Washington: | 4.2% (12,100) |
Number of households with income $60k - 75k:| East Whatcom: | 11.1% (162) |
| State: | 6.3% (17,903) |
Number of households with income $75k - 100k:| East Whatcom: | 14.4% (209) |
| Washington: | 10.4% (29,663) |
Number of households with income $100k - 125k:| East Whatcom: | 8.0% (116) |
| State: | 9.4% (26,839) |
Number of households with income $125k - 150k:| East Whatcom: | 10.7% (156) |
| State: | 8.5% (24,200) |
Number of households with income $150k - 200k:| East Whatcom: | 11.2% (163) |
| State: | 12.6% (35,976) |
Number of households with income > $200k:| East Whatcom: | 14.1% (205) |
| State: | 29.2% (83,109) |
Aggregate household income in East Whatcom in 2022: $144,117
Median family income in East Whatcom in 2022:| East Whatcom: | $35,228 |
| State: | $143,595 |
Median per capita income in East Whatcom in 2022:| East Whatcom: | $7,900 |
| State: | $67,666 |
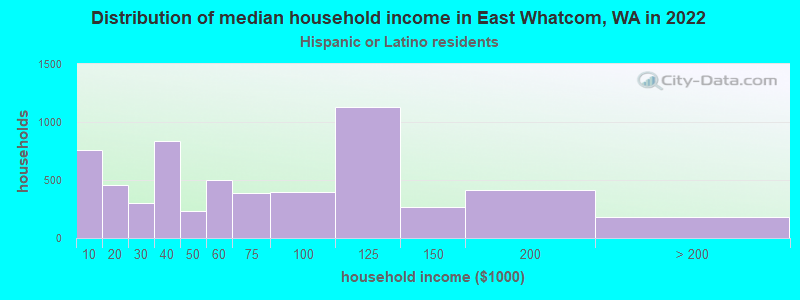
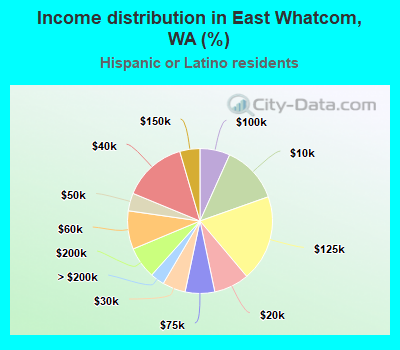
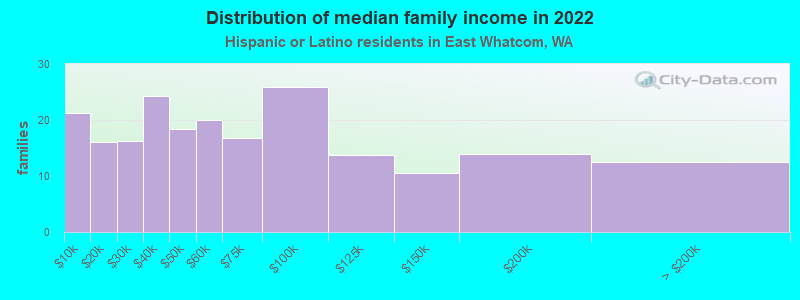
Income statistics for Hispanic or Latino residents
Median household income in East Whatcom, WA in 2022:| East Whatcom: | $50,612 |
| State: | $74,770 |
Change in median household income between 2000 and 2022:| East Whatcom, Washington: | +91.0% |
| Washington: | +128.3% |
Number of households with income < $10k:| East Whatcom: | 12.9% (756) |
| State: | 4.9% (14,456) |
Number of households with income $10k - 20k:| East Whatcom: | 7.9% (461) |
| State: | 5.3% (15,449) |
Number of households with income $20k - 30k:| East Whatcom: | 5.2% (303) |
| State: | 6.8% (20,016) |
Number of households with income $30k - 40k:| East Whatcom: | 14.3% (838) |
| State: | 7.7% (22,548) |
Number of households with income $40k - 50k:| East Whatcom: | 4.0% (233) |
| State: | 7.3% (21,450) |
Number of households with income $50k - 60k:| East Whatcom: | 8.6% (502) |
| Washington: | 7.7% (22,744) |
Number of households with income $60k - 75k:| East Whatcom: | 6.6% (387) |
| State: | 10.5% (30,737) |
Number of households with income $75k - 100k:| East Whatcom: | 6.7% (394) |
| State: | 14.9% (43,843) |
Number of households with income $100k - 125k:| East Whatcom: | 19.3% (1,132) |
| State: | 11.1% (32,554) |
Number of households with income $125k - 150k:| East Whatcom: | 4.5% (264) |
| Washington: | 7.4% (21,624) |
Number of households with income $150k - 200k:| East Whatcom: | 7.1% (416) |
| Washington: | 7.3% (21,360) |
Number of households with income > $200k:| East Whatcom: | 3.2% (185) |
| State: | 9.2% (27,055) |
Aggregate household income in East Whatcom in 2022: $9,146,543
Median family income in East Whatcom in 2022:| East Whatcom: | $65,790 |
| State: | $76,866 |
Number of families with income < $10k:| East Whatcom: | 10.1% (21) |
| Washington: | 4.4% (9,443) |
Number of families with income $10k - 20k:| East Whatcom: | 7.6% (16) |
| Washington: | 3.5% (7,524) |
Number of families with income $20k - 30k:| East Whatcom: | 7.7% (16) |
| Washington: | 5.6% (12,052) |
Number of families with income $30k - 40k:| East Whatcom: | 11.6% (24) |
| State: | 8.3% (17,803) |
Number of families with income $40k - 50k:| East Whatcom: | 8.8% (18) |
| Washington: | 7.7% (16,361) |
Number of families with income $50k - 60k:| East Whatcom: | 9.5% (20) |
| State: | 7.9% (16,852) |
Number of families with income $60k - 75k:| East Whatcom: | 8.0% (17) |
| State: | 11.4% (24,342) |
Number of families with income $75k - 100k:| East Whatcom: | 12.3% (26) |
| State: | 14.4% (30,698) |
Number of families with income $100k - 125k:| East Whatcom: | 6.6% (14) |
| State: | 11.4% (24,331) |
Number of families with income $125k - 150k:| East Whatcom: | 5.0% (10) |
| Washington: | 7.5% (16,099) |
Number of families with income $150k - 200k:| East Whatcom: | 6.7% (14) |
| State: | 8.2% (17,551) |
Number of families with income > $200k:| East Whatcom: | 5.9% (12) |
| State: | 9.7% (20,653) |
Median per capita income in East Whatcom in 2022:| East Whatcom: | $15,091 |
| Washington: | $28,252 |
Change in median per capita income between 2000 and 2022:| East Whatcom, Washington: | +88.2% |
| State: | +150.2% |
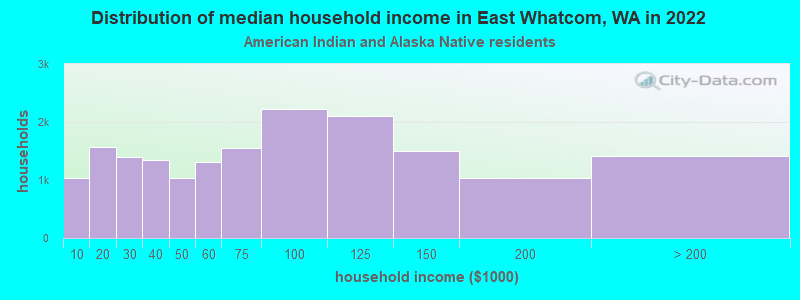
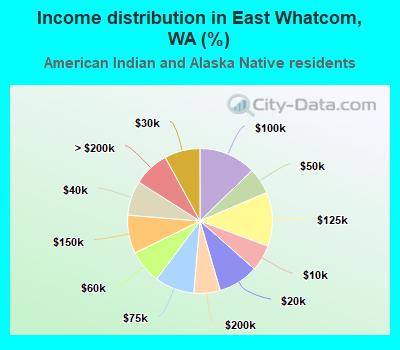
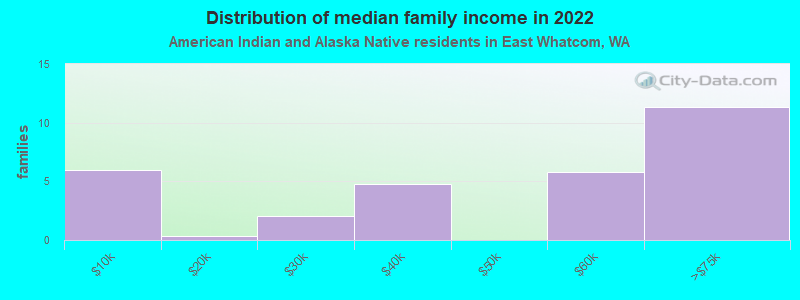
Income statistics for American Indian and Alaska Native residents
Median household income in East Whatcom, WA in 2022:| East Whatcom: | $79,065 |
| Washington: | $71,255 |
Change in median household income between 2000 and 2022:| East Whatcom, Washington: | +108.5% |
| State: | +118.1% |
Number of households with income < $10k:| East Whatcom: | 5.9% (1,030) |
| Washington: | 5.9% (1,768) |
Number of households with income $10k - 20k:| East Whatcom: | 9.0% (1,572) |
| Washington: | 8.9% (2,694) |
Number of households with income $20k - 30k:| East Whatcom: | 8.0% (1,391) |
| State: | 8.0% (2,412) |
Number of households with income $30k - 40k:| East Whatcom: | 7.7% (1,348) |
| Washington: | 7.7% (2,327) |
Number of households with income $40k - 50k:| East Whatcom: | 5.9% (1,030) |
| State: | 5.8% (1,755) |
Number of households with income $50k - 60k:| East Whatcom: | 7.5% (1,311) |
| State: | 7.5% (2,259) |
Number of households with income $60k - 75k:| East Whatcom: | 8.8% (1,546) |
| State: | 8.8% (2,669) |
Number of households with income $75k - 100k:| East Whatcom: | 12.7% (2,228) |
| Washington: | 12.8% (3,861) |
Number of households with income $100k - 125k:| East Whatcom: | 12.0% (2,103) |
| State: | 12.0% (3,618) |
Number of households with income $125k - 150k:| East Whatcom: | 8.6% (1,502) |
| State: | 8.6% (2,580) |
Number of households with income $150k - 200k:| East Whatcom: | 5.9% (1,027) |
| Washington: | 5.9% (1,774) |
Number of households with income > $200k:| East Whatcom: | 8.0% (1,406) |
| State: | 8.1% (2,447) |
Aggregate household income in East Whatcom in 2022: $3,351,451
Median family income in East Whatcom in 2022:| East Whatcom: | $65,241 |
| Washington: | $79,010 |
Number of families with income < $10k:| East Whatcom: | 19.6% (6) |
| State: | 5.2% (1,047) |
Number of families with income $10k - 20k:| East Whatcom: | 1.0% (0) |
| State: | 5.2% (1,056) |
Number of families with income $20k - 30k:| East Whatcom: | 6.9% (2) |
| State: | 6.2% (1,258) |
Number of families with income $30k - 40k:| East Whatcom: | 15.8% (5) |
| State: | 5.9% (1,190) |
Number of families with income $50k - 60k:| East Whatcom: | 19.2% (6) |
| State: | 9.7% (1,973) |
Number of families with income $60k - 75k:| East Whatcom: | 37.5% (11) |
| Washington: | 10.5% (2,124) |
Median non-family income in East Whatcom in 2022:| East Whatcom: | $33,848 |
| Washington: | $35,591 |
Median per capita income in East Whatcom in 2022:| East Whatcom: | $19,724 |
| Washington: | $27,053 |
Change in median per capita income between 2000 and 2022:| East Whatcom, Washington: | +87.0% |
| Washington: | +98.6% |
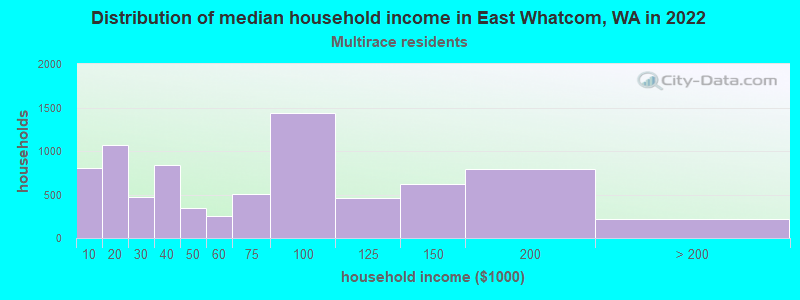
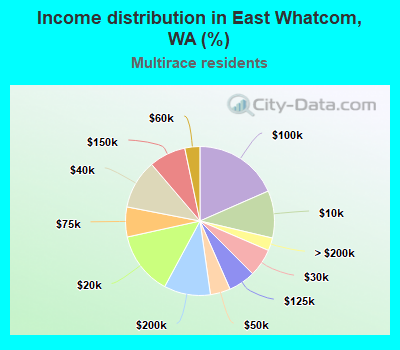
Income statistics for Multirace residents
Median household income in East Whatcom, WA in 2022:| East Whatcom: | $74,358 |
| State: | $84,303 |
Change in median household income between 2000 and 2022:| East Whatcom, Washington: | +98.3% |
| State: | +125.7% |
Number of households with income < $10k:| East Whatcom: | 10.3% (802) |
| State: | 4.3% (12,040) |
Number of households with income $10k - 20k:| East Whatcom: | 13.7% (1,070) |
| State: | 6.6% (18,437) |
Number of households with income $20k - 30k:| East Whatcom: | 6.1% (473) |
| Washington: | 5.2% (14,559) |
Number of households with income $30k - 40k:| East Whatcom: | 10.7% (837) |
| Washington: | 6.7% (18,491) |
Number of households with income $40k - 50k:| East Whatcom: | 4.4% (341) |
| State: | 6.3% (17,459) |
Number of households with income $50k - 60k:| East Whatcom: | 3.3% (255) |
| State: | 6.9% (19,086) |
Number of households with income $60k - 75k:| East Whatcom: | 6.5% (507) |
| Washington: | 9.1% (25,310) |
Number of households with income $75k - 100k:| East Whatcom: | 18.4% (1,439) |
| Washington: | 13.5% (37,493) |
Number of households with income $100k - 125k:| East Whatcom: | 5.9% (458) |
| State: | 10.7% (29,626) |
Number of households with income $125k - 150k:| East Whatcom: | 8.0% (623) |
| State: | 8.6% (23,899) |
Number of households with income $150k - 200k:| East Whatcom: | 10.1% (789) |
| State: | 10.2% (28,214) |
Number of households with income > $200k:| East Whatcom: | 2.8% (218) |
| Washington: | 11.9% (32,947) |
Aggregate household income in East Whatcom in 2022: $24,455,337
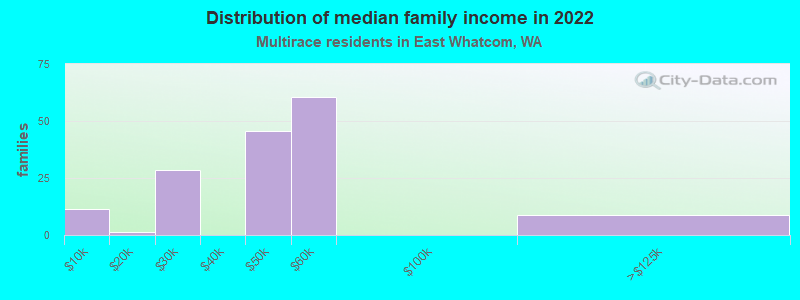
Median family income in East Whatcom in 2022:| East Whatcom: | $90,566 |
| State: | $95,629 |
Number of families with income < $10k:| East Whatcom: | 7.3% (11) |
| State: | 3.5% (6,121) |
Number of families with income $10k - 20k:| East Whatcom: | 0.8% (1) |
| State: | 4.3% (7,519) |
Number of families with income $20k - 30k:| East Whatcom: | 18.2% (28) |
| Washington: | 4.4% (7,775) |
Number of families with income $40k - 50k:| East Whatcom: | 29.2% (46) |
| Washington: | 5.9% (10,412) |
Number of families with income $50k - 60k:| East Whatcom: | 38.8% (61) |
| State: | 5.6% (9,922) |
Number of families with income $100k - 125k:| East Whatcom: | 5.7% (9) |
| Washington: | 10.4% (18,288) |
Median non-family income in East Whatcom in 2022:| East Whatcom: | $8,822 |
| State: | $56,573 |
Change in median non-family income between 2000 and 2022:| East Whatcom, Washington: | +41.1% |
| Washington: | +115.0% |
Median per capita income in East Whatcom in 2022:| East Whatcom: | $12,684 |
| State: | $32,496 |
Change in median per capita income between 2000 and 2022:| East Whatcom, Washington: | +68.6% |
| State: | +156.8% |
Income statistics for other residents
Number of households with income < $10k:| East Whatcom: | 3.6% (4) |
| Washington: | 5.3% (6,540) |
Number of households with income $10k - 20k:| East Whatcom: | 6.2% (7) |
| State: | 6.0% (7,385) |
Number of households with income $20k - 30k:| East Whatcom: | 8.9% (10) |
| Washington: | 7.5% (9,289) |
Number of households with income $30k - 40k:| East Whatcom: | 10.7% (12) |
| State: | 8.9% (11,015) |
Number of households with income $40k - 50k:| East Whatcom: | 8.9% (10) |
| State: | 7.6% (9,399) |
Number of households with income $50k - 60k:| East Whatcom: | 8.0% (9) |
| Washington: | 7.2% (8,867) |
Number of households with income $60k - 75k:| East Whatcom: | 9.8% (11) |
| Washington: | 10.5% (13,032) |
Number of households with income $75k - 100k:| East Whatcom: | 12.5% (14) |
| State: | 14.6% (18,007) |
Number of households with income $100k - 125k:| East Whatcom: | 12.5% (14) |
| State: | 12.2% (15,128) |
Number of households with income $125k - 150k:| East Whatcom: | 5.4% (6) |
| Washington: | 5.6% (6,950) |
Number of households with income $150k - 200k:| East Whatcom: | 6.2% (7) |
| Washington: | 7.1% (8,749) |
Number of households with income > $200k:| East Whatcom: | 7.1% (8) |
| State: | 7.5% (9,208) |
Aggregate household income in East Whatcom in 2022: $6,554,802
Median family income in East Whatcom in 2022:| East Whatcom: | $97,483 |
| State: | $72,588 |
Median non-family income in East Whatcom in 2022:| East Whatcom: | $690,634 |
| State: | $44,777 |
Median per capita income in East Whatcom in 2022:| East Whatcom: | $62,331 |
| State: | $27,542 |
Change in median per capita income between 2000 and 2022:| East Whatcom, Washington: | +115.8% |
| State: | +167.8% |