Eastford, Connecticut (CT) income map, earnings map, and wages data
The median household income in Eastford, CT in 2022 was $96,720, which was 8.6% greater than the median annual income of $88,429 across the entire state of Connecticut. Compared to the median income of $57,159 in 2000 this represents an increase of 40.9%. The per capita income in 2022 was $46,398, which means an increase of 45.3% compared to 2000 when it was $25,364.
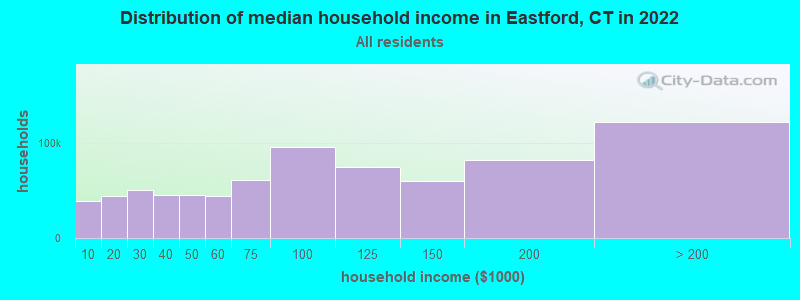
Income statistics for all residents
Median household income in Eastford, CT in 2022:| Eastford: | $96,721 |
| Connecticut: | $88,429 |
Change in median household income between 2000 and 2022:| Eastford, Connecticut: | +69.2% |
| State: | +64.0% |
Number of households with income < $10k:| Eastford: | 5.2% (39,396) |
| State: | 5.1% (72,746) |
Number of households with income $10k - 20k:| Eastford: | 5.8% (44,425) |
| Connecticut: | 5.7% (81,643) |
Number of households with income $20k - 30k:| Eastford: | 6.6% (50,286) |
| State: | 6.5% (92,844) |
Number of households with income $30k - 40k:| Eastford: | 5.9% (45,128) |
| Connecticut: | 5.9% (83,934) |
Number of households with income $40k - 50k:| Eastford: | 5.9% (44,838) |
| State: | 5.8% (83,025) |
Number of households with income $50k - 60k:| Eastford: | 5.8% (43,967) |
| Connecticut: | 5.7% (81,788) |
Number of households with income $60k - 75k:| Eastford: | 8.1% (61,603) |
| Connecticut: | 8.1% (115,651) |
Number of households with income $75k - 100k:| Eastford: | 12.6% (96,210) |
| State: | 12.6% (180,173) |
Number of households with income $100k - 125k:| Eastford: | 9.8% (74,898) |
| State: | 9.9% (141,231) |
Number of households with income $125k - 150k:| Eastford: | 7.8% (59,813) |
| State: | 7.9% (112,826) |
Number of households with income $150k - 200k:| Eastford: | 10.7% (81,820) |
| State: | 10.8% (154,641) |
Number of households with income > $200k:| Eastford: | 16.0% (122,234) |
| State: | 16.3% (233,133) |
Aggregate household income in Eastford in 2022: $1,777,657,789
Median family income in Eastford in 2022:| Eastford: | $110,787 |
| State: | $115,183 |
Median non-family income in Eastford in 2022:| Eastford: | $46,726 |
| Connecticut: | $50,964 |
Change in median non-family income between 2000 and 2022:| Eastford, Connecticut: | +71.5% |
| Connecticut: | +65.1% |
Median per capita income in Eastford in 2022:| Eastford: | $46,398 |
| Connecticut: | $51,581 |
Change in median per capita income between 2000 and 2022:| Eastford, Connecticut: | +82.9% |
| State: | +79.3% |
Income statistics for White residents
Median household income in Eastford, CT in 2022:| Eastford: | $95,882 |
| Connecticut: | $96,890 |
Change in median household income between 2000 and 2022:| Eastford, Connecticut: | +69.4% |
| State: | +68.5% |
Number of households with income < $10k:| Eastford: | 4.2% (20,971) |
| Connecticut: | 4.2% (42,265) |
Number of households with income $10k - 20k:| Eastford: | 4.9% (24,110) |
| State: | 4.8% (48,323) |
Number of households with income $20k - 30k:| Eastford: | 5.8% (28,674) |
| State: | 5.7% (57,716) |
Number of households with income $30k - 40k:| Eastford: | 5.4% (26,542) |
| State: | 5.3% (53,827) |
Number of households with income $40k - 50k:| Eastford: | 5.3% (26,433) |
| Connecticut: | 5.3% (53,301) |
Number of households with income $50k - 60k:| Eastford: | 5.6% (27,508) |
| State: | 5.5% (55,690) |
Number of households with income $60k - 75k:| Eastford: | 7.9% (39,311) |
| State: | 8.0% (80,329) |
Number of households with income $75k - 100k:| Eastford: | 12.7% (62,990) |
| State: | 12.7% (128,070) |
Number of households with income $100k - 125k:| Eastford: | 10.0% (49,462) |
| State: | 10.0% (101,210) |
Number of households with income $125k - 150k:| Eastford: | 8.0% (39,710) |
| State: | 8.0% (81,250) |
Number of households with income $150k - 200k:| Eastford: | 11.8% (58,389) |
| State: | 11.8% (119,527) |
Number of households with income > $200k:| Eastford: | 18.4% (91,406) |
| Connecticut: | 18.6% (187,875) |
Aggregate household income in Eastford in 2022: $1,330,525,728
Median family income in Eastford in 2022:| Eastford: | $113,502 |
| State: | $128,955 |
Number of families with income < $10k:| Eastford: | 3.7% (12) |
| State: | 1.9% (11,537) |
Number of families with income $10k - 20k:| Eastford: | 2.7% (9) |
| Connecticut: | 1.8% (11,289) |
Number of families with income $20k - 30k:| Eastford: | 3.5% (12) |
| Connecticut: | 3.0% (18,506) |
Number of families with income $30k - 40k:| Eastford: | 5.0% (16) |
| Connecticut: | 2.9% (18,160) |
Number of families with income $40k - 50k:| Eastford: | 5.6% (18) |
| Connecticut: | 3.9% (24,550) |
Number of families with income $50k - 60k:| Eastford: | 5.9% (20) |
| State: | 4.3% (26,723) |
Number of families with income $60k - 75k:| Eastford: | 12.9% (43) |
| State: | 7.1% (44,075) |
Number of families with income $75k - 100k:| Eastford: | 13.2% (44) |
| State: | 12.5% (77,679) |
Number of families with income $100k - 125k:| Eastford: | 12.9% (43) |
| State: | 11.1% (69,086) |
Number of families with income $125k - 150k:| Eastford: | 5.8% (19) |
| State: | 9.6% (59,616) |
Number of families with income $150k - 200k:| Eastford: | 11.7% (39) |
| State: | 15.7% (97,890) |
Number of families with income > $200k:| Eastford: | 16.9% (56) |
| State: | 26.3% (163,417) |
Median non-family income in Eastford in 2022:| Eastford: | $46,675 |
| Connecticut: | $54,067 |
Change in median non-family income between 2000 and 2022:| Eastford, Connecticut: | +73.7% |
| Connecticut: | +68.7% |
Median per capita income in Eastford in 2022:| Eastford: | $49,170 |
| State: | $59,916 |
Change in median per capita income between 2000 and 2022:| Eastford, Connecticut: | +92.1% |
| State: | +90.2% |
Income statistics for Black or African American residents
Median household income in Eastford, CT in 2022:| Eastford: | $321,818 |
| State: | $61,803 |
Change in median household income between 2000 and 2022:| Eastford, Connecticut: | +60.9% |
| Connecticut: | +76.1% |
Number of households with income < $10k:| Eastford: | 6.8% (54,091) |
| State: | 6.8% (9,494) |
Number of households with income $10k - 20k:| Eastford: | 7.9% (62,688) |
| State: | 7.9% (11,003) |
Number of households with income $20k - 30k:| Eastford: | 10.8% (85,717) |
| State: | 10.8% (15,045) |
Number of households with income $30k - 40k:| Eastford: | 8.2% (65,526) |
| Connecticut: | 8.2% (11,501) |
Number of households with income $40k - 50k:| Eastford: | 7.4% (59,344) |
| State: | 7.4% (10,416) |
Number of households with income $50k - 60k:| Eastford: | 7.5% (60,016) |
| Connecticut: | 7.5% (10,534) |
Number of households with income $60k - 75k:| Eastford: | 8.0% (64,061) |
| State: | 8.0% (11,244) |
Number of households with income $75k - 100k:| Eastford: | 9.6% (76,174) |
| State: | 9.6% (13,370) |
Number of households with income $100k - 125k:| Eastford: | 10.2% (81,154) |
| State: | 10.2% (14,244) |
Number of households with income $125k - 150k:| Eastford: | 8.0% (64,073) |
| State: | 8.0% (11,246) |
Number of households with income $150k - 200k:| Eastford: | 7.7% (61,116) |
| State: | 7.7% (10,727) |
Number of households with income > $200k:| Eastford: | 7.9% (63,161) |
| State: | 7.9% (11,086) |
Aggregate household income in Eastford in 2022: $2,424,245
Median family income in Eastford in 2022:| Eastford: | $444,397 |
| State: | $87,228 |
Number of families with income > $200k:| Eastford: | 100.0% (22) |
| Connecticut: | 10.8% (9,057) |
Median per capita income in Eastford in 2022:| Eastford: | $125,620 |
| State: | $36,289 |
Change in median per capita income between 2000 and 2022:| Eastford, Connecticut: | +115.2% |
| Connecticut: | +117.5% |
Income statistics for Asian residents
Median household income in Eastford, CT in 2022:| Eastford: | $169,095 |
| State: | $110,568 |
Change in median household income between 2000 and 2022:| Eastford, Connecticut: | +110.1% |
| Connecticut: | +79.5% |
Number of households with income < $10k:| Eastford: | 7.1% (5,548) |
| State: | 7.1% (4,245) |
Number of households with income $10k - 20k:| Eastford: | 3.5% (2,728) |
| State: | 3.5% (2,087) |
Number of households with income $20k - 30k:| Eastford: | 4.1% (3,220) |
| State: | 4.1% (2,464) |
Number of households with income $30k - 40k:| Eastford: | 4.1% (3,239) |
| State: | 4.1% (2,478) |
Number of households with income $40k - 50k:| Eastford: | 3.3% (2,592) |
| State: | 3.3% (1,983) |
Number of households with income $50k - 60k:| Eastford: | 3.9% (3,042) |
| State: | 3.9% (2,328) |
Number of households with income $60k - 75k:| Eastford: | 7.0% (5,526) |
| Connecticut: | 7.0% (4,228) |
Number of households with income $75k - 100k:| Eastford: | 11.5% (9,032) |
| State: | 11.5% (6,911) |
Number of households with income $100k - 125k:| Eastford: | 10.2% (8,007) |
| State: | 10.2% (6,127) |
Number of households with income $125k - 150k:| Eastford: | 8.5% (6,638) |
| State: | 8.5% (5,079) |
Number of households with income $150k - 200k:| Eastford: | 12.4% (9,715) |
| Connecticut: | 12.4% (7,434) |
Number of households with income > $200k:| Eastford: | 24.4% (19,160) |
| State: | 24.4% (14,661) |
Aggregate household income in Eastford in 2022: $1,254,614
Median non-family income in Eastford in 2022:| Eastford: | $200,083 |
| State: | $63,785 |
Change in median non-family income between 2000 and 2022:| Eastford, Connecticut: | +148.6% |
| State: | +77.9% |
Median per capita income in Eastford in 2022:| Eastford: | $30,212 |
| State: | $55,295 |
Change in median per capita income between 2000 and 2022:| Eastford, Connecticut: | +103.6% |
| State: | +97.8% |
Income statistics for Hispanic or Latino residents
Median household income in Eastford, CT in 2022:| Eastford: | $182,198 |
| State: | $60,275 |
Change in median household income between 2000 and 2022:| Eastford, Connecticut: | +67.8% |
| Connecticut: | +87.9% |
Number of households with income < $10k:| Eastford: | 8.7% (62,913) |
| Connecticut: | 8.7% (18,584) |
Number of households with income $10k - 20k:| Eastford: | 9.1% (65,116) |
| State: | 9.1% (19,235) |
Number of households with income $20k - 30k:| Eastford: | 8.9% (64,284) |
| State: | 8.9% (18,989) |
Number of households with income $30k - 40k:| Eastford: | 7.5% (54,053) |
| State: | 7.5% (15,967) |
Number of households with income $40k - 50k:| Eastford: | 8.7% (62,514) |
| State: | 8.7% (18,466) |
Number of households with income $50k - 60k:| Eastford: | 6.9% (49,784) |
| State: | 6.9% (14,706) |
Number of households with income $60k - 75k:| Eastford: | 8.9% (63,942) |
| State: | 8.9% (18,888) |
Number of households with income $75k - 100k:| Eastford: | 13.5% (97,054) |
| State: | 13.5% (28,669) |
Number of households with income $100k - 125k:| Eastford: | 8.2% (59,020) |
| Connecticut: | 8.2% (17,434) |
Number of households with income $125k - 150k:| Eastford: | 6.5% (46,555) |
| State: | 6.5% (13,752) |
Number of households with income $150k - 200k:| Eastford: | 6.6% (47,780) |
| Connecticut: | 6.6% (14,114) |
Number of households with income > $200k:| Eastford: | 6.4% (46,142) |
| State: | 6.4% (13,630) |
Aggregate household income in Eastford in 2022: $7,714,832
Median family income in Eastford in 2022:| Eastford: | $185,766 |
| State: | $68,336 |
Number of families with income < $10k:| Eastford: | 6.8% (6) |
| State: | 5.2% (7,456) |
Number of families with income $10k - 20k:| Eastford: | 8.7% (8) |
| State: | 6.0% (8,616) |
Number of families with income $20k - 30k:| Eastford: | 10.4% (9) |
| Connecticut: | 8.9% (12,680) |
Number of families with income $30k - 40k:| Eastford: | 10.4% (9) |
| State: | 8.5% (12,090) |
Number of families with income $40k - 50k:| Eastford: | 10.5% (9) |
| State: | 8.8% (12,624) |
Number of families with income $50k - 60k:| Eastford: | 9.8% (9) |
| Connecticut: | 8.4% (11,924) |
Number of families with income $60k - 75k:| Eastford: | 12.8% (12) |
| State: | 8.9% (12,677) |
Number of families with income $75k - 100k:| Eastford: | 12.7% (11) |
| State: | 14.3% (20,457) |
Number of families with income $100k - 125k:| Eastford: | 6.9% (6) |
| State: | 8.2% (11,720) |
Number of families with income $125k - 150k:| Eastford: | 4.0% (4) |
| Connecticut: | 8.2% (11,729) |
Number of families with income $150k - 200k:| Eastford: | 3.5% (3) |
| State: | 7.1% (10,096) |
Number of families with income > $200k:| Eastford: | 3.5% (3) |
| State: | 7.4% (10,622) |
Median per capita income in Eastford in 2022:| Eastford: | $31,017 |
| State: | $28,507 |
Change in median per capita income between 2000 and 2022:| Eastford, Connecticut: | +80.3% |
| Connecticut: | +117.2% |
Income statistics for Multirace residents
Number of households with income < $10k:| Eastford: | 6.0% (1,204) |
| State: | 6.0% (7,457) |
Number of households with income $10k - 20k:| Eastford: | 8.1% (1,637) |
| State: | 8.1% (10,139) |
Number of households with income $20k - 30k:| Eastford: | 7.0% (1,405) |
| State: | 7.0% (8,702) |
Number of households with income $30k - 40k:| Eastford: | 6.9% (1,380) |
| State: | 6.9% (8,546) |
Number of households with income $40k - 50k:| Eastford: | 7.0% (1,407) |
| State: | 7.0% (8,712) |
Number of households with income $50k - 60k:| Eastford: | 5.9% (1,184) |
| Connecticut: | 5.9% (7,331) |
Number of households with income $60k - 75k:| Eastford: | 8.5% (1,717) |
| Connecticut: | 8.5% (10,634) |
Number of households with income $75k - 100k:| Eastford: | 14.1% (2,842) |
| Connecticut: | 14.1% (17,600) |
Number of households with income $100k - 125k:| Eastford: | 9.9% (1,999) |
| State: | 9.9% (12,383) |
Number of households with income $125k - 150k:| Eastford: | 7.2% (1,440) |
| Connecticut: | 7.2% (8,921) |
Number of households with income $150k - 200k:| Eastford: | 8.8% (1,764) |
| State: | 8.8% (10,922) |
Number of households with income > $200k:| Eastford: | 10.6% (2,139) |
| State: | 10.6% (13,247) |
Median per capita income in Eastford in 2022:| Eastford: | $4,765 |
| Connecticut: | $32,794 |
Change in median per capita income between 2000 and 2022:| Eastford, Connecticut: | +95.5% |
| State: | +117.2% |