Eola-Paint Rock, Texas (TX) income map, earnings map, and wages data
The median household income in Eola-Paint Rock, TX in 2022 was $59,038, which was 22.4% less than the median annual income of $72,284 across the entire state of Texas. Compared to the median income of $32,024 in 2000 this represents an increase of 45.8%. The per capita income in 2022 was $40,040, which means an increase of 48.5% compared to 2000 when it was $20,617.
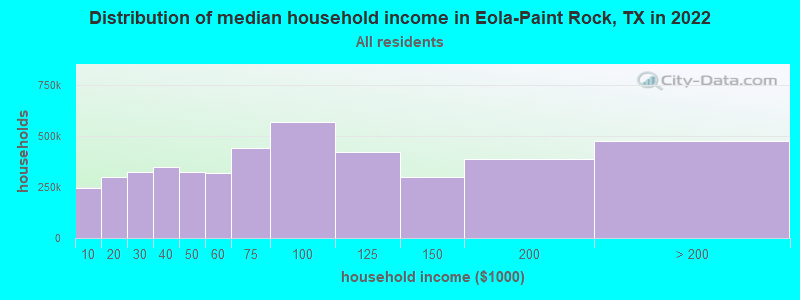
Income statistics for all residents
Median household income in Eola-Paint Rock, TX in 2022:| Eola-Paint Rock: | $59,039 |
| State: | $72,284 |
Change in median household income between 2000 and 2022:| Eola-Paint Rock, Texas: | +84.4% |
| Texas: | +81.0% |
Number of households with income < $10k:| Eola-Paint Rock: | 5.5% (244,901) |
| State: | 5.5% (611,011) |
Number of households with income $10k - 20k:| Eola-Paint Rock: | 6.7% (298,021) |
| State: | 6.7% (743,157) |
Number of households with income $20k - 30k:| Eola-Paint Rock: | 7.2% (322,182) |
| State: | 7.2% (803,381) |
Number of households with income $30k - 40k:| Eola-Paint Rock: | 7.8% (347,287) |
| State: | 7.8% (866,080) |
Number of households with income $40k - 50k:| Eola-Paint Rock: | 7.3% (324,989) |
| Texas: | 7.3% (810,440) |
Number of households with income $50k - 60k:| Eola-Paint Rock: | 7.2% (320,673) |
| State: | 7.2% (799,783) |
Number of households with income $60k - 75k:| Eola-Paint Rock: | 9.9% (439,216) |
| State: | 9.9% (1,095,384) |
Number of households with income $75k - 100k:| Eola-Paint Rock: | 12.8% (569,154) |
| State: | 12.8% (1,419,057) |
Number of households with income $100k - 125k:| Eola-Paint Rock: | 9.5% (423,012) |
| State: | 9.5% (1,054,577) |
Number of households with income $125k - 150k:| Eola-Paint Rock: | 6.7% (297,512) |
| State: | 6.7% (741,518) |
Number of households with income $150k - 200k:| Eola-Paint Rock: | 8.7% (385,668) |
| State: | 8.7% (961,776) |
Number of households with income > $200k:| Eola-Paint Rock: | 10.7% (473,599) |
| State: | 10.7% (1,181,544) |
Aggregate household income in Eola-Paint Rock in 2022: $4,759,072,388
Median family income in Eola-Paint Rock in 2022:| Eola-Paint Rock: | $77,148 |
| Texas: | $86,267 |
Median non-family income in Eola-Paint Rock in 2022:| Eola-Paint Rock: | $29,376 |
| Texas: | $45,999 |
Change in median non-family income between 2000 and 2022:| Eola-Paint Rock, Texas: | +85.2% |
| State: | +79.5% |
Median per capita income in Eola-Paint Rock in 2022:| Eola-Paint Rock: | $40,041 |
| Texas: | $38,123 |
Change in median per capita income between 2000 and 2022:| Eola-Paint Rock, Texas: | +94.2% |
| State: | +94.3% |
Income statistics for White residents
Median household income in Eola-Paint Rock, TX in 2022:| Eola-Paint Rock: | $64,621 |
| State: | $82,032 |
Change in median household income between 2000 and 2022:| Eola-Paint Rock, Texas: | +90.4% |
| State: | +91.0% |
Number of households with income < $10k:| Eola-Paint Rock: | 4.7% (107,842) |
| State: | 4.7% (273,716) |
Number of households with income $10k - 20k:| Eola-Paint Rock: | 5.5% (127,375) |
| State: | 5.5% (322,702) |
Number of households with income $20k - 30k:| Eola-Paint Rock: | 6.2% (143,734) |
| State: | 6.2% (363,947) |
Number of households with income $30k - 40k:| Eola-Paint Rock: | 6.8% (157,550) |
| State: | 6.8% (399,275) |
Number of households with income $40k - 50k:| Eola-Paint Rock: | 6.5% (151,238) |
| Texas: | 6.5% (383,417) |
Number of households with income $50k - 60k:| Eola-Paint Rock: | 6.6% (153,229) |
| State: | 6.6% (388,535) |
Number of households with income $60k - 75k:| Eola-Paint Rock: | 9.6% (223,039) |
| Texas: | 9.7% (566,295) |
Number of households with income $75k - 100k:| Eola-Paint Rock: | 13.0% (299,727) |
| State: | 13.0% (760,276) |
Number of households with income $100k - 125k:| Eola-Paint Rock: | 10.2% (235,597) |
| State: | 10.2% (597,596) |
Number of households with income $125k - 150k:| Eola-Paint Rock: | 7.4% (172,168) |
| Texas: | 7.4% (436,830) |
Number of households with income $150k - 200k:| Eola-Paint Rock: | 9.9% (229,622) |
| State: | 9.9% (583,067) |
Number of households with income > $200k:| Eola-Paint Rock: | 13.5% (311,344) |
| Texas: | 13.5% (792,647) |
Aggregate household income in Eola-Paint Rock in 2022: $2,695,298,696
Median family income in Eola-Paint Rock in 2022:| Eola-Paint Rock: | $87,753 |
| Texas: | $101,788 |
Number of families with income < $10k:| Eola-Paint Rock: | 3.2% (7) |
| State: | 2.8% (108,142) |
Number of families with income $10k - 20k:| Eola-Paint Rock: | 4.1% (9) |
| State: | 2.9% (113,421) |
Number of families with income $20k - 30k:| Eola-Paint Rock: | 5.9% (13) |
| State: | 4.1% (157,688) |
Number of families with income $30k - 40k:| Eola-Paint Rock: | 4.9% (11) |
| State: | 5.2% (198,847) |
Number of families with income $40k - 50k:| Eola-Paint Rock: | 6.6% (15) |
| Texas: | 5.6% (216,490) |
Number of families with income $50k - 60k:| Eola-Paint Rock: | 10.2% (23) |
| Texas: | 5.7% (220,689) |
Number of families with income $60k - 75k:| Eola-Paint Rock: | 7.7% (17) |
| State: | 9.0% (346,106) |
Number of families with income $75k - 100k:| Eola-Paint Rock: | 9.0% (20) |
| State: | 13.7% (527,363) |
Number of families with income $100k - 125k:| Eola-Paint Rock: | 5.5% (12) |
| State: | 11.6% (448,411) |
Number of families with income $150k - 200k:| Eola-Paint Rock: | 18.0% (40) |
| State: | 12.5% (480,185) |
Number of families with income > $200k:| Eola-Paint Rock: | 24.9% (55) |
| State: | 17.6% (677,490) |
Median non-family income in Eola-Paint Rock in 2022:| Eola-Paint Rock: | $30,376 |
| State: | $50,587 |
Change in median non-family income between 2000 and 2022:| Eola-Paint Rock, Texas: | +85.8% |
| State: | +87.7% |
Median per capita income in Eola-Paint Rock in 2022:| Eola-Paint Rock: | $49,401 |
| State: | $47,740 |
Change in median per capita income between 2000 and 2022:| Eola-Paint Rock, Texas: | +112.1% |
| State: | +114.3% |
Income statistics for Hispanic or Latino residents
Median household income in Eola-Paint Rock, TX in 2022:| Eola-Paint Rock: | $55,885 |
| State: | $60,504 |
Change in median household income between 2000 and 2022:| Eola-Paint Rock, Texas: | +112.9% |
| State: | +102.5% |
Number of households with income < $10k:| Eola-Paint Rock: | 5.8% (94,107) |
| Texas: | 5.8% (213,953) |
Number of households with income $10k - 20k:| Eola-Paint Rock: | 8.0% (130,881) |
| Texas: | 8.0% (297,456) |
Number of households with income $20k - 30k:| Eola-Paint Rock: | 9.2% (149,539) |
| Texas: | 9.2% (340,166) |
Number of households with income $30k - 40k:| Eola-Paint Rock: | 9.5% (155,910) |
| State: | 9.5% (354,336) |
Number of households with income $40k - 50k:| Eola-Paint Rock: | 8.8% (143,790) |
| Texas: | 8.8% (327,013) |
Number of households with income $50k - 60k:| Eola-Paint Rock: | 8.3% (135,710) |
| State: | 8.3% (308,818) |
Number of households with income $60k - 75k:| Eola-Paint Rock: | 10.9% (178,181) |
| State: | 10.9% (405,109) |
Number of households with income $75k - 100k:| Eola-Paint Rock: | 13.8% (225,137) |
| State: | 13.8% (511,639) |
Number of households with income $100k - 125k:| Eola-Paint Rock: | 8.6% (140,700) |
| State: | 8.6% (319,728) |
Number of households with income $125k - 150k:| Eola-Paint Rock: | 5.7% (92,903) |
| Texas: | 5.7% (210,932) |
Number of households with income $150k - 200k:| Eola-Paint Rock: | 6.4% (103,755) |
| State: | 6.4% (236,055) |
Number of households with income > $200k:| Eola-Paint Rock: | 5.1% (83,301) |
| State: | 5.1% (189,259) |
Aggregate household income in Eola-Paint Rock in 2022: $334,067,098
Median family income in Eola-Paint Rock in 2022:| Eola-Paint Rock: | $62,229 |
| State: | $65,080 |
Number of families with income < $10k:| Eola-Paint Rock: | 4.0% (6) |
| State: | 5.3% (147,493) |
Number of families with income $10k - 20k:| Eola-Paint Rock: | 13.1% (19) |
| State: | 6.3% (174,531) |
Number of families with income $20k - 30k:| Eola-Paint Rock: | 13.6% (20) |
| Texas: | 8.6% (238,528) |
Number of families with income $30k - 40k:| Eola-Paint Rock: | 9.2% (14) |
| Texas: | 9.1% (251,999) |
Number of families with income $40k - 50k:| Eola-Paint Rock: | 10.8% (16) |
| State: | 8.6% (240,188) |
Number of families with income $50k - 60k:| Eola-Paint Rock: | 13.6% (20) |
| Texas: | 8.0% (223,566) |
Number of families with income $60k - 75k:| Eola-Paint Rock: | 9.3% (14) |
| State: | 10.9% (302,688) |
Number of families with income $75k - 100k:| Eola-Paint Rock: | 7.8% (12) |
| State: | 14.3% (398,554) |
Number of families with income $100k - 125k:| Eola-Paint Rock: | 3.9% (6) |
| Texas: | 9.5% (264,007) |
Number of families with income $150k - 200k:| Eola-Paint Rock: | 8.3% (12) |
| State: | 7.3% (202,259) |
Number of families with income > $200k:| Eola-Paint Rock: | 6.3% (9) |
| State: | 5.9% (165,129) |
Median non-family income in Eola-Paint Rock in 2022:| Eola-Paint Rock: | $22,773 |
| State: | $39,934 |
Change in median non-family income between 2000 and 2022:| Eola-Paint Rock, Texas: | +120.8% |
| State: | +109.1% |
Median per capita income in Eola-Paint Rock in 2022:| Eola-Paint Rock: | $43,399 |
| State: | $24,862 |
Change in median per capita income between 2000 and 2022:| Eola-Paint Rock, Texas: | +128.5% |
| State: | +130.8% |
Income statistics for American Indian and Alaska Native residents
Median household income in Eola-Paint Rock, TX in 2022:| Eola-Paint Rock: | $99,282 |
| State: | $65,765 |
Change in median household income between 2000 and 2022:| Eola-Paint Rock, Texas: | +93.7% |
| State: | +88.3% |
Number of households with income < $10k:| Eola-Paint Rock: | 4.1% (2,498) |
| State: | 4.1% (3,398) |
Number of households with income $10k - 20k:| Eola-Paint Rock: | 8.3% (5,107) |
| State: | 8.3% (6,949) |
Number of households with income $20k - 30k:| Eola-Paint Rock: | 9.3% (5,691) |
| State: | 9.3% (7,742) |
Number of households with income $30k - 40k:| Eola-Paint Rock: | 9.1% (5,599) |
| Texas: | 9.1% (7,627) |
Number of households with income $40k - 50k:| Eola-Paint Rock: | 7.1% (4,356) |
| State: | 7.1% (5,922) |
Number of households with income $50k - 60k:| Eola-Paint Rock: | 8.1% (4,971) |
| State: | 8.1% (6,761) |
Number of households with income $60k - 75k:| Eola-Paint Rock: | 12.7% (7,779) |
| State: | 12.7% (10,588) |
Number of households with income $75k - 100k:| Eola-Paint Rock: | 13.0% (8,015) |
| State: | 13.0% (10,903) |
Number of households with income $100k - 125k:| Eola-Paint Rock: | 9.9% (6,069) |
| State: | 9.9% (8,256) |
Number of households with income $125k - 150k:| Eola-Paint Rock: | 5.2% (3,199) |
| Texas: | 5.2% (4,355) |
Number of households with income $150k - 200k:| Eola-Paint Rock: | 6.7% (4,128) |
| Texas: | 6.7% (5,623) |
Number of households with income > $200k:| Eola-Paint Rock: | 6.6% (4,053) |
| Texas: | 6.6% (5,522) |
Aggregate household income in Eola-Paint Rock in 2022: $178,454
Median family income in Eola-Paint Rock in 2022:| Eola-Paint Rock: | $97,729 |
| Texas: | $72,369 |
Median per capita income in Eola-Paint Rock in 2022:| Eola-Paint Rock: | $14,582 |
| State: | $28,166 |
Change in median per capita income between 2000 and 2022:| Eola-Paint Rock, Texas: | +95.5% |
| Texas: | +77.2% |
Income statistics for Multirace residents
Median household income in Eola-Paint Rock, TX in 2022:| Eola-Paint Rock: | $35,464 |
| State: | $62,748 |
Change in median household income between 2000 and 2022:| Eola-Paint Rock, Texas: | +97.9% |
| Texas: | +92.3% |
Number of households with income < $10k:| Eola-Paint Rock: | 5.5% (33,550) |
| Texas: | 5.5% (122,324) |
Number of households with income $10k - 20k:| Eola-Paint Rock: | 8.2% (49,982) |
| State: | 8.2% (182,232) |
Number of households with income $20k - 30k:| Eola-Paint Rock: | 8.5% (51,910) |
| State: | 8.5% (189,456) |
Number of households with income $30k - 40k:| Eola-Paint Rock: | 8.9% (54,155) |
| State: | 8.9% (197,499) |
Number of households with income $40k - 50k:| Eola-Paint Rock: | 8.7% (52,602) |
| State: | 8.7% (191,735) |
Number of households with income $50k - 60k:| Eola-Paint Rock: | 8.0% (48,652) |
| State: | 8.0% (177,535) |
Number of households with income $60k - 75k:| Eola-Paint Rock: | 10.5% (63,769) |
| State: | 10.5% (232,479) |
Number of households with income $75k - 100k:| Eola-Paint Rock: | 13.1% (79,644) |
| State: | 13.1% (290,448) |
Number of households with income $100k - 125k:| Eola-Paint Rock: | 8.7% (52,561) |
| State: | 8.6% (191,595) |
Number of households with income $125k - 150k:| Eola-Paint Rock: | 6.0% (36,610) |
| State: | 6.0% (133,361) |
Number of households with income $150k - 200k:| Eola-Paint Rock: | 7.2% (43,604) |
| State: | 7.2% (159,195) |
Number of households with income > $200k:| Eola-Paint Rock: | 6.7% (40,598) |
| State: | 6.7% (148,064) |
Aggregate household income in Eola-Paint Rock in 2022: $7,265,057
Median family income in Eola-Paint Rock in 2022:| Eola-Paint Rock: | $36,115 |
| State: | $69,780 |
Number of families with income < $10k:| Eola-Paint Rock: | 22.7% (14) |
| Texas: | 4.4% (70,825) |
Number of families with income $10k - 20k:| Eola-Paint Rock: | 29.6% (18) |
| State: | 5.9% (95,279) |
Number of families with income $75k - 100k:| Eola-Paint Rock: | 47.7% (28) |
| Texas: | 14.0% (226,284) |
Median non-family income in Eola-Paint Rock in 2022:| Eola-Paint Rock: | $7,243 |
| State: | $40,634 |
Change in median non-family income between 2000 and 2022:| Eola-Paint Rock, Texas: | +93.2% |
| Texas: | +77.2% |
Median per capita income in Eola-Paint Rock in 2022:| Eola-Paint Rock: | $22,209 |
| Texas: | $26,785 |
Change in median per capita income between 2000 and 2022:| Eola-Paint Rock, Texas: | +108.4% |
| State: | +110.9% |
Income statistics for other residents
Number of households with income < $10k:| Eola-Paint Rock: | 5.9% (12) |
| State: | 5.9% (54,162) |
Number of households with income $10k - 20k:| Eola-Paint Rock: | 6.9% (14) |
| State: | 6.8% (62,891) |
Number of households with income $20k - 30k:| Eola-Paint Rock: | 10.8% (22) |
| State: | 10.6% (97,294) |
Number of households with income $30k - 40k:| Eola-Paint Rock: | 10.8% (22) |
| State: | 10.8% (99,670) |
Number of households with income $40k - 50k:| Eola-Paint Rock: | 9.3% (19) |
| State: | 9.3% (85,548) |
Number of households with income $50k - 60k:| Eola-Paint Rock: | 8.8% (18) |
| State: | 9.0% (82,757) |
Number of households with income $60k - 75k:| Eola-Paint Rock: | 10.8% (22) |
| State: | 10.9% (100,326) |
Number of households with income $75k - 100k:| Eola-Paint Rock: | 14.2% (29) |
| Texas: | 14.0% (128,767) |
Number of households with income $100k - 125k:| Eola-Paint Rock: | 8.3% (17) |
| Texas: | 8.2% (75,218) |
Number of households with income $125k - 150k:| Eola-Paint Rock: | 4.9% (10) |
| Texas: | 4.8% (44,223) |
Number of households with income $150k - 200k:| Eola-Paint Rock: | 5.4% (11) |
| State: | 5.6% (51,376) |
Number of households with income > $200k:| Eola-Paint Rock: | 3.9% (8) |
| State: | 4.0% (36,393) |
Aggregate household income in Eola-Paint Rock in 2022: $14,966,682
Median family income in Eola-Paint Rock in 2022:| Eola-Paint Rock: | $61,305 |
| State: | $60,064 |
Number of families with income < $10k:| Eola-Paint Rock: | 6.8% (2) |
| State: | 6.8% (47,502) |
Number of families with income $10k - 20k:| Eola-Paint Rock: | 9.4% (2) |
| Texas: | 6.0% (41,763) |
Number of families with income $20k - 30k:| Eola-Paint Rock: | 30.8% (7) |
| State: | 9.9% (68,761) |
Number of families with income $30k - 40k:| Eola-Paint Rock: | 19.0% (4) |
| State: | 9.7% (67,685) |
Number of families with income $40k - 50k:| Eola-Paint Rock: | 15.6% (4) |
| State: | 9.0% (62,441) |
Number of families with income $60k - 75k:| Eola-Paint Rock: | 18.5% (4) |
| State: | 11.2% (77,588) |
Median non-family income in Eola-Paint Rock in 2022:| Eola-Paint Rock: | $22,393 |
| Texas: | $38,690 |
Change in median non-family income between 2000 and 2022:| Eola-Paint Rock, Texas: | +123.9% |
| State: | +90.2% |
Median per capita income in Eola-Paint Rock in 2022:| Eola-Paint Rock: | $19,483 |
| State: | $23,899 |
Change in median per capita income between 2000 and 2022:| Eola-Paint Rock, Texas: | +141.8% |
| Texas: | +135.2% |