Falls Village, Connecticut (CT) income map, earnings map, and wages data

Data:
The per capita income in 2022 was $44,501, which means an increase of 36.2% compared to 2000 when it was $28,408.
Whole page based on the data from 2000 / 2022 when the population of Falls Village, Connecticut was 538 / 475
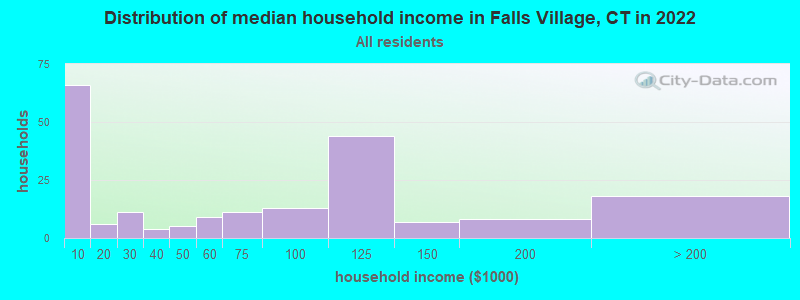
Income statistics for all residents
Number of households with income < $10k:| Falls Village: | 32.7% (66) |
| State: | 5.1% (72,746) |
Number of households with income $10k - 20k:| Falls Village: | 3.0% (6) |
| State: | 5.7% (81,643) |
Number of households with income $20k - 30k:| Falls Village: | 5.4% (11) |
| Connecticut: | 6.5% (92,844) |
Number of households with income $30k - 40k:| Falls Village: | 2.0% (4) |
| State: | 5.9% (83,934) |
Number of households with income $40k - 50k:| Falls Village: | 2.5% (5) |
| Connecticut: | 5.8% (83,025) |
Number of households with income $50k - 60k:| Falls Village: | 4.5% (9) |
| State: | 5.7% (81,788) |
Number of households with income $60k - 75k:| Falls Village: | 5.4% (11) |
| State: | 8.1% (115,651) |
Number of households with income $75k - 100k:| Falls Village: | 6.4% (13) |
| State: | 12.6% (180,173) |
Number of households with income $100k - 125k:| Falls Village: | 21.8% (44) |
| State: | 9.9% (141,231) |
Number of households with income $125k - 150k:| Falls Village: | 3.5% (7) |
| Connecticut: | 7.9% (112,826) |
Number of households with income $150k - 200k:| Falls Village: | 4.0% (8) |
| State: | 10.8% (154,641) |
Number of households with income > $200k:| Falls Village: | 8.9% (18) |
| State: | 16.3% (233,133) |
Aggregate household income in Falls Village in 2022: $18,819,089
Median non-family income in Falls Village in 2022:| Falls Village: | $60,631 |
| Connecticut: | $50,964 |
Change in median non-family income between 2000 and 2022:| Falls Village, Connecticut: | +103.3% |
| State: | +65.1% |
Median per capita income in Falls Village in 2022:| Falls Village: | $44,501 |
| State: | $51,581 |
Change in median per capita income between 2000 and 2022:| Falls Village, Connecticut: | +56.7% |
| State: | +79.3% |
Income statistics for White residents
Number of households with income < $10k:| Falls Village: | 33.7% (64) |
| Connecticut: | 4.2% (42,265) |
Number of households with income $10k - 20k:| Falls Village: | 3.2% (6) |
| State: | 4.8% (48,323) |
Number of households with income $20k - 30k:| Falls Village: | 4.7% (9) |
| State: | 5.7% (57,716) |
Number of households with income $30k - 40k:| Falls Village: | 2.1% (4) |
| State: | 5.3% (53,827) |
Number of households with income $40k - 50k:| Falls Village: | 2.1% (4) |
| Connecticut: | 5.3% (53,301) |
Number of households with income $50k - 60k:| Falls Village: | 4.7% (9) |
| State: | 5.5% (55,690) |
Number of households with income $60k - 75k:| Falls Village: | 5.8% (11) |
| State: | 8.0% (80,329) |
Number of households with income $75k - 100k:| Falls Village: | 6.3% (12) |
| State: | 12.7% (128,070) |
Number of households with income $100k - 125k:| Falls Village: | 21.6% (41) |
| State: | 10.0% (101,210) |
Number of households with income $125k - 150k:| Falls Village: | 3.7% (7) |
| State: | 8.0% (81,250) |
Number of households with income $150k - 200k:| Falls Village: | 3.2% (6) |
| Connecticut: | 11.8% (119,527) |
Number of households with income > $200k:| Falls Village: | 8.9% (17) |
| Connecticut: | 18.6% (187,875) |
Aggregate household income in Falls Village in 2022: $17,442,540
Median non-family income in Falls Village in 2022:| Falls Village: | $58,939 |
| Connecticut: | $54,067 |
Change in median non-family income between 2000 and 2022:| Falls Village, Connecticut: | +97.9% |
| State: | +68.7% |
Median per capita income in Falls Village in 2022:| Falls Village: | $41,521 |
| Connecticut: | $59,916 |
Change in median per capita income between 2000 and 2022:| Falls Village, Connecticut: | +44.3% |
| State: | +90.2% |
Income statistics for Hispanic or Latino residents
Median per capita income in Falls Village in 2022:| Falls Village: | $50,559 |
| State: | $28,507 |
Income statistics for Multirace residents
Aggregate household income in Falls Village in 2022: $495,181,272
Median per capita income in Falls Village in 2022:| Falls Village: | $109,509 |
| Connecticut: | $32,794 |