Fallsburg, New York (NY) income map, earnings map, and wages data
The median household income in Fallsburg, NY in 2022 was $56,947, which was 39.7% less than the median annual income of $79,557 across the entire state of New York. Compared to the median income of $33,036 in 2000 this represents an increase of 42.0%. The per capita income in 2022 was $38,528, which means an increase of 56.5% compared to 2000 when it was $16,744.
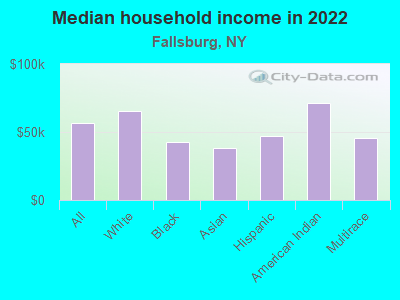
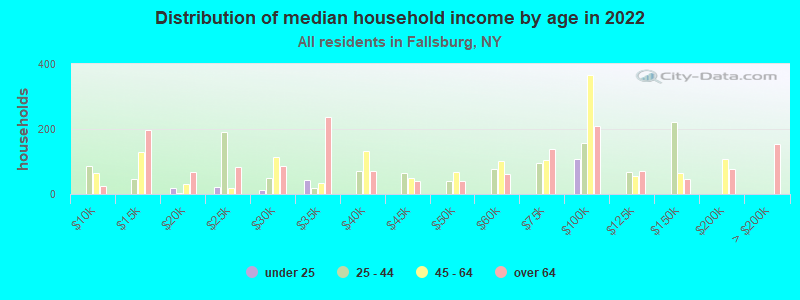
Income statistics for all residents
Median household income in Fallsburg, NY in 2022:| Fallsburg: | $56,947 |
| State: | $79,557 |
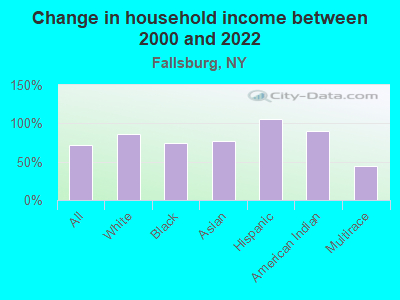
Change in median household income between 2000 and 2022:| Fallsburg, New York: | +72.4% |
| State: | +83.3% |
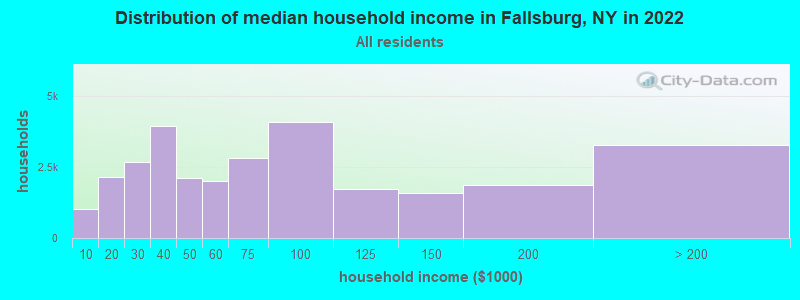
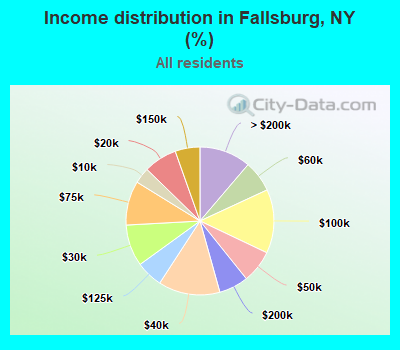
Number of households with income < $10k:| Fallsburg: | 3.5% (1,017) |
| State: | 6.8% (527,598) |
Number of households with income $10k - 20k:| Fallsburg: | 7.3% (2,136) |
| State: | 7.4% (574,940) |
Number of households with income $20k - 30k:| Fallsburg: | 9.1% (2,665) |
| New York: | 6.7% (517,718) |
Number of households with income $30k - 40k:| Fallsburg: | 13.5% (3,947) |
| State: | 6.5% (506,674) |
Number of households with income $40k - 50k:| Fallsburg: | 7.2% (2,097) |
| State: | 6.1% (470,439) |
Number of households with income $50k - 60k:| Fallsburg: | 6.9% (2,005) |
| New York: | 5.8% (454,042) |
Number of households with income $60k - 75k:| Fallsburg: | 9.7% (2,830) |
| State: | 8.5% (657,508) |
Number of households with income $75k - 100k:| Fallsburg: | 14.0% (4,085) |
| State: | 11.6% (899,824) |
Number of households with income $100k - 125k:| Fallsburg: | 5.9% (1,714) |
| State: | 9.3% (723,825) |
Number of households with income $125k - 150k:| Fallsburg: | 5.4% (1,583) |
| New York: | 7.1% (552,420) |
Number of households with income $150k - 200k:| Fallsburg: | 6.4% (1,880) |
| State: | 9.4% (727,051) |
Number of households with income > $200k:| Fallsburg: | 11.3% (3,292) |
| State: | 15.0% (1,162,269) |
Aggregate household income in Fallsburg in 2022: $424,853,583
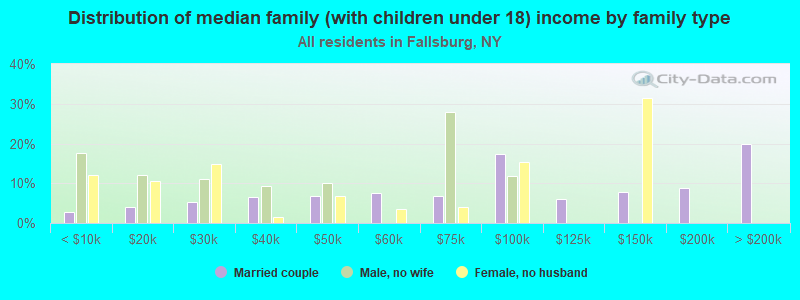
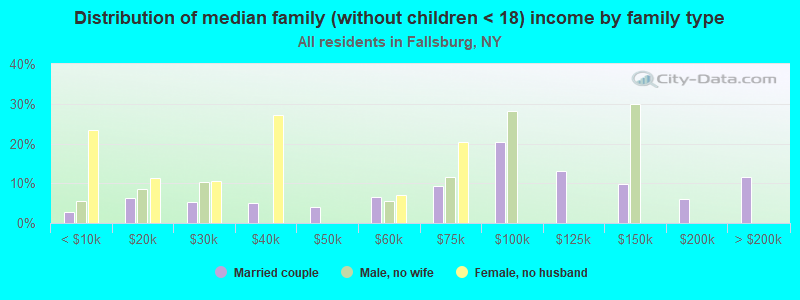
Median family income in Fallsburg in 2022:| Fallsburg: | $78,098 |
| State: | $99,066 |
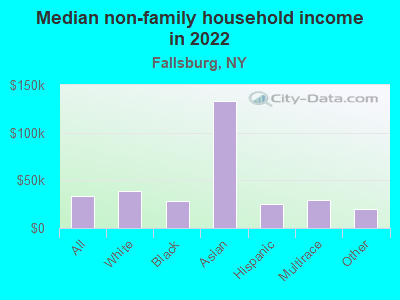
Median non-family income in Fallsburg in 2022:| Fallsburg: | $33,472 |
| New York: | $50,181 |
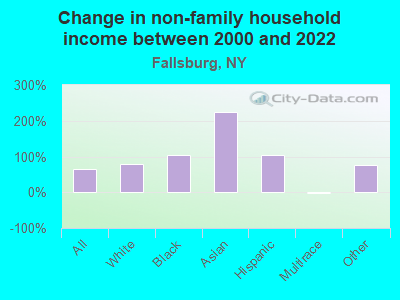
Change in median non-family income between 2000 and 2022:| Fallsburg, New York: | +66.4% |
| New York: | +85.4% |
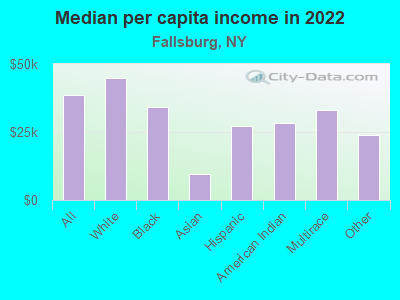
Median per capita income in Fallsburg in 2022:| Fallsburg: | $38,528 |
| State: | $47,421 |
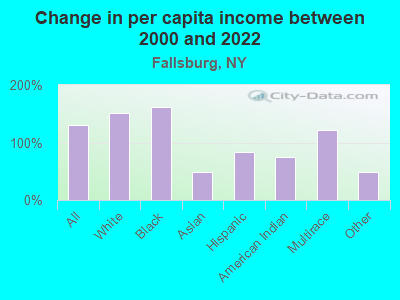
Change in median per capita income between 2000 and 2022:| Fallsburg, New York: | +130.1% |
| New York: | +102.7% |
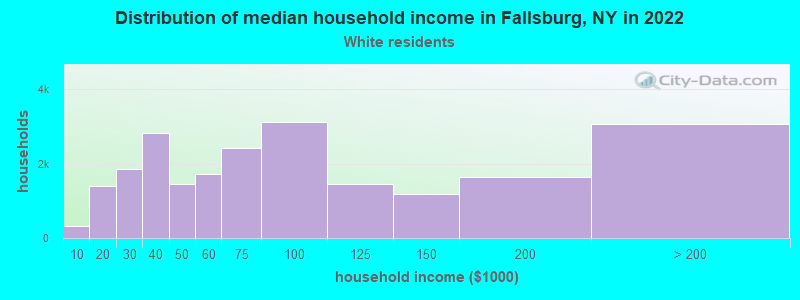
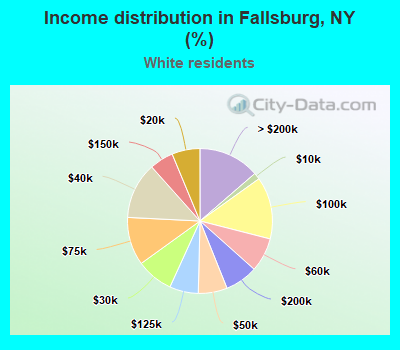
Income statistics for White residents
Median household income in Fallsburg, NY in 2022:| Fallsburg: | $65,258 |
| State: | $89,408 |
Change in median household income between 2000 and 2022:| Fallsburg, New York: | +86.1% |
| State: | +85.5% |
Number of households with income < $10k:| Fallsburg: | 1.5% (327) |
| New York: | 4.8% (225,550) |
Number of households with income $10k - 20k:| Fallsburg: | 6.3% (1,409) |
| New York: | 6.1% (289,425) |
Number of households with income $20k - 30k:| Fallsburg: | 8.2% (1,854) |
| New York: | 5.9% (280,254) |
Number of households with income $30k - 40k:| Fallsburg: | 12.6% (2,836) |
| State: | 6.1% (288,263) |
Number of households with income $40k - 50k:| Fallsburg: | 6.5% (1,451) |
| State: | 5.9% (278,079) |
Number of households with income $50k - 60k:| Fallsburg: | 7.6% (1,714) |
| State: | 5.7% (267,554) |
Number of households with income $60k - 75k:| Fallsburg: | 10.7% (2,414) |
| State: | 8.4% (398,344) |
Number of households with income $75k - 100k:| Fallsburg: | 13.9% (3,120) |
| New York: | 11.8% (554,841) |
Number of households with income $100k - 125k:| Fallsburg: | 6.4% (1,449) |
| State: | 10.0% (469,794) |
Number of households with income $125k - 150k:| Fallsburg: | 5.3% (1,196) |
| State: | 7.6% (360,467) |
Number of households with income $150k - 200k:| Fallsburg: | 7.3% (1,645) |
| New York: | 10.1% (477,078) |
Number of households with income > $200k:| Fallsburg: | 13.7% (3,071) |
| New York: | 17.6% (829,233) |
Aggregate household income in Fallsburg in 2022: $336,796,831
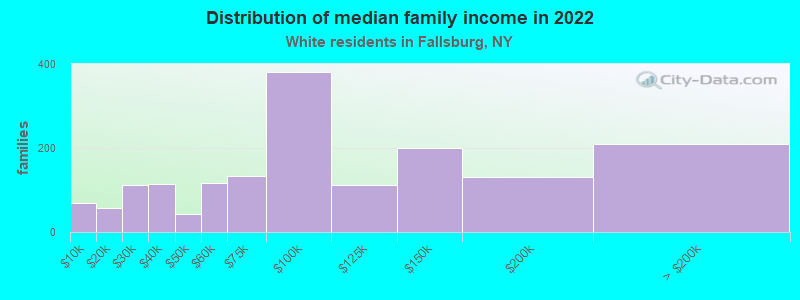
Median family income in Fallsburg in 2022:| Fallsburg: | $87,174 |
| State: | $115,170 |
Number of families with income < $10k:| Fallsburg: | 4.1% (69) |
| State: | 2.5% (68,851) |
Number of families with income $10k - 20k:| Fallsburg: | 3.4% (57) |
| New York: | 3.0% (83,127) |
Number of families with income $20k - 30k:| Fallsburg: | 6.7% (113) |
| State: | 3.5% (97,578) |
Number of families with income $30k - 40k:| Fallsburg: | 6.8% (115) |
| State: | 4.1% (114,108) |
Number of families with income $40k - 50k:| Fallsburg: | 2.6% (43) |
| State: | 4.7% (130,902) |
Number of families with income $50k - 60k:| Fallsburg: | 7.0% (117) |
| State: | 4.9% (135,118) |
Number of families with income $60k - 75k:| Fallsburg: | 8.0% (134) |
| State: | 7.8% (216,254) |
Number of families with income $75k - 100k:| Fallsburg: | 22.6% (380) |
| New York: | 12.4% (342,382) |
Number of families with income $100k - 125k:| Fallsburg: | 6.7% (112) |
| State: | 11.4% (314,917) |
Number of families with income $125k - 150k:| Fallsburg: | 12.0% (201) |
| New York: | 9.4% (260,489) |
Number of families with income $150k - 200k:| Fallsburg: | 7.8% (132) |
| State: | 13.2% (365,586) |
Number of families with income > $200k:| Fallsburg: | 12.5% (210) |
| New York: | 23.2% (642,319) |
Median non-family income in Fallsburg in 2022:| Fallsburg: | $38,430 |
| State: | $54,783 |
Change in median non-family income between 2000 and 2022:| Fallsburg, New York: | +78.4% |
| State: | +87.9% |
Median per capita income in Fallsburg in 2022:| Fallsburg: | $44,716 |
| State: | $57,640 |
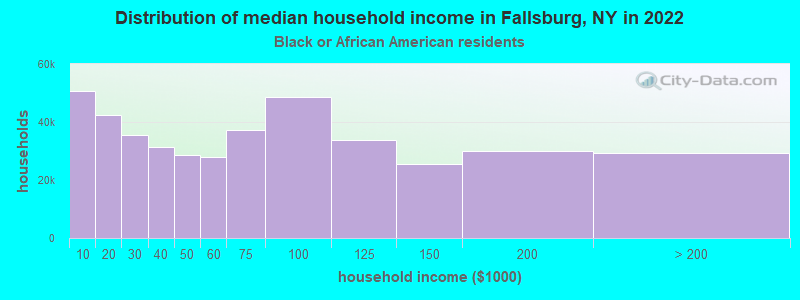
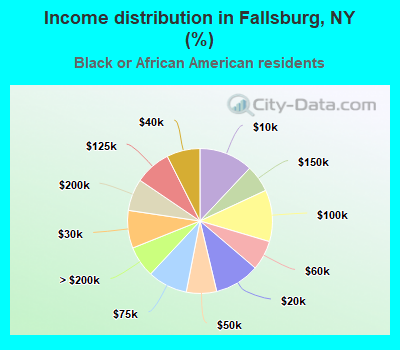
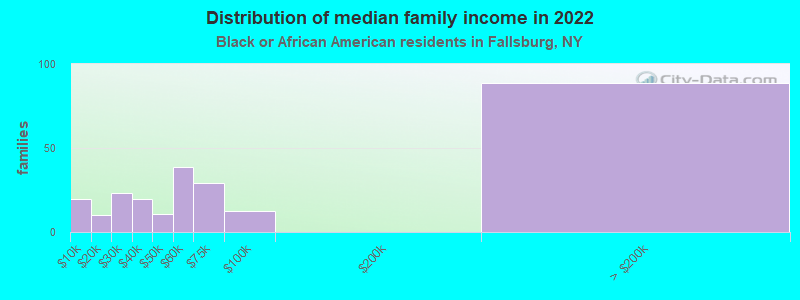
Income statistics for Black or African American residents
Median household income in Fallsburg, NY in 2022:| Fallsburg: | $42,805 |
| State: | $57,898 |
Change in median household income between 2000 and 2022:| Fallsburg, New York: | +73.6% |
| State: | +84.6% |
Number of households with income < $10k:| Fallsburg: | 12.0% (50,555) |
| New York: | 12.0% (128,500) |
Number of households with income $10k - 20k:| Fallsburg: | 10.0% (42,267) |
| State: | 10.0% (107,541) |
Number of households with income $20k - 30k:| Fallsburg: | 8.4% (35,473) |
| State: | 8.4% (90,192) |
Number of households with income $30k - 40k:| Fallsburg: | 7.4% (31,264) |
| New York: | 7.4% (79,579) |
Number of households with income $40k - 50k:| Fallsburg: | 6.8% (28,508) |
| State: | 6.8% (72,491) |
Number of households with income $50k - 60k:| Fallsburg: | 6.6% (27,959) |
| New York: | 6.7% (71,309) |
Number of households with income $60k - 75k:| Fallsburg: | 8.9% (37,378) |
| State: | 8.9% (95,050) |
Number of households with income $75k - 100k:| Fallsburg: | 11.5% (48,498) |
| State: | 11.5% (123,569) |
Number of households with income $100k - 125k:| Fallsburg: | 8.1% (33,952) |
| State: | 8.1% (86,632) |
Number of households with income $125k - 150k:| Fallsburg: | 6.1% (25,472) |
| State: | 6.0% (64,788) |
Number of households with income $150k - 200k:| Fallsburg: | 7.1% (30,056) |
| New York: | 7.2% (76,644) |
Number of households with income > $200k:| Fallsburg: | 7.0% (29,352) |
| State: | 7.0% (75,062) |
Aggregate household income in Fallsburg in 2022: $19,808,481
Median family income in Fallsburg in 2022:| Fallsburg: | $63,780 |
| State: | $72,528 |
Number of families with income < $10k:| Fallsburg: | 7.8% (20) |
| State: | 8.6% (54,100) |
Number of families with income $10k - 20k:| Fallsburg: | 4.1% (10) |
| State: | 6.6% (41,506) |
Number of families with income $20k - 30k:| Fallsburg: | 9.3% (23) |
| New York: | 7.0% (44,139) |
Number of families with income $30k - 40k:| Fallsburg: | 7.7% (19) |
| New York: | 6.9% (43,353) |
Number of families with income $40k - 50k:| Fallsburg: | 4.3% (11) |
| New York: | 6.6% (41,419) |
Number of families with income $50k - 60k:| Fallsburg: | 15.2% (38) |
| New York: | 6.3% (39,748) |
Number of families with income $60k - 75k:| Fallsburg: | 11.5% (29) |
| New York: | 9.2% (57,626) |
Number of families with income $75k - 100k:| Fallsburg: | 4.9% (12) |
| New York: | 12.6% (78,986) |
Number of families with income > $200k:| Fallsburg: | 35.2% (89) |
| State: | 9.3% (58,575) |
Median non-family income in Fallsburg in 2022:| Fallsburg: | $27,836 |
| State: | $37,265 |
Change in median non-family income between 2000 and 2022:| Fallsburg, New York: | +104.6% |
| State: | +81.7% |
Median per capita income in Fallsburg in 2022:| Fallsburg: | $34,370 |
| State: | $31,947 |
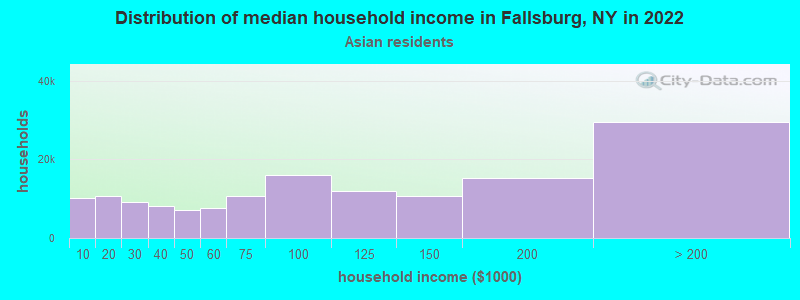
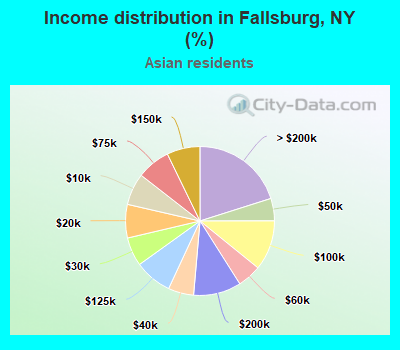
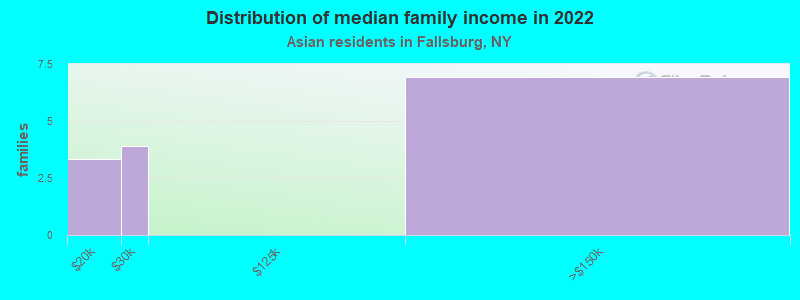
Income statistics for Asian residents
Median household income in Fallsburg, NY in 2022:| Fallsburg: | $38,412 |
| State: | $89,947 |
Change in median household income between 2000 and 2022:| Fallsburg, New York: | +77.3% |
| New York: | +98.1% |
Number of households with income < $10k:| Fallsburg: | 6.9% (10,149) |
| State: | 6.9% (42,537) |
Number of households with income $10k - 20k:| Fallsburg: | 7.3% (10,678) |
| State: | 7.3% (44,745) |
Number of households with income $20k - 30k:| Fallsburg: | 6.2% (9,144) |
| State: | 6.2% (38,249) |
Number of households with income $30k - 40k:| Fallsburg: | 5.5% (8,111) |
| State: | 5.5% (33,993) |
Number of households with income $40k - 50k:| Fallsburg: | 4.9% (7,119) |
| State: | 4.8% (29,795) |
Number of households with income $50k - 60k:| Fallsburg: | 5.2% (7,614) |
| State: | 5.2% (32,100) |
Number of households with income $60k - 75k:| Fallsburg: | 7.3% (10,639) |
| State: | 7.3% (44,615) |
Number of households with income $75k - 100k:| Fallsburg: | 10.9% (15,908) |
| State: | 10.8% (66,687) |
Number of households with income $100k - 125k:| Fallsburg: | 8.2% (11,952) |
| New York: | 8.2% (50,233) |
Number of households with income $125k - 150k:| Fallsburg: | 7.2% (10,561) |
| State: | 7.2% (44,299) |
Number of households with income $150k - 200k:| Fallsburg: | 10.4% (15,194) |
| State: | 10.4% (63,837) |
Number of households with income > $200k:| Fallsburg: | 20.1% (29,487) |
| New York: | 20.1% (123,891) |
Aggregate household income in Fallsburg in 2022: $2,328,038
Median family income in Fallsburg in 2022:| Fallsburg: | $17,194 |
| State: | $98,136 |
Number of families with income $10k - 20k:| Fallsburg: | 23.6% (3) |
| State: | 5.2% (22,725) |
Number of families with income $20k - 30k:| Fallsburg: | 27.5% (4) |
| State: | 6.4% (27,990) |
Number of families with income $125k - 150k:| Fallsburg: | 48.9% (7) |
| New York: | 7.3% (31,893) |
Median non-family income in Fallsburg in 2022:| Fallsburg: | $133,516 |
| State: | $63,573 |
Median per capita income in Fallsburg in 2022:| Fallsburg: | $9,603 |
| State: | $46,726 |
Change in median per capita income between 2000 and 2022:| Fallsburg, New York: | +47.7% |
| State: | +126.6% |
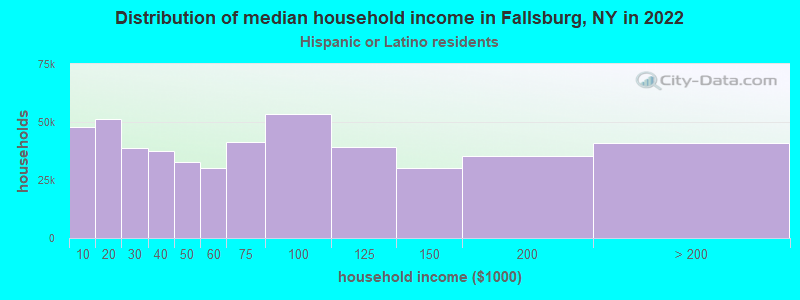
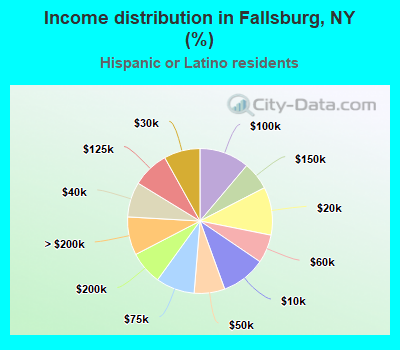
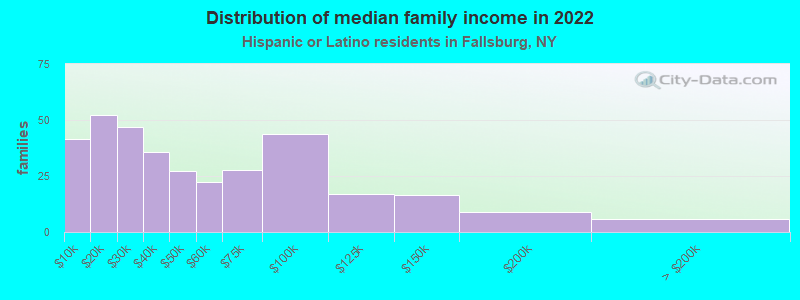
Income statistics for Hispanic or Latino residents
Median household income in Fallsburg, NY in 2022:| Fallsburg: | $47,030 |
| New York: | $60,468 |
Change in median household income between 2000 and 2022:| Fallsburg, New York: | +105.5% |
| State: | +98.3% |
Number of households with income < $10k:| Fallsburg: | 10.0% (47,686) |
| New York: | 9.9% (127,185) |
Number of households with income $10k - 20k:| Fallsburg: | 10.7% (51,331) |
| State: | 10.7% (136,699) |
Number of households with income $20k - 30k:| Fallsburg: | 8.1% (38,653) |
| New York: | 8.1% (102,991) |
Number of households with income $30k - 40k:| Fallsburg: | 7.8% (37,440) |
| New York: | 7.8% (100,149) |
Number of households with income $40k - 50k:| Fallsburg: | 6.8% (32,757) |
| State: | 6.9% (87,760) |
Number of households with income $50k - 60k:| Fallsburg: | 6.3% (30,333) |
| State: | 6.3% (80,968) |
Number of households with income $60k - 75k:| Fallsburg: | 8.6% (41,345) |
| State: | 8.7% (110,631) |
Number of households with income $75k - 100k:| Fallsburg: | 11.2% (53,367) |
| State: | 11.2% (142,787) |
Number of households with income $100k - 125k:| Fallsburg: | 8.2% (39,107) |
| State: | 8.2% (104,850) |
Number of households with income $125k - 150k:| Fallsburg: | 6.3% (30,005) |
| State: | 6.3% (80,274) |
Number of households with income $150k - 200k:| Fallsburg: | 7.4% (35,471) |
| State: | 7.4% (95,117) |
Number of households with income > $200k:| Fallsburg: | 8.6% (40,908) |
| New York: | 8.6% (109,514) |
Aggregate household income in Fallsburg in 2022: $83,514,705
Median family income in Fallsburg in 2022:| Fallsburg: | $69,853 |
| State: | $68,770 |
Number of families with income < $10k:| Fallsburg: | 12.0% (42) |
| New York: | 6.9% (58,565) |
Number of families with income $10k - 20k:| Fallsburg: | 15.1% (52) |
| New York: | 7.0% (59,058) |
Number of families with income $20k - 30k:| Fallsburg: | 13.5% (47) |
| State: | 8.0% (68,048) |
Number of families with income $30k - 40k:| Fallsburg: | 10.3% (36) |
| State: | 8.4% (70,668) |
Number of families with income $40k - 50k:| Fallsburg: | 7.9% (27) |
| State: | 7.4% (62,941) |
Number of families with income $50k - 60k:| Fallsburg: | 6.5% (22) |
| New York: | 6.6% (55,592) |
Number of families with income $60k - 75k:| Fallsburg: | 8.1% (28) |
| New York: | 9.3% (78,564) |
Number of families with income $75k - 100k:| Fallsburg: | 12.6% (44) |
| State: | 12.6% (106,685) |
Number of families with income $100k - 125k:| Fallsburg: | 5.0% (17) |
| State: | 9.4% (79,139) |
Number of families with income $125k - 150k:| Fallsburg: | 4.7% (16) |
| New York: | 6.9% (58,255) |
Number of families with income $150k - 200k:| Fallsburg: | 2.6% (9) |
| State: | 8.3% (69,877) |
Number of families with income > $200k:| Fallsburg: | 1.7% (6) |
| New York: | 9.3% (78,555) |
Median non-family income in Fallsburg in 2022:| Fallsburg: | $25,178 |
| New York: | $34,000 |
Change in median non-family income between 2000 and 2022:| Fallsburg, New York: | +103.0% |
| State: | +93.9% |
Median per capita income in Fallsburg in 2022:| Fallsburg: | $27,376 |
| New York: | $29,761 |
Change in median per capita income between 2000 and 2022:| Fallsburg, New York: | +84.1% |
| State: | +132.7% |
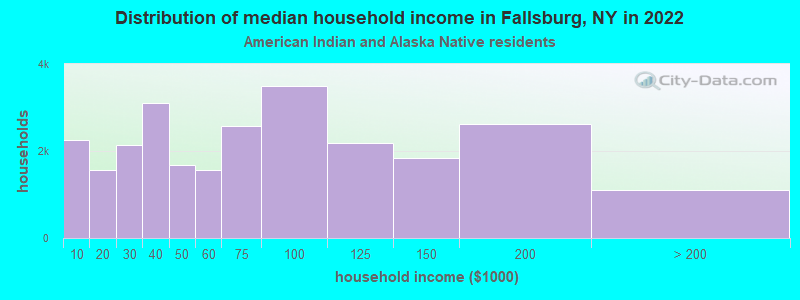
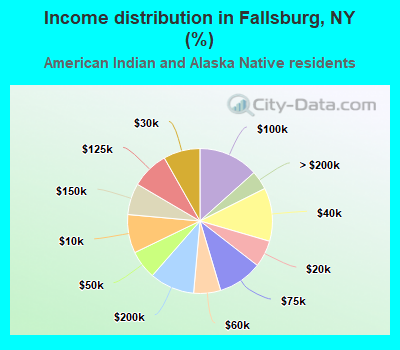
Income statistics for American Indian and Alaska Native residents
Median household income in Fallsburg, NY in 2022:| Fallsburg: | $71,647 |
| New York: | $63,208 |
Change in median household income between 2000 and 2022:| Fallsburg, New York: | +90.5% |
| State: | +110.1% |
Number of households with income < $10k:| Fallsburg: | 8.6% (2,246) |
| State: | 8.6% (3,559) |
Number of households with income $10k - 20k:| Fallsburg: | 6.0% (1,560) |
| State: | 5.9% (2,455) |
Number of households with income $20k - 30k:| Fallsburg: | 8.2% (2,133) |
| New York: | 8.2% (3,393) |
Number of households with income $30k - 40k:| Fallsburg: | 11.9% (3,105) |
| State: | 11.9% (4,918) |
Number of households with income $40k - 50k:| Fallsburg: | 6.4% (1,668) |
| State: | 6.5% (2,682) |
Number of households with income $50k - 60k:| Fallsburg: | 6.0% (1,570) |
| New York: | 6.1% (2,516) |
Number of households with income $60k - 75k:| Fallsburg: | 9.9% (2,580) |
| State: | 10.0% (4,125) |
Number of households with income $75k - 100k:| Fallsburg: | 13.4% (3,489) |
| State: | 13.3% (5,517) |
Number of households with income $100k - 125k:| Fallsburg: | 8.4% (2,178) |
| State: | 8.4% (3,463) |
Number of households with income $125k - 150k:| Fallsburg: | 7.0% (1,831) |
| State: | 7.0% (2,887) |
Number of households with income $150k - 200k:| Fallsburg: | 10.0% (2,610) |
| State: | 9.9% (4,106) |
Number of households with income > $200k:| Fallsburg: | 4.2% (1,102) |
| State: | 4.2% (1,744) |
Aggregate household income in Fallsburg in 2022: $2,885,928
Median per capita income in Fallsburg in 2022:| Fallsburg: | $28,253 |
| New York: | $25,837 |
Change in median per capita income between 2000 and 2022:| Fallsburg, New York: | +75.0% |
| State: | +99.6% |
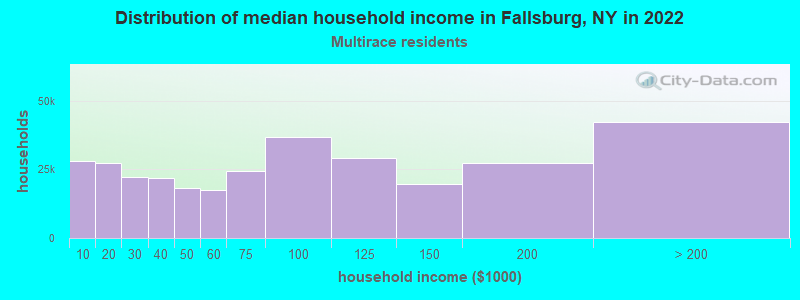
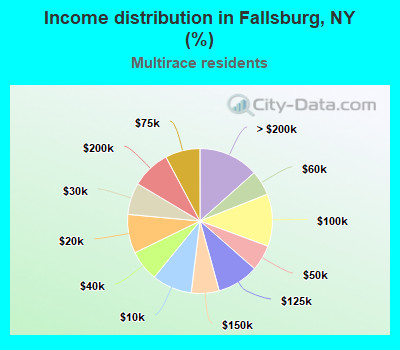
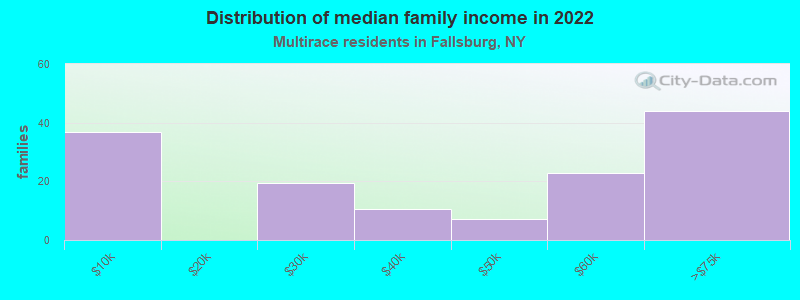
Income statistics for Multirace residents
Median household income in Fallsburg, NY in 2022:| Fallsburg: | $45,681 |
| New York: | $73,557 |
Change in median household income between 2000 and 2022:| Fallsburg, New York: | +43.7% |
| New York: | +123.9% |
Number of households with income < $10k:| Fallsburg: | 8.9% (28,057) |
| New York: | 8.9% (57,924) |
Number of households with income $10k - 20k:| Fallsburg: | 8.7% (27,363) |
| State: | 8.7% (56,590) |
Number of households with income $20k - 30k:| Fallsburg: | 7.1% (22,366) |
| New York: | 7.1% (46,287) |
Number of households with income $30k - 40k:| Fallsburg: | 6.9% (21,786) |
| New York: | 6.9% (45,132) |
Number of households with income $40k - 50k:| Fallsburg: | 5.8% (18,281) |
| New York: | 5.8% (37,946) |
Number of households with income $50k - 60k:| Fallsburg: | 5.6% (17,565) |
| New York: | 5.6% (36,410) |
Number of households with income $60k - 75k:| Fallsburg: | 7.8% (24,501) |
| State: | 7.8% (50,819) |
Number of households with income $75k - 100k:| Fallsburg: | 11.7% (36,715) |
| State: | 11.7% (76,024) |
Number of households with income $100k - 125k:| Fallsburg: | 9.3% (29,217) |
| New York: | 9.3% (60,635) |
Number of households with income $125k - 150k:| Fallsburg: | 6.2% (19,577) |
| State: | 6.2% (40,533) |
Number of households with income $150k - 200k:| Fallsburg: | 8.6% (27,232) |
| State: | 8.6% (56,409) |
Number of households with income > $200k:| Fallsburg: | 13.4% (42,278) |
| State: | 13.4% (87,442) |
Aggregate household income in Fallsburg in 2022: $39,207,304
Median family income in Fallsburg in 2022:| Fallsburg: | $34,650 |
| New York: | $85,788 |
Number of families with income < $10k:| Fallsburg: | 26.2% (37) |
| State: | 6.2% (24,976) |
Number of families with income $20k - 30k:| Fallsburg: | 13.8% (19) |
| New York: | 6.6% (26,534) |
Number of families with income $30k - 40k:| Fallsburg: | 7.6% (11) |
| State: | 6.5% (26,239) |
Number of families with income $40k - 50k:| Fallsburg: | 5.0% (7) |
| State: | 6.1% (24,694) |
Number of families with income $50k - 60k:| Fallsburg: | 16.1% (23) |
| New York: | 5.5% (22,002) |
Number of families with income $60k - 75k:| Fallsburg: | 31.2% (44) |
| State: | 7.6% (30,653) |
Median non-family income in Fallsburg in 2022:| Fallsburg: | $29,159 |
| State: | $46,403 |
Median per capita income in Fallsburg in 2022:| Fallsburg: | $33,065 |
| New York: | $36,931 |
Change in median per capita income between 2000 and 2022:| Fallsburg, New York: | +120.9% |
| State: | +158.8% |
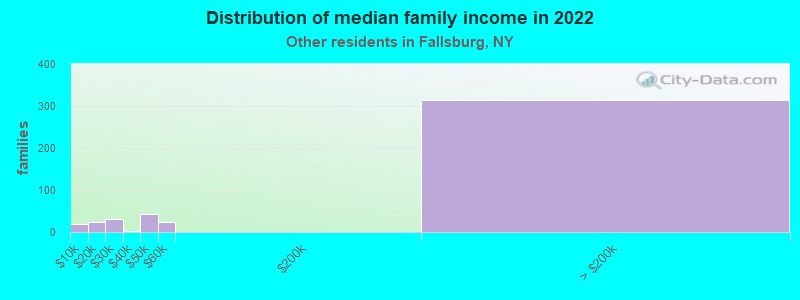
Income statistics for other residents
Number of households with income < $10k:| Fallsburg: | 10.5% (135) |
| State: | 10.3% (69,252) |
Number of households with income $10k - 20k:| Fallsburg: | 10.3% (133) |
| New York: | 11.0% (73,890) |
Number of households with income $20k - 30k:| Fallsburg: | 7.7% (99) |
| State: | 8.8% (59,096) |
Number of households with income $30k - 40k:| Fallsburg: | 7.3% (94) |
| State: | 8.1% (54,418) |
Number of households with income $40k - 50k:| Fallsburg: | 7.5% (96) |
| State: | 7.3% (49,042) |
Number of households with income $50k - 60k:| Fallsburg: | 5.6% (72) |
| State: | 6.5% (43,945) |
Number of households with income $60k - 75k:| Fallsburg: | 9.2% (118) |
| State: | 9.5% (64,087) |
Number of households with income $75k - 100k:| Fallsburg: | 11.3% (146) |
| State: | 10.9% (73,094) |
Number of households with income $100k - 125k:| Fallsburg: | 8.9% (115) |
| State: | 7.9% (53,055) |
Number of households with income $125k - 150k:| Fallsburg: | 5.4% (69) |
| New York: | 5.9% (39,446) |
Number of households with income $150k - 200k:| Fallsburg: | 9.0% (116) |
| State: | 7.2% (48,653) |
Number of households with income > $200k:| Fallsburg: | 7.3% (94) |
| State: | 6.6% (44,703) |
Aggregate household income in Fallsburg in 2022: $34,338,603
Median family income in Fallsburg in 2022:| Fallsburg: | $56,332 |
| State: | $63,465 |
Number of families with income < $10k:| Fallsburg: | 3.9% (18) |
| New York: | 6.2% (29,008) |
Number of families with income $10k - 20k:| Fallsburg: | 5.0% (23) |
| State: | 7.4% (34,598) |
Number of families with income $20k - 30k:| Fallsburg: | 6.7% (30) |
| State: | 9.2% (43,198) |
Number of families with income $30k - 40k:| Fallsburg: | 0.7% (3) |
| New York: | 9.5% (44,688) |
Number of families with income $40k - 50k:| Fallsburg: | 9.5% (43) |
| State: | 7.8% (36,771) |
Number of families with income $50k - 60k:| Fallsburg: | 5.5% (25) |
| State: | 7.1% (33,324) |
Number of families with income > $200k:| Fallsburg: | 68.8% (315) |
| New York: | 7.2% (33,950) |
Median non-family income in Fallsburg in 2022:| Fallsburg: | $19,627 |
| State: | $26,983 |
Change in median non-family income between 2000 and 2022:| Fallsburg, New York: | +77.3% |
| State: | +66.4% |
Median per capita income in Fallsburg in 2022:| Fallsburg: | $23,753 |
| New York: | $26,975 |
Change in median per capita income between 2000 and 2022:| Fallsburg, New York: | +49.4% |
| State: | +144.6% |