Farmington, Connecticut (CT) income map, earnings map, and wages data
The median household income in Farmington, CT in 2022 was $113,496, which was 22.1% greater than the median annual income of $88,429 across the entire state of Connecticut. Compared to the median income of $67,073 in 2000 this represents an increase of 40.9%. The per capita income in 2022 was $71,529, which means an increase of 45.3% compared to 2000 when it was $39,102.
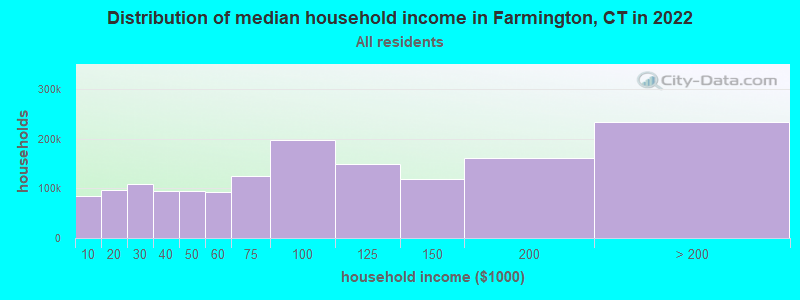
Income statistics for all residents
Median household income in Farmington, CT in 2022:| Farmington: | $113,497 |
| Connecticut: | $88,429 |
Change in median household income between 2000 and 2022:| Farmington, Connecticut: | +69.2% |
| State: | +64.0% |
Number of households with income < $10k:| Farmington: | 5.2% (46,229) |
| Connecticut: | 5.1% (72,746) |
Number of households with income $10k - 20k:| Farmington: | 5.8% (52,130) |
| State: | 5.7% (81,643) |
Number of households with income $20k - 30k:| Farmington: | 6.6% (59,007) |
| State: | 6.5% (92,844) |
Number of households with income $30k - 40k:| Farmington: | 5.9% (52,955) |
| State: | 5.9% (83,934) |
Number of households with income $40k - 50k:| Farmington: | 5.9% (52,615) |
| State: | 5.8% (83,025) |
Number of households with income $50k - 60k:| Farmington: | 5.8% (51,592) |
| State: | 5.7% (81,788) |
Number of households with income $60k - 75k:| Farmington: | 8.1% (72,288) |
| State: | 8.1% (115,651) |
Number of households with income $75k - 100k:| Farmington: | 12.6% (112,897) |
| Connecticut: | 12.6% (180,173) |
Number of households with income $100k - 125k:| Farmington: | 9.8% (87,889) |
| State: | 9.9% (141,231) |
Number of households with income $125k - 150k:| Farmington: | 7.8% (70,188) |
| State: | 7.9% (112,826) |
Number of households with income $150k - 200k:| Farmington: | 10.7% (96,011) |
| State: | 10.8% (154,641) |
Number of households with income > $200k:| Farmington: | 16.0% (143,435) |
| Connecticut: | 16.3% (233,133) |
Aggregate household income in Farmington in 2022: $39,080,592,308
Median family income in Farmington in 2022:| Farmington: | $152,517 |
| State: | $115,183 |
Median non-family income in Farmington in 2022:| Farmington: | $63,722 |
| State: | $50,964 |
Change in median non-family income between 2000 and 2022:| Farmington, Connecticut: | +71.5% |
| State: | +65.1% |
Median per capita income in Farmington in 2022:| Farmington: | $71,529 |
| State: | $51,581 |
Change in median per capita income between 2000 and 2022:| Farmington, Connecticut: | +82.9% |
| State: | +79.3% |
Income statistics for White residents
Median household income in Farmington, CT in 2022:| Farmington: | $113,864 |
| State: | $96,890 |
Change in median household income between 2000 and 2022:| Farmington, Connecticut: | +69.4% |
| Connecticut: | +68.5% |
Number of households with income < $10k:| Farmington: | 4.2% (24,904) |
| Connecticut: | 4.2% (42,265) |
Number of households with income $10k - 20k:| Farmington: | 4.9% (28,632) |
| State: | 4.8% (48,323) |
Number of households with income $20k - 30k:| Farmington: | 5.8% (34,052) |
| State: | 5.7% (57,716) |
Number of households with income $30k - 40k:| Farmington: | 5.4% (31,520) |
| State: | 5.3% (53,827) |
Number of households with income $40k - 50k:| Farmington: | 5.3% (31,389) |
| State: | 5.3% (53,301) |
Number of households with income $50k - 60k:| Farmington: | 5.6% (32,667) |
| State: | 5.5% (55,690) |
Number of households with income $60k - 75k:| Farmington: | 7.9% (46,683) |
| State: | 8.0% (80,329) |
Number of households with income $75k - 100k:| Farmington: | 12.7% (74,803) |
| State: | 12.7% (128,070) |
Number of households with income $100k - 125k:| Farmington: | 10.0% (58,738) |
| Connecticut: | 10.0% (101,210) |
Number of households with income $125k - 150k:| Farmington: | 8.0% (47,157) |
| State: | 8.0% (81,250) |
Number of households with income $150k - 200k:| Farmington: | 11.8% (69,339) |
| Connecticut: | 11.8% (119,527) |
Number of households with income > $200k:| Farmington: | 18.4% (108,548) |
| State: | 18.6% (187,875) |
Aggregate household income in Farmington in 2022: $28,386,630,391
Median family income in Farmington in 2022:| Farmington: | $156,495 |
| State: | $128,955 |
Number of families with income < $10k:| Farmington: | 1.8% (128) |
| State: | 1.9% (11,537) |
Number of families with income $10k - 20k:| Farmington: | 0.9% (65) |
| State: | 1.8% (11,289) |
Number of families with income $20k - 30k:| Farmington: | 1.3% (92) |
| Connecticut: | 3.0% (18,506) |
Number of families with income $30k - 40k:| Farmington: | 2.0% (145) |
| State: | 2.9% (18,160) |
Number of families with income $40k - 50k:| Farmington: | 2.9% (207) |
| State: | 3.9% (24,550) |
Number of families with income $50k - 60k:| Farmington: | 2.1% (148) |
| Connecticut: | 4.3% (26,723) |
Number of families with income $60k - 75k:| Farmington: | 4.6% (326) |
| State: | 7.1% (44,075) |
Number of families with income $75k - 100k:| Farmington: | 8.1% (580) |
| State: | 12.5% (77,679) |
Number of families with income $100k - 125k:| Farmington: | 10.3% (734) |
| State: | 11.1% (69,086) |
Number of families with income $125k - 150k:| Farmington: | 9.2% (658) |
| Connecticut: | 9.6% (59,616) |
Number of families with income $150k - 200k:| Farmington: | 17.5% (1,249) |
| State: | 15.7% (97,890) |
Number of families with income > $200k:| Farmington: | 39.3% (2,811) |
| State: | 26.3% (163,417) |
Median non-family income in Farmington in 2022:| Farmington: | $65,093 |
| State: | $54,067 |
Change in median non-family income between 2000 and 2022:| Farmington, Connecticut: | +73.7% |
| Connecticut: | +68.7% |
Median per capita income in Farmington in 2022:| Farmington: | $76,848 |
| State: | $59,916 |
Change in median per capita income between 2000 and 2022:| Farmington, Connecticut: | +92.1% |
| State: | +90.2% |
Income statistics for Black or African American residents
Median household income in Farmington, CT in 2022:| Farmington: | $92,020 |
| State: | $61,803 |
Change in median household income between 2000 and 2022:| Farmington, Connecticut: | +60.9% |
| State: | +76.1% |
Number of households with income < $10k:| Farmington: | 6.8% (15,467) |
| State: | 6.8% (9,494) |
Number of households with income $10k - 20k:| Farmington: | 7.9% (17,925) |
| Connecticut: | 7.9% (11,003) |
Number of households with income $20k - 30k:| Farmington: | 10.8% (24,510) |
| Connecticut: | 10.8% (15,045) |
Number of households with income $30k - 40k:| Farmington: | 8.2% (18,736) |
| Connecticut: | 8.2% (11,501) |
Number of households with income $40k - 50k:| Farmington: | 7.4% (16,969) |
| State: | 7.4% (10,416) |
Number of households with income $50k - 60k:| Farmington: | 7.5% (17,161) |
| Connecticut: | 7.5% (10,534) |
Number of households with income $60k - 75k:| Farmington: | 8.0% (18,318) |
| State: | 8.0% (11,244) |
Number of households with income $75k - 100k:| Farmington: | 9.6% (21,781) |
| State: | 9.6% (13,370) |
Number of households with income $100k - 125k:| Farmington: | 10.2% (23,205) |
| Connecticut: | 10.2% (14,244) |
Number of households with income $125k - 150k:| Farmington: | 8.0% (18,321) |
| State: | 8.0% (11,246) |
Number of households with income $150k - 200k:| Farmington: | 7.7% (17,475) |
| Connecticut: | 7.7% (10,727) |
Number of households with income > $200k:| Farmington: | 7.9% (18,060) |
| State: | 7.9% (11,086) |
Aggregate household income in Farmington in 2022: $43,289,809
Median family income in Farmington in 2022:| Farmington: | $123,944 |
| State: | $87,228 |
Number of families with income $10k - 20k:| Farmington: | 5.1% (8) |
| State: | 4.8% (4,026) |
Number of families with income $30k - 40k:| Farmington: | 4.6% (7) |
| State: | 7.7% (6,445) |
Number of families with income $50k - 60k:| Farmington: | 3.8% (6) |
| State: | 5.4% (4,480) |
Number of families with income $75k - 100k:| Farmington: | 16.2% (26) |
| State: | 12.7% (10,598) |
Number of families with income $150k - 200k:| Farmington: | 36.3% (57) |
| Connecticut: | 11.4% (9,497) |
Number of families with income > $200k:| Farmington: | 34.1% (54) |
| State: | 10.8% (9,057) |
Median non-family income in Farmington in 2022:| Farmington: | $193,481 |
| State: | $38,608 |
Change in median non-family income between 2000 and 2022:| Farmington, Connecticut: | +77.0% |
| State: | +77.0% |
Median per capita income in Farmington in 2022:| Farmington: | $55,929 |
| State: | $36,289 |
Change in median per capita income between 2000 and 2022:| Farmington, Connecticut: | +115.2% |
| State: | +117.5% |
Income statistics for Asian residents
Median household income in Farmington, CT in 2022:| Farmington: | $137,639 |
| State: | $110,568 |
Change in median household income between 2000 and 2022:| Farmington, Connecticut: | +110.1% |
| Connecticut: | +79.5% |
Number of households with income < $10k:| Farmington: | 7.1% (4,516) |
| Connecticut: | 7.1% (4,245) |
Number of households with income $10k - 20k:| Farmington: | 3.5% (2,221) |
| State: | 3.5% (2,087) |
Number of households with income $20k - 30k:| Farmington: | 4.1% (2,621) |
| Connecticut: | 4.1% (2,464) |
Number of households with income $30k - 40k:| Farmington: | 4.1% (2,636) |
| State: | 4.1% (2,478) |
Number of households with income $40k - 50k:| Farmington: | 3.3% (2,110) |
| State: | 3.3% (1,983) |
Number of households with income $50k - 60k:| Farmington: | 3.9% (2,476) |
| State: | 3.9% (2,328) |
Number of households with income $60k - 75k:| Farmington: | 7.0% (4,498) |
| State: | 7.0% (4,228) |
Number of households with income $75k - 100k:| Farmington: | 11.5% (7,352) |
| State: | 11.5% (6,911) |
Number of households with income $100k - 125k:| Farmington: | 10.2% (6,518) |
| Connecticut: | 10.2% (6,127) |
Number of households with income $125k - 150k:| Farmington: | 8.5% (5,403) |
| State: | 8.5% (5,079) |
Number of households with income $150k - 200k:| Farmington: | 12.4% (7,908) |
| State: | 12.4% (7,434) |
Number of households with income > $200k:| Farmington: | 24.4% (15,596) |
| State: | 24.4% (14,661) |
Aggregate household income in Farmington in 2022: $147,147,675
Median family income in Farmington in 2022:| Farmington: | $181,616 |
| State: | $134,548 |
Number of families with income < $10k:| Farmington: | 2.4% (19) |
| State: | 4.3% (1,875) |
Number of families with income $10k - 20k:| Farmington: | 0.5% (4) |
| State: | 1.6% (700) |
Number of families with income $20k - 30k:| Farmington: | 3.0% (24) |
| State: | 3.8% (1,682) |
Number of families with income $30k - 40k:| Farmington: | 0.7% (6) |
| Connecticut: | 3.8% (1,652) |
Number of families with income $40k - 50k:| Farmington: | 0.9% (7) |
| State: | 2.0% (863) |
Number of families with income $50k - 60k:| Farmington: | 3.4% (27) |
| State: | 3.7% (1,635) |
Number of families with income $60k - 75k:| Farmington: | 2.8% (21) |
| State: | 6.0% (2,651) |
Number of families with income $75k - 100k:| Farmington: | 7.9% (62) |
| State: | 11.0% (4,844) |
Number of families with income $100k - 125k:| Farmington: | 4.9% (38) |
| State: | 10.5% (4,621) |
Number of families with income $125k - 150k:| Farmington: | 7.3% (57) |
| State: | 8.2% (3,588) |
Number of families with income $150k - 200k:| Farmington: | 14.7% (115) |
| Connecticut: | 14.2% (6,237) |
Number of families with income > $200k:| Farmington: | 51.5% (402) |
| State: | 30.8% (13,522) |
Median non-family income in Farmington in 2022:| Farmington: | $61,110 |
| State: | $63,785 |
Change in median non-family income between 2000 and 2022:| Farmington, Connecticut: | +148.6% |
| State: | +77.9% |
Median per capita income in Farmington in 2022:| Farmington: | $63,550 |
| State: | $55,295 |
Change in median per capita income between 2000 and 2022:| Farmington, Connecticut: | +103.6% |
| State: | +97.8% |
Income statistics for Hispanic or Latino residents
Median household income in Farmington, CT in 2022:| Farmington: | $108,367 |
| Connecticut: | $60,275 |
Change in median household income between 2000 and 2022:| Farmington, Connecticut: | +67.8% |
| State: | +87.9% |
Number of households with income < $10k:| Farmington: | 8.7% (37,419) |
| Connecticut: | 8.7% (18,584) |
Number of households with income $10k - 20k:| Farmington: | 9.1% (38,730) |
| Connecticut: | 9.1% (19,235) |
Number of households with income $20k - 30k:| Farmington: | 8.9% (38,235) |
| State: | 8.9% (18,989) |
Number of households with income $30k - 40k:| Farmington: | 7.5% (32,150) |
| Connecticut: | 7.5% (15,967) |
Number of households with income $40k - 50k:| Farmington: | 8.7% (37,182) |
| State: | 8.7% (18,466) |
Number of households with income $50k - 60k:| Farmington: | 6.9% (29,611) |
| State: | 6.9% (14,706) |
Number of households with income $60k - 75k:| Farmington: | 8.9% (38,031) |
| State: | 8.9% (18,888) |
Number of households with income $75k - 100k:| Farmington: | 13.5% (57,725) |
| State: | 13.5% (28,669) |
Number of households with income $100k - 125k:| Farmington: | 8.2% (35,103) |
| State: | 8.2% (17,434) |
Number of households with income $125k - 150k:| Farmington: | 6.5% (27,690) |
| State: | 6.5% (13,752) |
Number of households with income $150k - 200k:| Farmington: | 6.6% (28,419) |
| State: | 6.6% (14,114) |
Number of households with income > $200k:| Farmington: | 6.4% (27,444) |
| State: | 6.4% (13,630) |
Aggregate household income in Farmington in 2022: $49,573,841
Median family income in Farmington in 2022:| Farmington: | $110,965 |
| State: | $68,336 |
Number of families with income < $10k:| Farmington: | 5.4% (65) |
| Connecticut: | 5.2% (7,456) |
Number of families with income $10k - 20k:| Farmington: | 4.0% (48) |
| State: | 6.0% (8,616) |
Number of families with income $20k - 30k:| Farmington: | 5.7% (68) |
| State: | 8.9% (12,680) |
Number of families with income $30k - 40k:| Farmington: | 6.7% (80) |
| State: | 8.5% (12,090) |
Number of families with income $40k - 50k:| Farmington: | 9.2% (109) |
| State: | 8.8% (12,624) |
Number of families with income $50k - 60k:| Farmington: | 5.7% (68) |
| State: | 8.4% (11,924) |
Number of families with income $60k - 75k:| Farmington: | 7.3% (87) |
| State: | 8.9% (12,677) |
Number of families with income $75k - 100k:| Farmington: | 12.6% (150) |
| State: | 14.3% (20,457) |
Number of families with income $100k - 125k:| Farmington: | 9.9% (117) |
| State: | 8.2% (11,720) |
Number of families with income $125k - 150k:| Farmington: | 10.2% (121) |
| State: | 8.2% (11,729) |
Number of families with income $150k - 200k:| Farmington: | 9.9% (118) |
| State: | 7.1% (10,096) |
Number of families with income > $200k:| Farmington: | 13.3% (158) |
| State: | 7.4% (10,622) |
Median non-family income in Farmington in 2022:| Farmington: | $43,471 |
| State: | $36,714 |
Change in median non-family income between 2000 and 2022:| Farmington, Connecticut: | +73.9% |
| State: | +90.0% |
Median per capita income in Farmington in 2022:| Farmington: | $28,108 |
| State: | $28,507 |
Change in median per capita income between 2000 and 2022:| Farmington, Connecticut: | +80.3% |
| Connecticut: | +117.2% |
Income statistics for American Indian and Alaska Native residents
Median household income in Farmington, CT in 2022:| Farmington: | $32,449 |
| State: | $41,848 |
Change in median household income between 2000 and 2022:| Farmington, Connecticut: | +12.9% |
| State: | +12.9% |
Number of households with income < $10k:| Farmington: | 8.4% (81,752) |
| State: | 10.2% (340) |
Number of households with income $10k - 20k:| Farmington: | 9.4% (91,233) |
| State: | 8.5% (283) |
Number of households with income $20k - 30k:| Farmington: | 8.5% (82,522) |
| State: | 9.4% (314) |
Number of households with income $30k - 40k:| Farmington: | 9.1% (88,412) |
| State: | 10.1% (337) |
Number of households with income $40k - 50k:| Farmington: | 8.3% (81,098) |
| State: | 13.4% (447) |
Number of households with income $50k - 60k:| Farmington: | 7.8% (76,468) |
| State: | 3.1% (104) |
Number of households with income $60k - 75k:| Farmington: | 9.8% (95,314) |
| State: | 5.6% (188) |
Number of households with income $75k - 100k:| Farmington: | 12.6% (123,035) |
| Connecticut: | 13.4% (447) |
Number of households with income $100k - 125k:| Farmington: | 9.4% (92,006) |
| State: | 9.5% (317) |
Number of households with income $125k - 150k:| Farmington: | 5.6% (55,083) |
| State: | 3.9% (131) |
Number of households with income $150k - 200k:| Farmington: | 6.0% (58,068) |
| State: | 6.3% (212) |
Number of households with income > $200k:| Farmington: | 5.2% (50,262) |
| Connecticut: | 6.8% (228) |
Aggregate household income in Farmington in 2022: $300,953
Median non-family income in Farmington in 2022:| Farmington: | $64,711 |
| State: | $40,310 |
Change in median non-family income between 2000 and 2022:| Farmington, Connecticut: | +125.1% |
| State: | +125.1% |
Median per capita income in Farmington in 2022:| Farmington: | $18,888 |
| State: | $25,355 |
Change in median per capita income between 2000 and 2022:| Farmington, Connecticut: | +45.9% |
| Connecticut: | +39.4% |
Income statistics for Multirace residents
Median household income in Farmington, CT in 2022:| Farmington: | $167,325 |
| State: | $77,277 |
Change in median household income between 2000 and 2022:| Farmington, Connecticut: | +119.4% |
| Connecticut: | +113.6% |
Number of households with income < $10k:| Farmington: | 6.0% (15,713) |
| State: | 6.0% (7,457) |
Number of households with income $10k - 20k:| Farmington: | 8.1% (21,365) |
| State: | 8.1% (10,139) |
Number of households with income $20k - 30k:| Farmington: | 7.0% (18,337) |
| State: | 7.0% (8,702) |
Number of households with income $30k - 40k:| Farmington: | 6.9% (18,008) |
| State: | 6.9% (8,546) |
Number of households with income $40k - 50k:| Farmington: | 7.0% (18,358) |
| Connecticut: | 7.0% (8,712) |
Number of households with income $50k - 60k:| Farmington: | 5.9% (15,448) |
| State: | 5.9% (7,331) |
Number of households with income $60k - 75k:| Farmington: | 8.5% (22,408) |
| State: | 8.5% (10,634) |
Number of households with income $75k - 100k:| Farmington: | 14.1% (37,086) |
| Connecticut: | 14.1% (17,600) |
Number of households with income $100k - 125k:| Farmington: | 9.9% (26,093) |
| Connecticut: | 9.9% (12,383) |
Number of households with income $125k - 150k:| Farmington: | 7.2% (18,798) |
| Connecticut: | 7.2% (8,921) |
Number of households with income $150k - 200k:| Farmington: | 8.8% (23,014) |
| State: | 8.8% (10,922) |
Number of households with income > $200k:| Farmington: | 10.6% (27,914) |
| State: | 10.6% (13,247) |
Aggregate household income in Farmington in 2022: $51,342,277
Median family income in Farmington in 2022:| Farmington: | $163,975 |
| Connecticut: | $84,255 |
Number of families with income < $10k:| Farmington: | 4.3% (13) |
| State: | 3.6% (3,027) |
Number of families with income $30k - 40k:| Farmington: | 7.2% (23) |
| Connecticut: | 6.8% (5,759) |
Number of families with income $60k - 75k:| Farmington: | 14.7% (46) |
| State: | 7.8% (6,550) |
Number of families with income $75k - 100k:| Farmington: | 51.1% (159) |
| Connecticut: | 14.5% (12,236) |
Number of families with income $100k - 125k:| Farmington: | 22.7% (71) |
| State: | 9.2% (7,787) |
Median per capita income in Farmington in 2022:| Farmington: | $30,640 |
| State: | $32,794 |
Change in median per capita income between 2000 and 2022:| Farmington, Connecticut: | +95.5% |
| State: | +117.2% |
Income statistics for other residents
Number of households with income < $10k:| Farmington: | 8.2% (4) |
| State: | 9.0% (8,596) |
Number of households with income $10k - 20k:| Farmington: | 10.2% (5) |
| State: | 10.2% (9,773) |
Number of households with income $20k - 30k:| Farmington: | 8.2% (4) |
| State: | 9.1% (8,691) |
Number of households with income $30k - 40k:| Farmington: | 8.2% (4) |
| State: | 7.8% (7,447) |
Number of households with income $40k - 50k:| Farmington: | 8.2% (4) |
| Connecticut: | 8.2% (7,860) |
Number of households with income $50k - 60k:| Farmington: | 6.1% (3) |
| State: | 6.0% (5,757) |
Number of households with income $60k - 75k:| Farmington: | 10.2% (5) |
| State: | 9.3% (8,942) |
Number of households with income $75k - 100k:| Farmington: | 14.3% (7) |
| State: | 14.3% (13,700) |
Number of households with income $100k - 125k:| Farmington: | 8.2% (4) |
| State: | 7.2% (6,906) |
Number of households with income $125k - 150k:| Farmington: | 6.1% (3) |
| State: | 6.5% (6,215) |
Number of households with income $150k - 200k:| Farmington: | 6.1% (3) |
| State: | 6.1% (5,865) |
Number of households with income > $200k:| Farmington: | 6.1% (3) |
| State: | 6.3% (6,065) |
Aggregate household income in Farmington in 2022: $7,022,648
Median family income in Farmington in 2022:| Farmington: | $357,967 |
| State: | $67,610 |
Number of families with income $150k - 200k:| Farmington: | 100.0% (94) |
| State: | 6.6% (4,339) |
Median per capita income in Farmington in 2022:| Farmington: | $59,693 |
| State: | $29,353 |