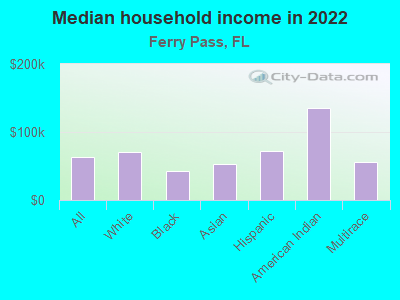
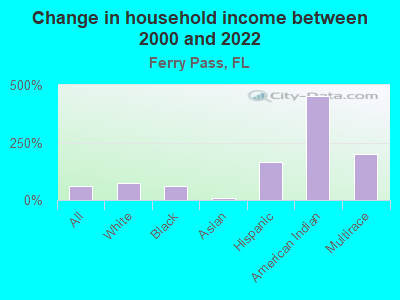
The median household income in Ferry Pass, FL in 2022 was $62,705, which was 10.5% less than the median annual income of $69,303 across the entire state of Florida. Compared to the median income of $38,674 in 2000 this represents an increase of 38.3%. The per capita income in 2022 was $34,045, which means an increase of 34.9% compared to 2000 when it was $22,165.
Whole page based on the data from 2000 / 2022 when the population of Ferry Pass, Florida was 27,176 / 32,809
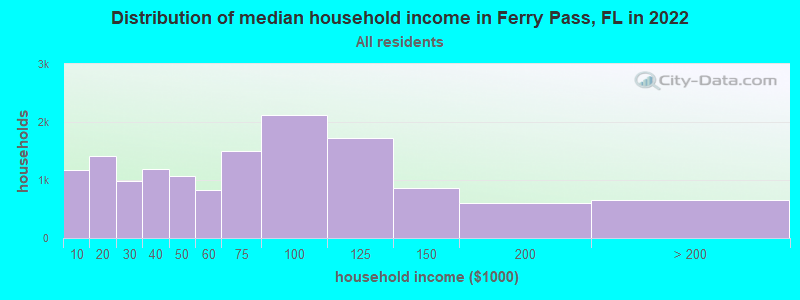
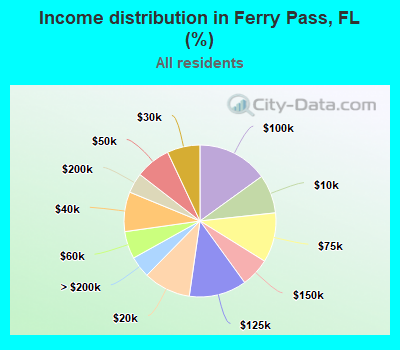
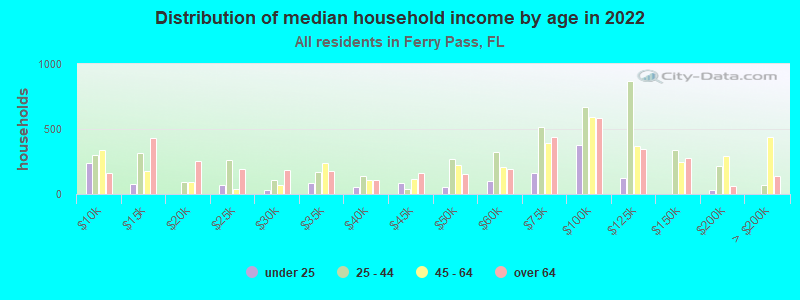
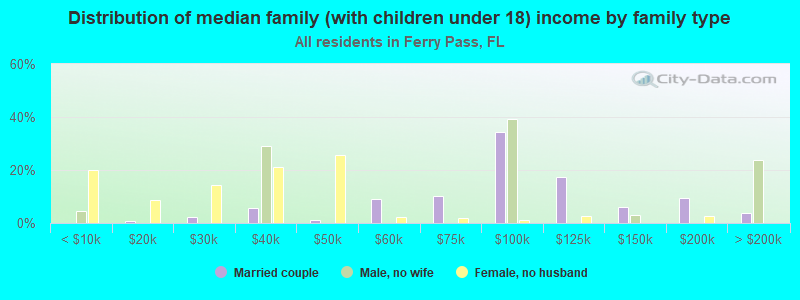
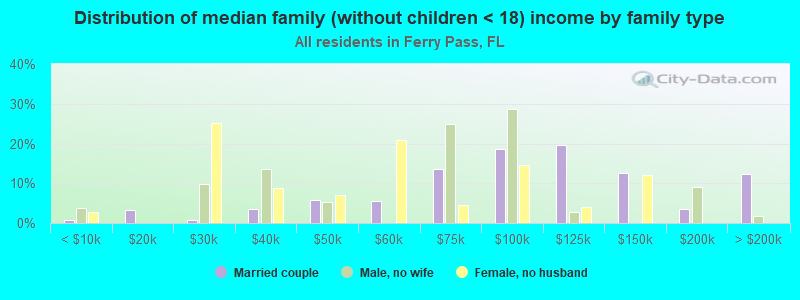
Income statistics for all residents
Median household income in Ferry Pass, FL in 2022:
Ferry Pass:
$62,706
Florida:
$69,303
Change in median household income between 2000 and 2022:
Ferry Pass, Florida:
+62.1%
State:
+78.5%
Number of households with income < $10k:
Ferry Pass:
8.3% (1,166)
State:
5.6% (495,572)
Number of households with income $10k - 20k:
Ferry Pass:
10.1% (1,422)
State:
6.9% (612,816)
Number of households with income $20k - 30k:
Ferry Pass:
7.0% (988)
Florida:
7.7% (679,608)
Number of households with income $30k - 40k:
Ferry Pass:
8.4% (1,193)
State:
8.0% (710,126)
Number of households with income $40k - 50k:
Ferry Pass:
7.5% (1,062)
State:
7.8% (687,940)
Number of households with income $50k - 60k:
Ferry Pass:
5.8% (825)
Florida:
7.6% (675,076)
Number of households with income $60k - 75k:
Ferry Pass:
10.6% (1,492)
State:
9.7% (858,354)
Number of households with income $75k - 100k:
Ferry Pass:
15.1% (2,126)
State:
13.4% (1,181,540)
Number of households with income $100k - 125k:
Ferry Pass:
12.2% (1,729)
Florida:
9.6% (851,620)
Number of households with income $125k - 150k:
Ferry Pass:
6.2% (870)
State:
6.4% (560,854)
Number of households with income $150k - 200k:
Ferry Pass:
4.3% (604)
Florida:
7.7% (677,227)
Number of households with income > $200k:
Ferry Pass:
4.6% (649)
State:
9.5% (835,661)
Aggregate household income in Ferry Pass in 2022: $1,056,090,776
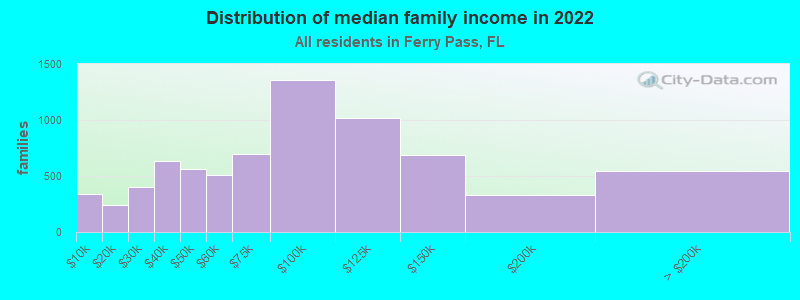
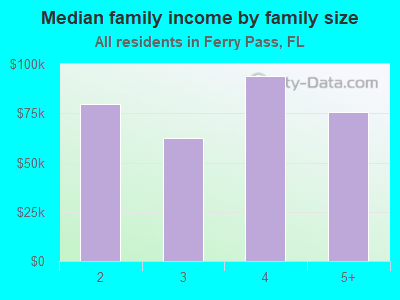
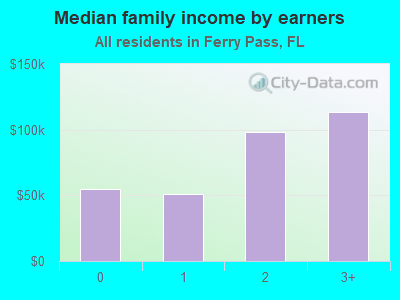
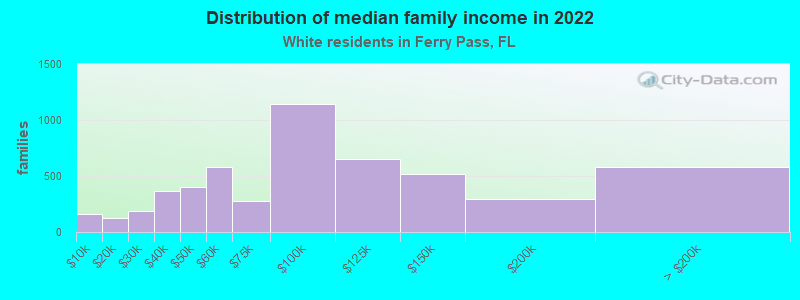
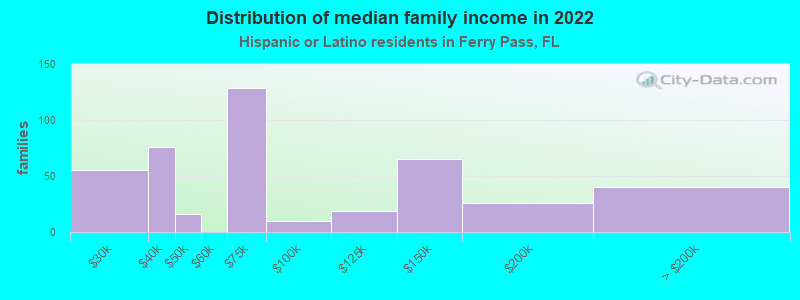
Median family income in Ferry Pass in 2022:
Ferry Pass:
$79,901
Florida:
$83,410
Number of families with income < $10k:
Ferry Pass:
4.7% (341)
Florida:
3.5% (196,709)
Number of families with income $10k - 20k:
Ferry Pass:
3.2% (238)
State:
3.9% (220,255)
Number of families with income $20k - 30k:
Ferry Pass:
5.5% (402)
State:
5.8% (332,003)
Number of families with income $30k - 40k:
Ferry Pass:
8.6% (632)
State:
6.9% (391,565)
Number of families with income $40k - 50k:
Ferry Pass:
7.7% (566)
Florida:
7.2% (407,691)
Number of families with income $50k - 60k:
Ferry Pass:
7.0% (511)
State:
7.3% (415,240)
Number of families with income $60k - 75k:
Ferry Pass:
9.6% (700)
State:
10.2% (580,095)
Number of families with income $75k - 100k:
Ferry Pass:
18.5% (1,353)
Florida:
14.6% (830,079)
Number of families with income $100k - 125k:
Ferry Pass:
13.9% (1,020)
State:
11.3% (640,676)
Number of families with income $125k - 150k:
Ferry Pass:
9.4% (686)
State:
7.8% (442,580)
Number of families with income $150k - 200k:
Ferry Pass:
4.5% (331)
Florida:
9.4% (536,171)
Number of families with income > $200k:
Ferry Pass:
7.4% (541)
Florida:
12.2% (691,335)
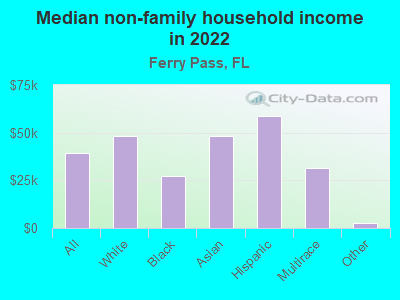
Median non-family income in Ferry Pass in 2022:
Ferry Pass:
$39,210
State:
$43,665
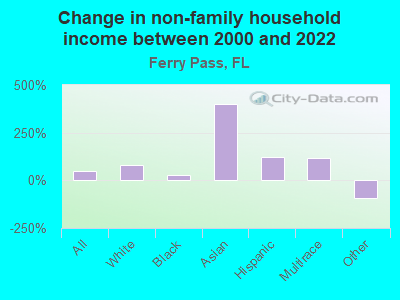
Change in median non-family income between 2000 and 2022:
Ferry Pass, Florida:
+48.4%
State:
+76.1%
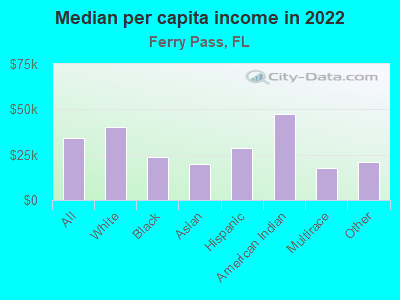
Median per capita income in Ferry Pass in 2022:
Ferry Pass:
$34,045
Florida:
$40,278
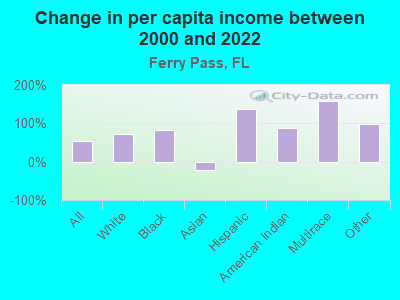
Change in median per capita income between 2000 and 2022:
Ferry Pass, Florida:
+53.6%
State:
+86.8%
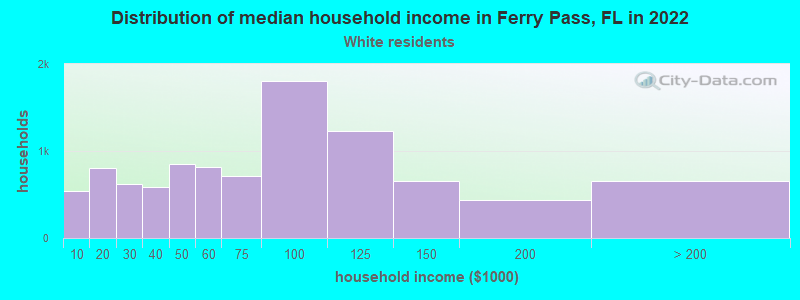
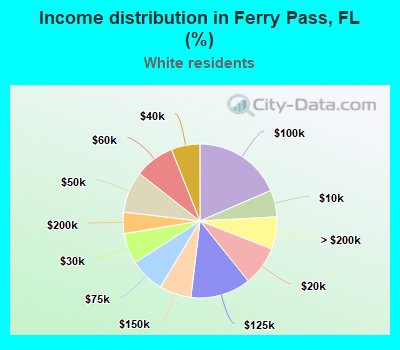
Income statistics for White residents
Median household income in Ferry Pass, FL in 2022:
Ferry Pass:
$70,721
State:
$74,559
Change in median household income between 2000 and 2022:
Ferry Pass, Florida:
+75.4%
Florida:
+82.7%
Number of households with income < $10k:
Ferry Pass:
5.6% (545)
Florida:
4.9% (270,741)
Number of households with income $10k - 20k:
Ferry Pass:
8.3% (803)
State:
6.1% (337,688)
Number of households with income $20k - 30k:
Ferry Pass:
6.5% (626)
Florida:
7.2% (395,954)
Number of households with income $30k - 40k:
Ferry Pass:
6.0% (585)
Florida:
7.5% (411,553)
Number of households with income $40k - 50k:
Ferry Pass:
8.7% (848)
State:
7.5% (410,613)
Number of households with income $50k - 60k:
Ferry Pass:
8.4% (812)
State:
7.6% (416,709)
Number of households with income $60k - 75k:
Ferry Pass:
7.3% (709)
State:
9.5% (523,639)
Number of households with income $75k - 100k:
Ferry Pass:
18.5% (1,799)
Florida:
13.3% (732,030)
Number of households with income $100k - 125k:
Ferry Pass:
12.7% (1,229)
State:
10.2% (559,463)
Number of households with income $125k - 150k:
Ferry Pass:
6.7% (653)
State:
6.9% (379,323)
Number of households with income $150k - 200k:
Ferry Pass:
4.5% (435)
State:
8.3% (456,076)
Number of households with income > $200k:
Ferry Pass:
6.8% (659)
State:
11.1% (610,258)
Aggregate household income in Ferry Pass in 2022: $825,372,227
Median family income in Ferry Pass in 2022:
Ferry Pass:
$89,845
State:
$93,222
Number of families with income < $10k:
Ferry Pass:
3.1% (162)
State:
2.6% (89,721)
Number of families with income $10k - 20k:
Ferry Pass:
2.4% (127)
Florida:
3.0% (101,720)
Number of families with income $20k - 30k:
Ferry Pass:
3.5% (185)
State:
4.5% (154,795)
Number of families with income $30k - 40k:
Ferry Pass:
6.9% (364)
Florida:
5.7% (194,218)
Number of families with income $40k - 50k:
Ferry Pass:
7.6% (401)
State:
6.4% (219,550)
Number of families with income $50k - 60k:
Ferry Pass:
11.0% (583)
State:
7.0% (238,045)
Number of families with income $60k - 75k:
Ferry Pass:
5.3% (279)
State:
9.6% (328,141)
Number of families with income $75k - 100k:
Ferry Pass:
21.6% (1,140)
State:
14.8% (503,988)
Number of families with income $100k - 125k:
Ferry Pass:
12.3% (650)
State:
12.0% (409,184)
Number of families with income $125k - 150k:
Ferry Pass:
9.8% (517)
Florida:
8.8% (298,895)
Number of families with income $150k - 200k:
Ferry Pass:
5.7% (299)
Florida:
10.6% (359,290)
Number of families with income > $200k:
Ferry Pass:
10.9% (577)
State:
14.9% (507,279)
Median non-family income in Ferry Pass in 2022:
Ferry Pass:
$48,180
Florida:
$46,674
Change in median non-family income between 2000 and 2022:
Ferry Pass, Florida:
+78.7%
Florida:
+81.2%
Median per capita income in Ferry Pass in 2022:
Ferry Pass:
$40,402
Florida:
$48,094
Change in median per capita income between 2000 and 2022:
Ferry Pass, Florida:
+70.8%
State:
+101.1%
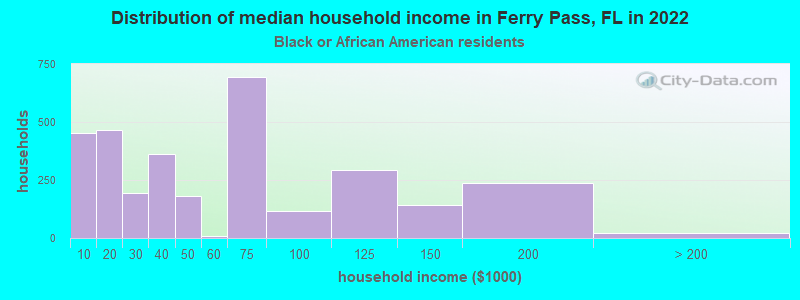
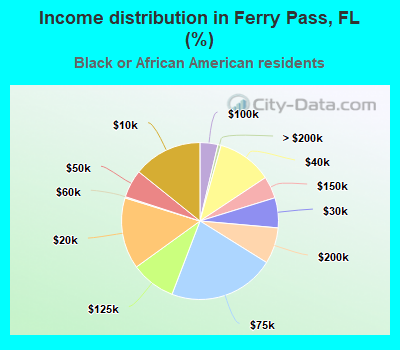
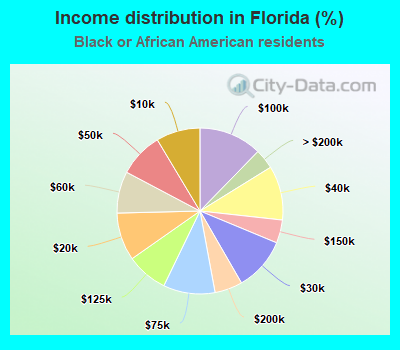
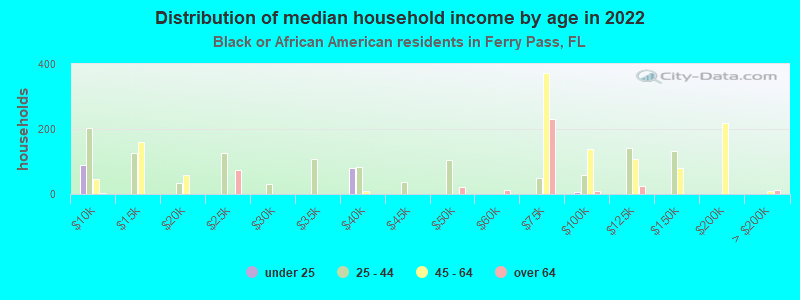
Income statistics for Black or African American residents
Median household income in Ferry Pass, FL in 2022:
Ferry Pass:
$42,411
Florida:
$52,796
Change in median household income between 2000 and 2022:
Ferry Pass, Florida:
+59.6%
State:
+88.3%
Number of households with income < $10k:
Ferry Pass:
14.2% (451)
State:
8.6% (101,054)
Number of households with income $10k - 20k:
Ferry Pass:
14.7% (467)
Florida:
9.3% (110,079)
Number of households with income $20k - 30k:
Ferry Pass:
6.2% (196)
Florida:
10.4% (122,525)
Number of households with income $30k - 40k:
Ferry Pass:
11.3% (360)
State:
10.6% (124,619)
Number of households with income $40k - 50k:
Ferry Pass:
5.8% (183)
Florida:
8.7% (102,300)
Number of households with income $50k - 60k:
Ferry Pass:
0.3% (8)
State:
8.1% (95,745)
Number of households with income $60k - 75k:
Ferry Pass:
21.9% (696)
State:
10.1% (118,757)
Number of households with income $75k - 100k:
Ferry Pass:
3.7% (117)
State:
12.3% (144,919)
Number of households with income $100k - 125k:
Ferry Pass:
9.2% (293)
State:
8.1% (95,395)
Number of households with income $125k - 150k:
Ferry Pass:
4.5% (144)
State:
4.5% (53,276)
Number of households with income $150k - 200k:
Ferry Pass:
7.5% (237)
State:
5.4% (63,827)
Number of households with income > $200k:
Ferry Pass:
0.7% (21)
Florida:
3.9% (45,695)
Aggregate household income in Ferry Pass in 2022: $152,390,048
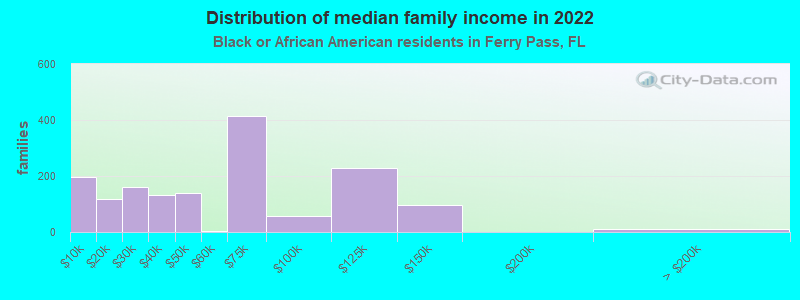
Median family income in Ferry Pass in 2022:
Ferry Pass:
$47,066
State:
$62,875
Number of families with income < $10k:
Ferry Pass:
12.7% (198)
Florida:
6.1% (46,041)
Number of families with income $10k - 20k:
Ferry Pass:
7.6% (118)
Florida:
6.1% (45,591)
Number of families with income $20k - 30k:
Ferry Pass:
10.2% (159)
Florida:
9.2% (69,363)
Number of families with income $30k - 40k:
Ferry Pass:
8.5% (132)
Florida:
10.1% (75,779)
Number of families with income $40k - 50k:
Ferry Pass:
9.0% (140)
Florida:
8.4% (63,129)
Number of families with income $50k - 60k:
Ferry Pass:
0.2% (4)
Florida:
7.6% (56,971)
Number of families with income $60k - 75k:
Ferry Pass:
26.6% (415)
State:
11.5% (86,172)
Number of families with income $75k - 100k:
Ferry Pass:
3.6% (57)
Florida:
13.7% (102,895)
Number of families with income $100k - 125k:
Ferry Pass:
14.7% (229)
State:
10.0% (74,750)
Number of families with income $125k - 150k:
Ferry Pass:
6.3% (98)
State:
5.6% (42,384)
Number of families with income > $200k:
Ferry Pass:
0.6% (9)
State:
4.8% (36,292)
Median non-family income in Ferry Pass in 2022:
Ferry Pass:
$27,391
Florida:
$34,782
Change in median non-family income between 2000 and 2022:
Ferry Pass, Florida:
+28.0%
Florida:
+98.9%
Median per capita income in Ferry Pass in 2022:
Ferry Pass:
$23,745
State:
$26,700
Change in median per capita income between 2000 and 2022:
Ferry Pass, Florida:
+82.1%
State:
+112.2%
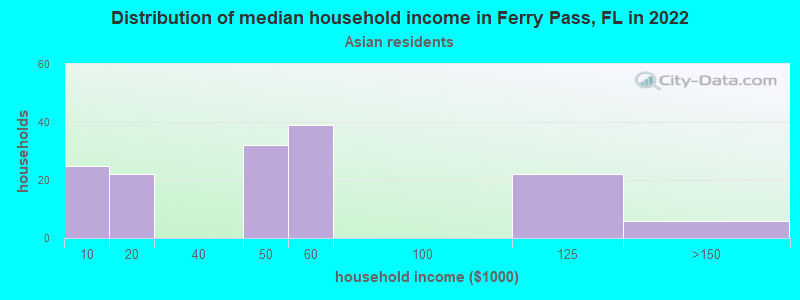
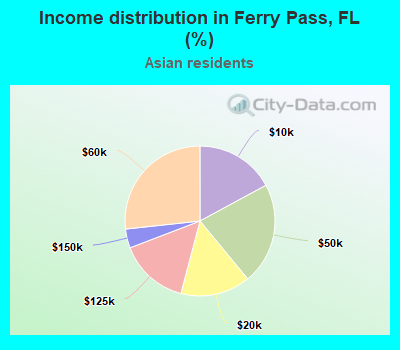
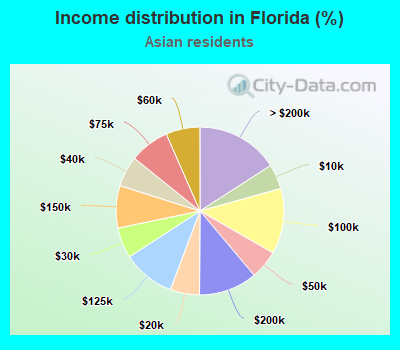
Income statistics for Asian residents
Median household income in Ferry Pass, FL in 2022:
Ferry Pass:
$52,410
Florida:
$89,645
Change in median household income between 2000 and 2022:
Ferry Pass, Florida:
+6.9%
Florida:
+100.2%
Number of households with income < $10k:
Ferry Pass:
17.1% (25)
State:
4.8% (10,378)
Number of households with income $10k - 20k:
Ferry Pass:
15.1% (22)
State:
5.7% (12,222)
Number of households with income $20k - 30k:
Ferry Pass:
0.0% (0)
State:
5.9% (12,739)
Number of households with income $30k - 40k:
Ferry Pass:
0.0% (0)
Florida:
5.9% (12,759)
Number of households with income $40k - 50k:
Ferry Pass:
21.9% (32)
State:
5.6% (12,009)
Number of households with income $50k - 60k:
Ferry Pass:
26.7% (39)
Florida:
6.5% (14,158)
Number of households with income $60k - 75k:
Ferry Pass:
0.0% (0)
State:
7.7% (16,568)
Number of households with income $75k - 100k:
Ferry Pass:
0.0% (0)
State:
12.6% (27,273)
Number of households with income $100k - 125k:
Ferry Pass:
15.1% (22)
State:
10.1% (21,821)
Number of households with income $125k - 150k:
Ferry Pass:
4.1% (6)
State:
8.2% (17,650)
Number of households with income $150k - 200k:
Ferry Pass:
0.0% (0)
State:
11.2% (24,296)
Number of households with income > $200k:
Ferry Pass:
0.0% (0)
State:
15.9% (34,363)
Aggregate household income in Ferry Pass in 2022: $6,774,479
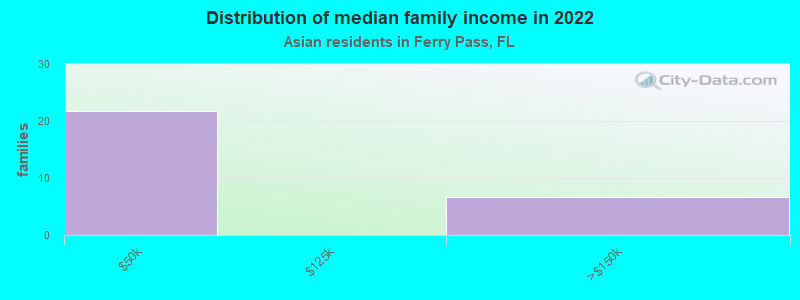
Median family income in Ferry Pass in 2022:
Ferry Pass:
$54,193
Florida:
$101,833
Number of families with income $40k - 50k:
Ferry Pass:
76.3% (22)
Florida:
4.6% (7,273)
Number of families with income $125k - 150k:
Ferry Pass:
23.7% (7)
State:
9.2% (14,478)
Median non-family income in Ferry Pass in 2022:
Ferry Pass:
$48,487
State:
$52,706
Median per capita income in Ferry Pass in 2022:
Ferry Pass:
$20,056
State:
$46,365
Change in median per capita income between 2000 and 2022:: -20.8%
Ferry Pass, Florida:
-20.8%
State:
+127.0%
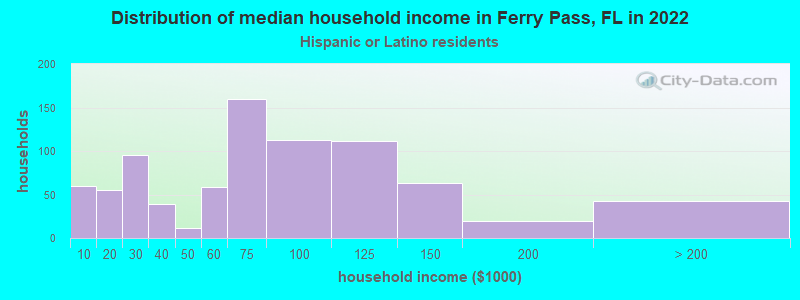
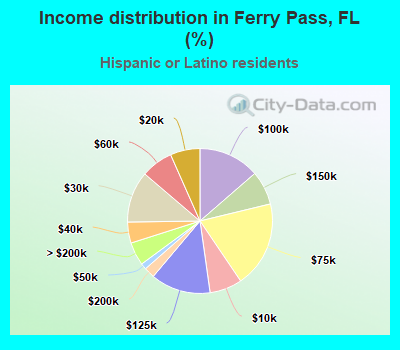
Income statistics for Hispanic or Latino residents
Median household income in Ferry Pass, FL in 2022:
Ferry Pass:
$72,053
Florida:
$64,482
Number of households with income < $10k:
Ferry Pass:
7.2% (60)
Florida:
5.9% (120,841)
Number of households with income $10k - 20k:
Ferry Pass:
6.6% (55)
Florida:
7.8% (158,824)
Number of households with income $20k - 30k:
Ferry Pass:
11.5% (95)
Florida:
7.8% (158,797)
Number of households with income $30k - 40k:
Ferry Pass:
4.7% (39)
Florida:
8.4% (171,736)
Number of households with income $40k - 50k:
Ferry Pass:
1.3% (11)
State:
8.5% (174,397)
Number of households with income $50k - 60k:
Ferry Pass:
7.1% (59)
State:
7.9% (160,816)
Number of households with income $60k - 75k:
Ferry Pass:
19.3% (160)
Florida:
10.6% (215,567)
Number of households with income $75k - 100k:
Ferry Pass:
13.6% (113)
State:
14.1% (288,590)
Number of households with income $100k - 125k:
Ferry Pass:
13.4% (111)
State:
9.4% (192,146)
Number of households with income $125k - 150k:
Ferry Pass:
7.6% (63)
Florida:
5.7% (115,883)
Number of households with income $150k - 200k:
Ferry Pass:
2.4% (20)
Florida:
6.8% (139,384)
Number of households with income > $200k:
Ferry Pass:
5.2% (43)
State:
7.0% (143,116)
Aggregate household income in Ferry Pass in 2022: $65,587,452
Median family income in Ferry Pass in 2022:
Ferry Pass:
$70,679
Florida:
$70,631
Number of families with income $20k - 30k:
Ferry Pass:
12.6% (55)
Florida:
7.7% (112,768)
Number of families with income $30k - 40k:
Ferry Pass:
17.5% (76)
Florida:
8.3% (121,408)
Number of families with income $40k - 50k:
Ferry Pass:
3.6% (16)
State:
8.6% (127,058)
Number of families with income $60k - 75k:
Ferry Pass:
29.6% (129)
Florida:
11.3% (165,746)
Number of families with income $75k - 100k:
Ferry Pass:
2.3% (10)
Florida:
14.5% (213,504)
Number of families with income $100k - 125k:
Ferry Pass:
4.3% (19)
State:
10.3% (151,829)
Number of families with income $125k - 150k:
Ferry Pass:
14.9% (65)
State:
6.4% (93,499)
Number of families with income $150k - 200k:
Ferry Pass:
6.1% (26)
State:
7.5% (109,536)
Number of families with income > $200k:
Ferry Pass:
9.2% (40)
State:
8.1% (118,912)
Median non-family income in Ferry Pass in 2022:
Ferry Pass:
$58,705
State:
$40,313
Change in median non-family income between 2000 and 2022:
Ferry Pass, Florida:
+123.0%
State:
+106.7%
Median per capita income in Ferry Pass in 2022:
Ferry Pass:
$28,553
State:
$30,491
Change in median per capita income between 2000 and 2022:
Ferry Pass, Florida:
+138.3%
State:
+100.6%
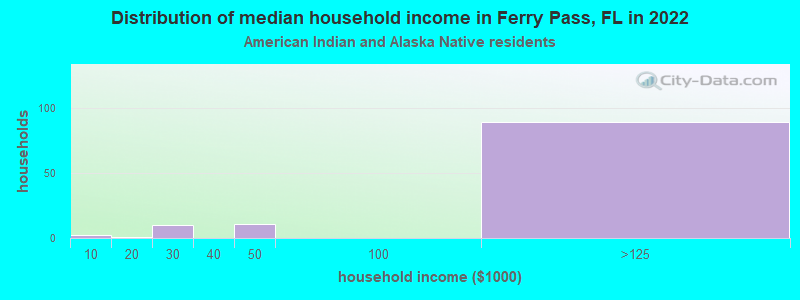
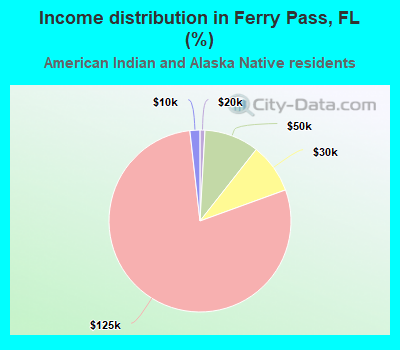
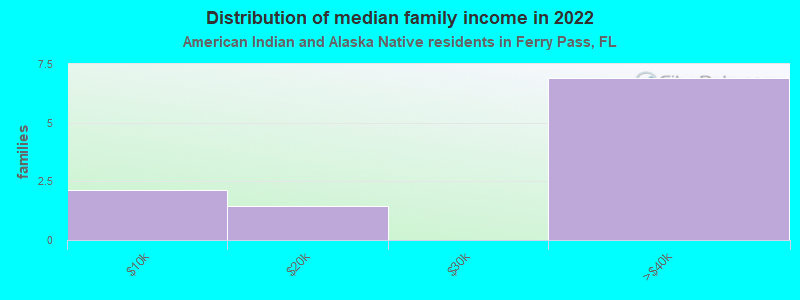
Income statistics for American Indian and Alaska Native residents
Median household income in Ferry Pass, FL in 2022:
Ferry Pass:
$135,944
Florida:
$70,243
Number of households with income < $10k:
Ferry Pass:
1.8% (2)
State:
5.8% (1,524)
Number of households with income $10k - 20k:
Ferry Pass:
0.9% (1)
Florida:
5.2% (1,374)
Number of households with income $20k - 30k:
Ferry Pass:
8.8% (10)
State:
9.5% (2,512)
Number of households with income $30k - 40k:
Ferry Pass:
0.0% (0)
State:
5.4% (1,420)
Number of households with income $40k - 50k:
Ferry Pass:
9.7% (11)
State:
10.0% (2,632)
Number of households with income $50k - 60k:
Ferry Pass:
0.0% (0)
State:
5.5% (1,437)
Number of households with income $60k - 75k:
Ferry Pass:
0.0% (0)
State:
13.9% (3,664)
Number of households with income $75k - 100k:
Ferry Pass:
0.0% (0)
Florida:
16.0% (4,217)
Number of households with income $100k - 125k:
Ferry Pass:
78.8% (89)
State:
9.4% (2,483)
Number of households with income $125k - 150k:
Ferry Pass:
0.0% (0)
State:
4.6% (1,204)
Number of households with income $150k - 200k:
Ferry Pass:
0.0% (0)
State:
8.7% (2,294)
Number of households with income > $200k:
Ferry Pass:
0.0% (0)
Florida:
6.1% (1,604)
Aggregate household income in Ferry Pass in 2022: $9,881,771
Median family income in Ferry Pass in 2022:
Ferry Pass:
$35,844
Florida:
$75,390
Median per capita income in Ferry Pass in 2022:
Ferry Pass:
$47,685
State:
$25,874
Change in median per capita income between 2000 and 2022:
Ferry Pass, Florida:
+88.2%
State:
+55.9%
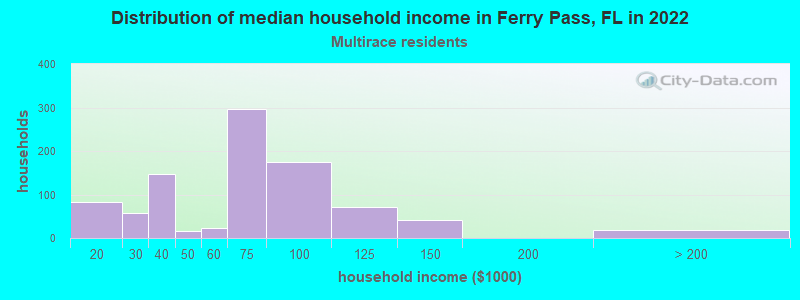
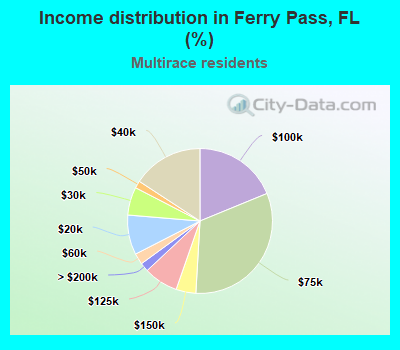
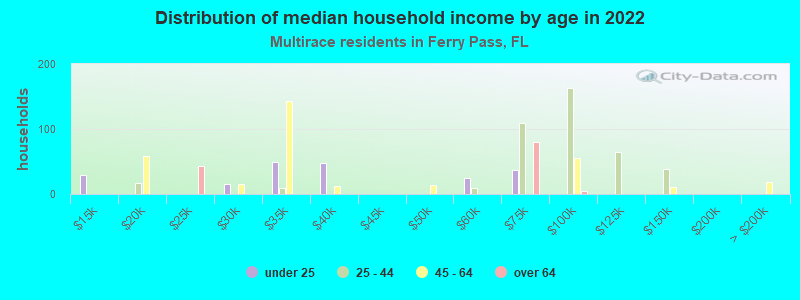
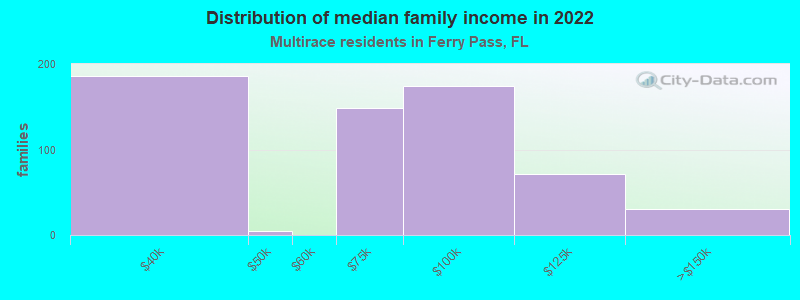
Income statistics for Multirace residents
Median household income in Ferry Pass, FL in 2022:
Ferry Pass:
$56,048
Florida:
$66,563
Number of households with income < $10k:
Ferry Pass:
0.0% (0)
Florida:
5.8% (83,509)
Number of households with income $10k - 20k:
Ferry Pass:
8.9% (82)
State:
8.3% (119,018)
Number of households with income $20k - 30k:
Ferry Pass:
6.3% (58)
State:
7.6% (108,964)
Number of households with income $30k - 40k:
Ferry Pass:
15.8% (146)
State:
7.8% (112,273)
Number of households with income $40k - 50k:
Ferry Pass:
1.6% (15)
State:
8.1% (116,736)
Number of households with income $50k - 60k:
Ferry Pass:
2.5% (23)
State:
7.5% (108,182)
Number of households with income $60k - 75k:
Ferry Pass:
32.1% (297)
Florida:
10.0% (142,830)
Number of households with income $75k - 100k:
Ferry Pass:
18.8% (174)
State:
14.3% (205,066)
Number of households with income $100k - 125k:
Ferry Pass:
7.7% (71)
Florida:
9.1% (130,357)
Number of households with income $125k - 150k:
Ferry Pass:
4.4% (41)
State:
5.8% (83,865)
Number of households with income $150k - 200k:
Ferry Pass:
0.0% (0)
Florida:
7.2% (103,107)
Number of households with income > $200k:
Ferry Pass:
1.9% (18)
Florida:
8.4% (120,637)
Aggregate household income in Ferry Pass in 2022: $47,085,851
Median family income in Ferry Pass in 2022:
Ferry Pass:
$65,356
Florida:
$74,522
Number of families with income $30k - 40k:
Ferry Pass:
30.3% (186)
Florida:
7.5% (76,278)
Number of families with income $40k - 50k:
Ferry Pass:
0.8% (5)
State:
8.2% (83,077)
Number of families with income $60k - 75k:
Ferry Pass:
24.2% (149)
State:
10.8% (109,110)
Number of families with income $75k - 100k:
Ferry Pass:
28.3% (174)
Florida:
15.0% (151,268)
Number of families with income $100k - 125k:
Ferry Pass:
11.5% (71)
Florida:
10.2% (103,154)
Number of families with income $125k - 150k:
Ferry Pass:
4.8% (30)
State:
6.5% (65,923)
Median non-family income in Ferry Pass in 2022:
Ferry Pass:
$31,680
Florida:
$40,061
Change in median non-family income between 2000 and 2022:
Ferry Pass, Florida:
+116.4%
State:
+90.4%
Median per capita income in Ferry Pass in 2022:
Ferry Pass:
$17,447
State:
$31,893
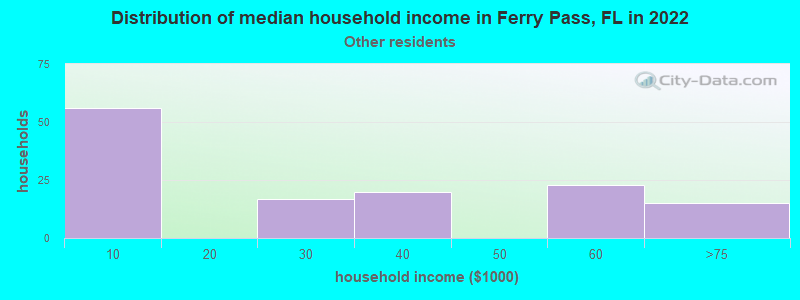
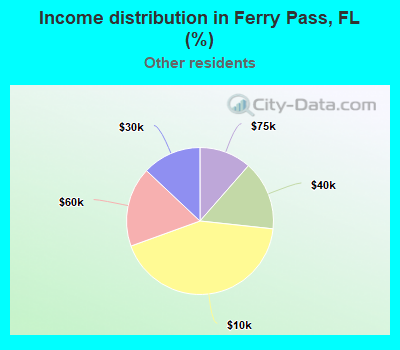
Income statistics for other residents
Number of households with income < $10k:
Ferry Pass:
42.7% (56)
State:
6.1% (28,059)
Number of households with income $10k - 20k:
Ferry Pass:
0.0% (0)
State:
7.0% (32,348)
Number of households with income $20k - 30k:
Ferry Pass:
13.0% (17)
State:
8.0% (36,819)
Number of households with income $30k - 40k:
Ferry Pass:
15.3% (20)
State:
10.2% (47,209)
Number of households with income $40k - 50k:
Ferry Pass:
0.0% (0)
State:
9.3% (43,006)
Number of households with income $50k - 60k:
Ferry Pass:
17.6% (23)
State:
8.2% (38,018)
Number of households with income $60k - 75k:
Ferry Pass:
11.5% (15)
State:
11.4% (52,577)
Number of households with income $75k - 100k:
Ferry Pass:
0.0% (0)
State:
14.6% (67,588)
Number of households with income $100k - 125k:
Ferry Pass:
0.0% (0)
State:
9.0% (41,737)
Number of households with income $125k - 150k:
Ferry Pass:
0.0% (0)
State:
5.4% (24,841)
Number of households with income $150k - 200k:
Ferry Pass:
0.0% (0)
Florida:
5.9% (27,334)
Number of households with income > $200k:
Ferry Pass:
0.0% (0)
State:
5.0% (22,928)
Aggregate household income in Ferry Pass in 2022: $5,358,530
Median non-family income in Ferry Pass in 2022:
Ferry Pass:
$2,788
Florida:
$40,974
Change in median non-family income between 2000 and 2022:: -91.1%
Ferry Pass, Florida:
-91.1%
State:
+84.1%
Median per capita income in Ferry Pass in 2022:
Ferry Pass:
$20,986
State:
$27,276
Change in median per capita income between 2000 and 2022:
Ferry Pass, Florida:
+97.5%
State:
+138.6%
Discuss Ferry Pass, Florida (FL) on our hugely popular Florida forum.