The median household income in Fillmore, MO in 2022 was $38,644, which was 67.7% less than the median annual income of $64,811 across the entire state of Missouri. Compared to the median income of $31,750 in 2000 this represents an increase of 17.8%. The per capita income in 2022 was $18,024, which means an increase of 27.6% compared to 2000 when it was $13,047.
Whole page based on the data from 2000 / 2022 when the population of Fillmore, Missouri was 211 / 232
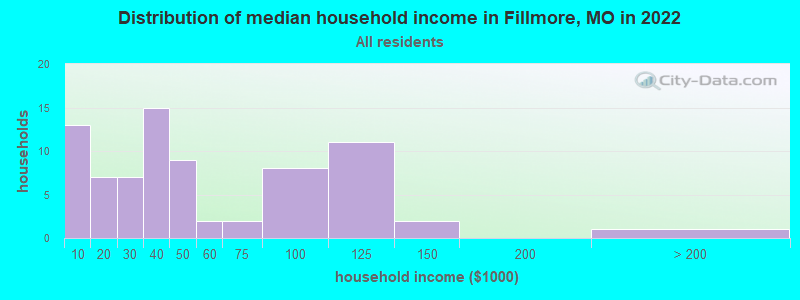
Income statistics for all residents
Median household income in Fillmore, MO in 2022:
Fillmore:
$38,645
Missouri:
$64,811
Change in median household income between 2000 and 2022:
Fillmore, Missouri:
+21.7%
State:
+70.9%
Number of households with income < $10k:
Fillmore:
16.9% (13)
State:
5.7% (144,208)
Number of households with income $10k - 20k:
Fillmore:
9.1% (7)
State:
8.2% (205,541)
Number of households with income $20k - 30k:
Fillmore:
9.1% (7)
State:
7.8% (197,162)
Number of households with income $30k - 40k:
Fillmore:
19.5% (15)
State:
8.7% (220,088)
Number of households with income $40k - 50k:
Fillmore:
11.7% (9)
Missouri:
8.2% (206,651)
Number of households with income $50k - 60k:
Fillmore:
2.6% (2)
Missouri:
7.8% (196,521)
Number of households with income $60k - 75k:
Fillmore:
2.6% (2)
State:
10.1% (255,043)
Number of households with income $75k - 100k:
Fillmore:
10.4% (8)
Missouri:
13.4% (337,210)
Number of households with income $100k - 125k:
Fillmore:
14.3% (11)
Missouri:
9.8% (247,187)
Number of households with income $125k - 150k:
Fillmore:
2.6% (2)
State:
6.4% (160,260)
Number of households with income $150k - 200k:
Fillmore:
0.0% (0)
State:
6.9% (174,947)
Number of households with income > $200k:
Fillmore:
1.3% (1)
State:
7.0% (177,014)
Aggregate household income in Fillmore in 2022: $3,928,471
Median family income in Fillmore in 2022:
Fillmore:
$38,007
State:
$83,420
Number of families with income < $10k:
Fillmore:
22.0% (9)
Missouri:
3.2% (49,878)
Number of families with income $20k - 30k:
Fillmore:
9.7% (4)
Missouri:
5.4% (84,243)
Number of families with income $30k - 40k:
Fillmore:
31.2% (13)
State:
6.7% (104,645)
Number of families with income $40k - 50k:
Fillmore:
2.6% (1)
State:
7.2% (113,014)
Number of families with income $75k - 100k:
Fillmore:
19.7% (8)
Missouri:
15.5% (243,177)
Number of families with income $100k - 125k:
Fillmore:
9.9% (4)
Missouri:
12.3% (192,410)
Number of families with income $125k - 150k:
Fillmore:
2.4% (1)
State:
8.5% (133,872)
Number of families with income > $200k:
Fillmore:
2.4% (1)
State:
9.8% (153,310)
Median income for families with 0 earners:
Fillmore:
$0
State:
$48,592
Median income for families with 1 earner:
Fillmore:
$35,318
Missouri:
$57,248
Median income for families with 2 earners:
Fillmore:
$0
State:
$105,997
Median income for families with 3+ earners:
Fillmore:
$0
State:
$140,546
Median non-family income in Fillmore in 2022:
Fillmore:
$43,794
State:
$38,435
Change in median non-family income between 2000 and 2022:
Fillmore, Missouri:
+44.0%
Missouri:
+72.4%
Median per capita income in Fillmore in 2022:
Fillmore:
$18,025
Missouri:
$36,640
Change in median per capita income between 2000 and 2022:
Fillmore, Missouri:
+38.2%
State:
+83.8%
Income statistics for White residents
Median household income in Fillmore, MO in 2022:
Fillmore:
$38,867
Missouri:
$68,771
Change in median household income between 2000 and 2022:
Fillmore, Missouri:
+21.1%
State:
+73.5%
Number of households with income < $10k:
Fillmore:
16.9% (13)
Missouri:
4.9% (98,067)
Number of households with income $10k - 20k:
Fillmore:
9.1% (7)
State:
7.3% (146,436)
Number of households with income $20k - 30k:
Fillmore:
9.1% (7)
State:
7.6% (153,201)
Number of households with income $30k - 40k:
Fillmore:
19.5% (15)
Missouri:
8.4% (169,042)
Number of households with income $40k - 50k:
Fillmore:
11.7% (9)
State:
8.0% (160,724)
Number of households with income $50k - 60k:
Fillmore:
2.6% (2)
Missouri:
7.7% (155,924)
Number of households with income $60k - 75k:
Fillmore:
2.6% (2)
State:
10.2% (205,080)
Number of households with income $75k - 100k:
Fillmore:
10.4% (8)
State:
14.1% (283,507)
Number of households with income $100k - 125k:
Fillmore:
14.3% (11)
Missouri:
10.2% (205,898)
Number of households with income $125k - 150k:
Fillmore:
2.6% (2)
Missouri:
6.7% (135,287)
Number of households with income $150k - 200k:
Fillmore:
0.0% (0)
State:
7.4% (148,450)
Number of households with income > $200k:
Fillmore:
1.3% (1)
State:
7.6% (153,213)
Aggregate household income in Fillmore in 2022: $3,840,847
Median family income in Fillmore in 2022:
Fillmore:
$38,164
Missouri:
$87,438
Number of families with income < $10k:
Fillmore:
21.2% (9)
Missouri:
2.5% (31,792)
Number of families with income $20k - 30k:
Fillmore:
10.0% (4)
State:
5.0% (63,337)
Number of families with income $30k - 40k:
Fillmore:
31.1% (13)
State:
6.2% (78,970)
Number of families with income $40k - 50k:
Fillmore:
2.5% (1)
State:
6.8% (86,154)
Number of families with income $75k - 100k:
Fillmore:
20.2% (8)
State:
16.2% (206,529)
Number of families with income $100k - 125k:
Fillmore:
10.1% (4)
State:
12.9% (164,015)
Number of families with income $125k - 150k:
Fillmore:
2.4% (1)
State:
8.9% (113,643)
Number of families with income > $200k:
Fillmore:
2.4% (1)
State:
10.4% (132,544)
Median non-family income in Fillmore in 2022:
Fillmore:
$43,765
State:
$40,207
Change in median non-family income between 2000 and 2022:
Fillmore, Missouri:
+43.9%
Missouri:
+75.5%
Median per capita income in Fillmore in 2022:
Fillmore:
$18,052
State:
$39,160
Change in median per capita income between 2000 and 2022:
Fillmore, Missouri:
+34.0%
State:
+86.9%
Discuss Fillmore, Missouri (MO) on our hugely popular Missouri forum.