The median household income in Fillmore, UT in 2022 was $73,165, which was 21.9% less than the median annual income of $89,168 across the entire state of Utah. Compared to the median income of $31,719 in 2000 this represents an increase of 56.6%. The per capita income in 2022 was $27,500, which means an increase of 56.1% compared to 2000 when it was $12,061.
Whole page based on the data from 2000 / 2022 when the population of Fillmore, Utah was 2,253 / 2,648
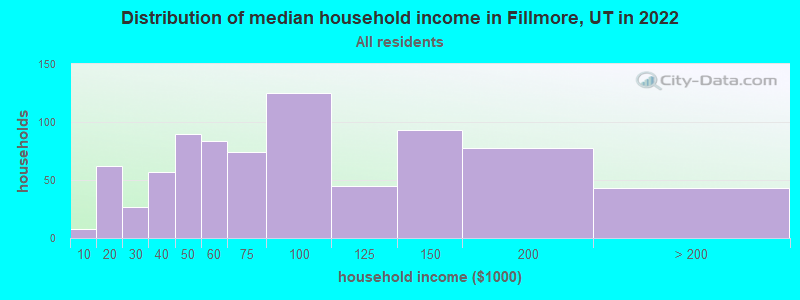
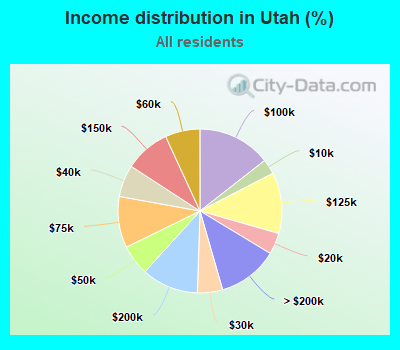
Income statistics for all residents
Median household income in Fillmore, UT in 2022:
Fillmore:
$73,166
State:
$89,168
Change in median household income between 2000 and 2022:
Fillmore, Utah:
+130.7%
Utah:
+95.0%
Number of households with income < $10k:
Fillmore:
1.0% (8)
State:
3.0% (33,488)
Number of households with income $10k - 20k:
Fillmore:
7.9% (62)
Utah:
4.2% (47,659)
Number of households with income $20k - 30k:
Fillmore:
3.4% (27)
State:
5.0% (55,999)
Number of households with income $30k - 40k:
Fillmore:
7.3% (57)
State:
6.3% (71,296)
Number of households with income $40k - 50k:
Fillmore:
11.5% (90)
State:
6.0% (68,315)
Number of households with income $50k - 60k:
Fillmore:
10.7% (84)
Utah:
6.9% (77,538)
Number of households with income $60k - 75k:
Fillmore:
9.4% (74)
State:
10.1% (114,168)
Number of households with income $75k - 100k:
Fillmore:
15.9% (125)
State:
14.4% (163,156)
Number of households with income $100k - 125k:
Fillmore:
5.7% (45)
State:
12.0% (135,990)
Number of households with income $125k - 150k:
Fillmore:
11.8% (93)
State:
9.0% (101,240)
Number of households with income $150k - 200k:
Fillmore:
9.9% (78)
State:
11.2% (126,570)
Number of households with income > $200k:
Fillmore:
5.5% (43)
State:
11.9% (134,241)
Aggregate household income in Fillmore in 2022: $73,547,884
Median family income in Fillmore in 2022:
Fillmore:
$79,080
Utah:
$102,177
Number of families with income < $10k:
Fillmore:
2.9% (19)
State:
2.0% (16,364)
Number of families with income $10k - 20k:
Fillmore:
7.7% (50)
State:
2.3% (18,773)
Number of families with income $20k - 30k:
Fillmore:
3.8% (25)
Utah:
3.3% (27,809)
Number of families with income $30k - 40k:
Fillmore:
4.0% (26)
Utah:
4.7% (38,795)
Number of families with income $40k - 50k:
Fillmore:
8.9% (58)
Utah:
5.0% (41,732)
Number of families with income $50k - 60k:
Fillmore:
9.8% (64)
Utah:
6.3% (52,232)
Number of families with income $60k - 75k:
Fillmore:
9.0% (59)
State:
10.0% (83,144)
Number of families with income $75k - 100k:
Fillmore:
15.2% (99)
State:
15.0% (124,641)
Number of families with income $100k - 125k:
Fillmore:
6.2% (40)
State:
13.7% (113,484)
Number of families with income $125k - 150k:
Fillmore:
14.4% (94)
State:
10.6% (87,750)
Number of families with income $150k - 200k:
Fillmore:
11.6% (76)
State:
13.1% (108,726)
Number of families with income > $200k:
Fillmore:
6.5% (42)
State:
14.1% (117,149)
Median non-family income in Fillmore in 2022:
Fillmore:
$48,003
Utah:
$51,496
Median per capita income in Fillmore in 2022:
Fillmore:
$27,501
State:
$38,514
Change in median per capita income between 2000 and 2022:
Fillmore, Utah:
+128.0%
Utah:
+111.8%
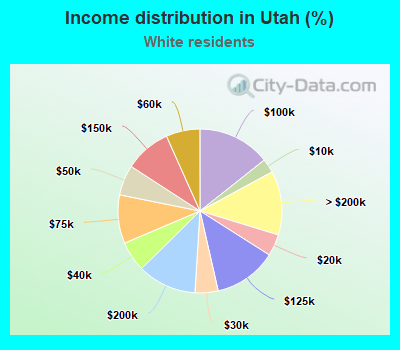
Income statistics for White residents
Median household income in Fillmore, UT in 2022:
Fillmore:
$72,550
State:
$92,391
Change in median household income between 2000 and 2022:
Fillmore, Utah:
+124.0%
State:
+98.1%
Number of households with income < $10k:
Fillmore:
1.3% (8)
State:
2.8% (26,009)
Number of households with income $10k - 20k:
Fillmore:
5.2% (32)
State:
4.3% (40,322)
Number of households with income $20k - 30k:
Fillmore:
3.6% (22)
State:
4.6% (42,908)
Number of households with income $30k - 40k:
Fillmore:
8.3% (51)
State:
6.0% (56,214)
Number of households with income $40k - 50k:
Fillmore:
12.9% (80)
State:
6.0% (56,454)
Number of households with income $50k - 60k:
Fillmore:
12.0% (74)
Utah:
6.7% (63,011)
Number of households with income $60k - 75k:
Fillmore:
8.3% (51)
State:
9.6% (90,095)
Number of households with income $75k - 100k:
Fillmore:
17.6% (109)
Utah:
14.3% (135,141)
Number of households with income $100k - 125k:
Fillmore:
7.1% (44)
State:
12.4% (117,040)
Number of households with income $125k - 150k:
Fillmore:
4.7% (29)
Utah:
9.2% (86,215)
Number of households with income $150k - 200k:
Fillmore:
12.3% (76)
State:
11.6% (109,741)
Number of households with income > $200k:
Fillmore:
6.8% (42)
State:
12.6% (118,969)
Aggregate household income in Fillmore in 2022: $58,705,102
Median family income in Fillmore in 2022:
Fillmore:
$79,745
State:
$106,188
Number of families with income < $10k:
Fillmore:
3.7% (19)
State:
1.7% (12,014)
Number of families with income $10k - 20k:
Fillmore:
5.4% (27)
State:
2.1% (14,402)
Number of families with income $20k - 30k:
Fillmore:
4.0% (20)
State:
2.8% (19,461)
Number of families with income $30k - 40k:
Fillmore:
4.2% (21)
Utah:
4.2% (28,654)
Number of families with income $40k - 50k:
Fillmore:
9.7% (48)
State:
4.8% (33,337)
Number of families with income $50k - 60k:
Fillmore:
9.6% (48)
State:
5.8% (40,104)
Number of families with income $60k - 75k:
Fillmore:
7.3% (36)
State:
9.3% (63,976)
Number of families with income $75k - 100k:
Fillmore:
19.3% (97)
Utah:
15.1% (103,561)
Number of families with income $100k - 125k:
Fillmore:
7.9% (39)
State:
14.3% (98,194)
Number of families with income $125k - 150k:
Fillmore:
5.9% (29)
State:
10.9% (75,223)
Number of families with income $150k - 200k:
Fillmore:
14.8% (74)
State:
13.8% (94,743)
Number of families with income > $200k:
Fillmore:
8.2% (41)
State:
15.2% (104,236)
Median non-family income in Fillmore in 2022:
Fillmore:
$49,361
State:
$52,493
Median per capita income in Fillmore in 2022:
Fillmore:
$30,583
State:
$41,454
Change in median per capita income between 2000 and 2022:
Fillmore, Utah:
+141.3%
Utah:
+118.4%
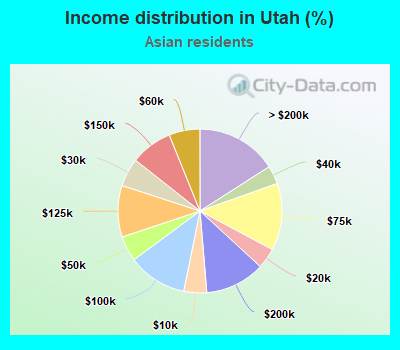
Income statistics for Asian residents
Number of households with income < $10k:
Fillmore:
0.0% (0)
Utah:
4.5% (1,220)
Number of households with income $10k - 20k:
Fillmore:
0.0% (0)
State:
4.1% (1,101)
Number of households with income $20k - 30k:
Fillmore:
0.0% (0)
State:
5.6% (1,510)
Number of households with income $30k - 40k:
Fillmore:
26.7% (4)
State:
3.6% (982)
Number of households with income $40k - 50k:
Fillmore:
0.0% (0)
State:
5.0% (1,350)
Number of households with income $50k - 60k:
Fillmore:
0.0% (0)
State:
6.1% (1,646)
Number of households with income $60k - 75k:
Fillmore:
0.0% (0)
State:
13.2% (3,571)
Number of households with income $75k - 100k:
Fillmore:
73.3% (11)
State:
11.7% (3,153)
Number of households with income $100k - 125k:
Fillmore:
0.0% (0)
Utah:
10.2% (2,743)
Number of households with income $125k - 150k:
Fillmore:
0.0% (0)
State:
8.3% (2,232)
Number of households with income $150k - 200k:
Fillmore:
0.0% (0)
Utah:
11.8% (3,185)
Number of households with income > $200k:
Fillmore:
0.0% (0)
State:
15.9% (4,302)
Aggregate household income in Fillmore in 2022: $2,532,063
Median per capita income in Fillmore in 2022:
Fillmore:
$13,095
State:
$44,003
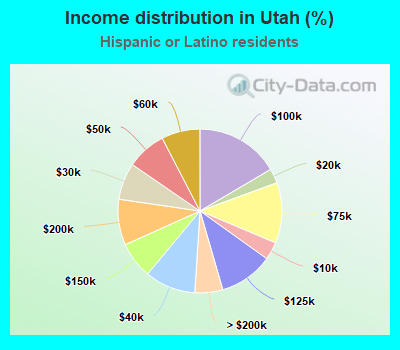
Income statistics for Hispanic or Latino residents
Number of households with income < $10k:
Fillmore:
0.0% (0)
State:
3.5% (4,767)
Number of households with income $10k - 20k:
Fillmore:
21.9% (32)
State:
2.9% (3,889)
Number of households with income $20k - 30k:
Fillmore:
2.1% (3)
Utah:
7.3% (9,868)
Number of households with income $30k - 40k:
Fillmore:
0.0% (0)
State:
10.0% (13,583)
Number of households with income $40k - 50k:
Fillmore:
6.2% (9)
State:
7.8% (10,555)
Number of households with income $50k - 60k:
Fillmore:
7.5% (11)
Utah:
7.6% (10,305)
Number of households with income $60k - 75k:
Fillmore:
14.4% (21)
State:
12.0% (16,184)
Number of households with income $75k - 100k:
Fillmore:
0.0% (0)
State:
16.5% (22,406)
Number of households with income $100k - 125k:
Fillmore:
0.0% (0)
State:
10.6% (14,387)
Number of households with income $125k - 150k:
Fillmore:
47.9% (70)
Utah:
7.2% (9,794)
Number of households with income $150k - 200k:
Fillmore:
0.0% (0)
State:
9.0% (12,222)
Number of households with income > $200k:
Fillmore:
0.0% (0)
State:
5.5% (7,452)
Aggregate household income in Fillmore in 2022: $13,092,330
Median per capita income in Fillmore in 2022:
Fillmore:
$19,575
State:
$24,209
Income statistics for American Indian and Alaska Native residents
Aggregate household income in Fillmore in 2022: $1,664,710
Median per capita income in Fillmore in 2022:
Fillmore:
$38,896
Utah:
$26,201
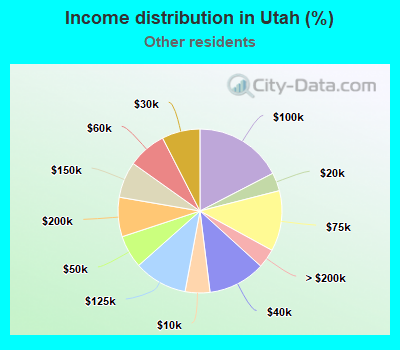
Income statistics for other residents
Number of households with income < $10k:
Fillmore:
0.0% (0)
State:
4.9% (2,640)
Number of households with income $10k - 20k:
Fillmore:
21.3% (32)
State:
3.6% (1,953)
Number of households with income $20k - 30k:
Fillmore:
2.0% (3)
State:
7.5% (4,068)
Number of households with income $30k - 40k:
Fillmore:
0.0% (0)
State:
11.3% (6,097)
Number of households with income $40k - 50k:
Fillmore:
6.7% (10)
State:
6.5% (3,496)
Number of households with income $50k - 60k:
Fillmore:
0.0% (0)
Utah:
7.6% (4,115)
Number of households with income $60k - 75k:
Fillmore:
14.7% (22)
Utah:
12.0% (6,454)
Number of households with income $75k - 100k:
Fillmore:
0.0% (0)
Utah:
17.4% (9,392)
Number of households with income $100k - 125k:
Fillmore:
0.0% (0)
State:
10.5% (5,675)
Number of households with income $125k - 150k:
Fillmore:
55.3% (83)
Utah:
7.1% (3,847)
Number of households with income $150k - 200k:
Fillmore:
0.0% (0)
State:
7.8% (4,200)
Number of households with income > $200k:
Fillmore:
0.0% (0)
State:
3.8% (2,030)
Aggregate household income in Fillmore in 2022: $12,963,307
Median per capita income in Fillmore in 2022:
Fillmore:
$21,335
Utah:
$22,765
Discuss Fillmore, Utah (UT) on our hugely popular Utah forum.