The median household income in Folly Beach, SC in 2022 was $90,226, which was 28.9% greater than the median annual income of $64,115 across the entire state of South Carolina. Compared to the median income of $46,935 in 2000 this represents an increase of 48.0%. The per capita income in 2022 was $63,053, which means an increase of 51.6% compared to 2000 when it was $30,493.
Whole page based on the data from 2000 / 2022 when the population of Folly Beach, South Carolina was 2,116 / 1,043
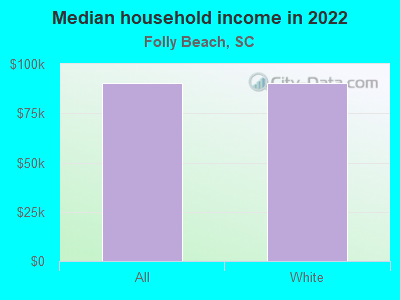
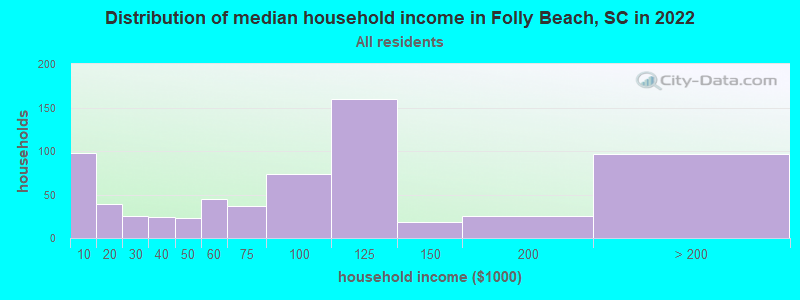
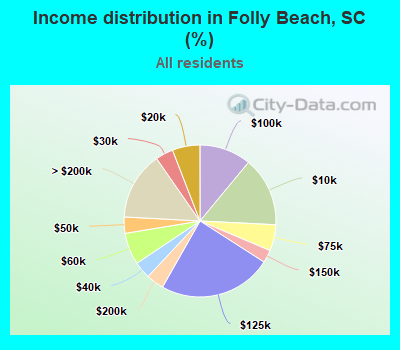
Income statistics for all residents
Median household income in Folly Beach, SC in 2022:
Folly Beach:
$90,226
State:
$64,115
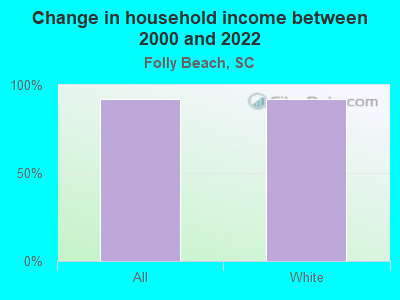
Change in median household income between 2000 and 2022:
Folly Beach, South Carolina:
+92.2%
State:
+72.9%
Number of households with income < $10k:
Folly Beach:
14.8% (98)
South Carolina:
6.1% (130,922)
Number of households with income $10k - 20k:
Folly Beach:
5.9% (39)
State:
7.9% (168,918)
Number of households with income $20k - 30k:
Folly Beach:
3.8% (25)
State:
8.0% (171,564)
Number of households with income $30k - 40k:
Folly Beach:
3.6% (24)
State:
9.2% (195,662)
Number of households with income $40k - 50k:
Folly Beach:
3.5% (23)
State:
8.2% (176,179)
Number of households with income $50k - 60k:
Folly Beach:
6.8% (45)
State:
7.5% (159,159)
Number of households with income $60k - 75k:
Folly Beach:
5.6% (37)
State:
9.9% (211,862)
Number of households with income $75k - 100k:
Folly Beach:
11.0% (73)
State:
13.5% (287,601)
Number of households with income $100k - 125k:
Folly Beach:
24.1% (160)
State:
9.3% (199,068)
Number of households with income $125k - 150k:
Folly Beach:
2.7% (18)
State:
6.2% (133,330)
Number of households with income $150k - 200k:
Folly Beach:
3.8% (25)
South Carolina:
6.6% (141,363)
Number of households with income > $200k:
Folly Beach:
14.5% (96)
State:
7.5% (160,452)
Aggregate household income in Folly Beach in 2022: $64,161,064
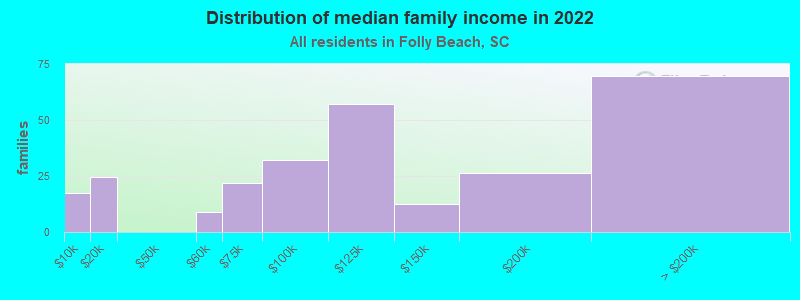
Median family income in Folly Beach in 2022:
Folly Beach:
$109,572
State:
$79,886
Number of families with income < $10k:
Folly Beach:
6.5% (18)
State:
3.7% (51,214)
Number of families with income $10k - 20k:
Folly Beach:
9.0% (24)
South Carolina:
4.5% (63,460)
Number of families with income $50k - 60k:
Folly Beach:
3.3% (9)
State:
7.1% (98,803)
Number of families with income $60k - 75k:
Folly Beach:
8.2% (22)
State:
9.9% (138,412)
Number of families with income $75k - 100k:
Folly Beach:
11.8% (32)
State:
15.4% (214,716)
Number of families with income $100k - 125k:
Folly Beach:
21.2% (57)
South Carolina:
11.4% (159,999)
Number of families with income $125k - 150k:
Folly Beach:
4.6% (12)
State:
8.0% (112,152)
Number of families with income $150k - 200k:
Folly Beach:
9.8% (26)
South Carolina:
8.8% (123,525)
Number of families with income > $200k:
Folly Beach:
25.7% (70)
State:
10.1% (140,575)
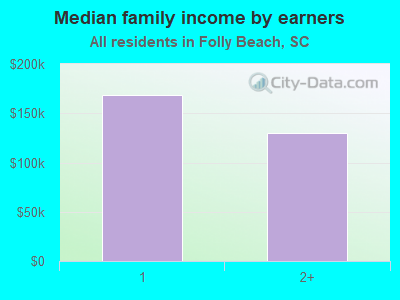
Median income for 2 person families:
Folly Beach:
$107,578
State:
$71,914
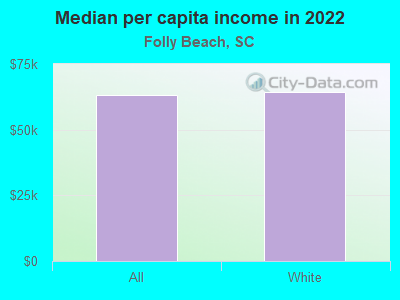
Median per capita income in Folly Beach in 2022:
Folly Beach:
$63,053
State:
$36,675
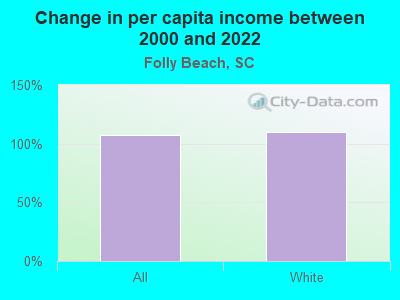
Change in median per capita income between 2000 and 2022:
Folly Beach, South Carolina:
+106.8%
South Carolina:
+95.1%
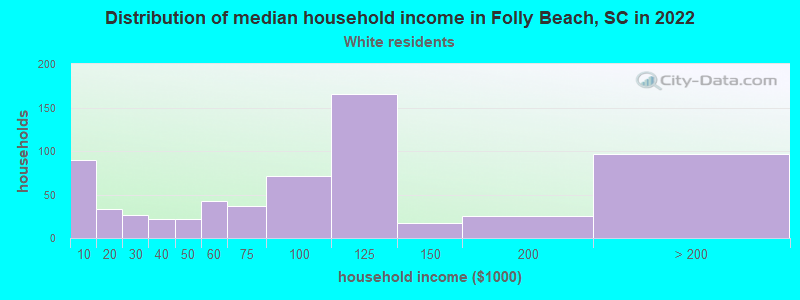
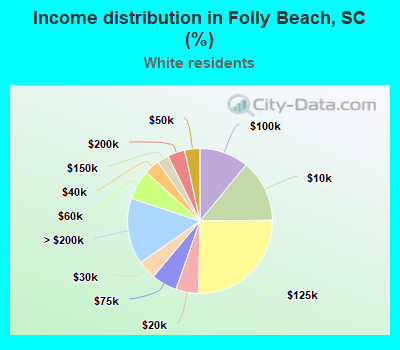
Income statistics for White residents
Median household income in Folly Beach, SC in 2022:
Folly Beach:
$90,349
South Carolina:
$73,516
Change in median household income between 2000 and 2022:
Folly Beach, South Carolina:
+92.0%
South Carolina:
+74.8%
Number of households with income < $10k:
Folly Beach:
13.9% (90)
State:
4.8% (68,379)
Number of households with income $10k - 20k:
Folly Beach:
5.1% (33)
State:
5.9% (85,105)
Number of households with income $20k - 30k:
Folly Beach:
4.2% (27)
South Carolina:
7.1% (101,178)
Number of households with income $30k - 40k:
Folly Beach:
3.4% (22)
State:
8.0% (114,877)
Number of households with income $40k - 50k:
Folly Beach:
3.4% (22)
South Carolina:
7.9% (112,749)
Number of households with income $50k - 60k:
Folly Beach:
6.6% (43)
State:
7.1% (101,835)
Number of households with income $60k - 75k:
Folly Beach:
5.7% (37)
South Carolina:
10.2% (145,879)
Number of households with income $75k - 100k:
Folly Beach:
11.0% (71)
State:
14.0% (200,068)
Number of households with income $100k - 125k:
Folly Beach:
25.5% (165)
State:
10.4% (148,542)
Number of households with income $125k - 150k:
Folly Beach:
2.6% (17)
State:
7.3% (105,118)
Number of households with income $150k - 200k:
Folly Beach:
3.9% (25)
State:
8.0% (114,506)
Number of households with income > $200k:
Folly Beach:
14.8% (96)
State:
9.3% (133,550)
Aggregate household income in Folly Beach in 2022: $64,929,305
Median family income in Folly Beach in 2022:
Folly Beach:
$107,414
State:
$90,709
Number of families with income < $10k:
Folly Beach:
6.4% (17)
State:
2.4% (22,376)
Number of families with income $10k - 20k:
Folly Beach:
8.2% (22)
South Carolina:
3.0% (28,325)
Number of families with income $50k - 60k:
Folly Beach:
3.3% (9)
State:
6.6% (62,489)
Number of families with income $60k - 75k:
Folly Beach:
7.5% (20)
State:
10.0% (94,724)
Number of families with income $75k - 100k:
Folly Beach:
11.7% (31)
State:
15.5% (147,207)
Number of families with income $100k - 125k:
Folly Beach:
22.8% (61)
State:
12.5% (118,160)
Number of families with income $125k - 150k:
Folly Beach:
4.7% (13)
State:
9.5% (90,395)
Number of families with income $150k - 200k:
Folly Beach:
9.4% (25)
State:
10.6% (100,043)
Number of families with income > $200k:
Folly Beach:
25.9% (69)
State:
12.4% (117,500)
Median per capita income in Folly Beach in 2022:
Folly Beach:
$64,476
State:
$42,728
Change in median per capita income between 2000 and 2022:
Folly Beach, South Carolina:
+109.8%
State:
+93.4%
Discuss Folly Beach, South Carolina (SC) on our hugely popular South Carolina forum.