The median household income in Gallaway, TN in 2022 was $31,769, which was 105.4% less than the median annual income of $65,254 across the entire state of Tennessee. Compared to the median income of $15,192 in 2000 this represents an increase of 52.2%. The per capita income in 2022 was $17,009, which means an increase of 24.5% compared to 2000 when it was $12,836.
Whole page based on the data from 2000 / 2022 when the population of Gallaway, Tennessee was 666 / 676
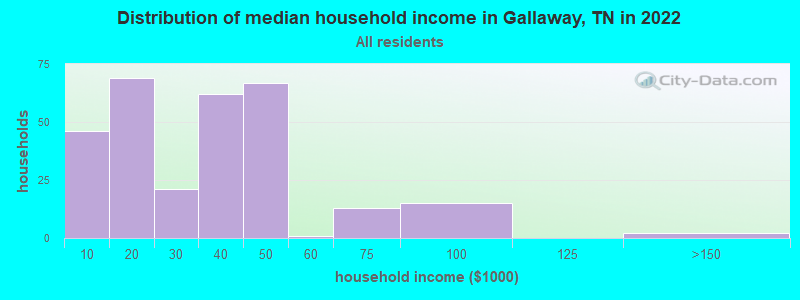
Income statistics for all residents
Median household income in Gallaway, TN in 2022:
Gallaway:
$31,769
Tennessee:
$65,254
Change in median household income between 2000 and 2022:
Gallaway, Tennessee:
+109.1%
Tennessee:
+79.5%
Number of households with income < $10k:
Gallaway:
15.5% (46)
State:
5.4% (154,793)
Number of households with income $10k - 20k:
Gallaway:
23.3% (69)
State:
8.0% (228,599)
Number of households with income $20k - 30k:
Gallaway:
7.1% (21)
State:
7.9% (224,908)
Number of households with income $30k - 40k:
Gallaway:
20.9% (62)
State:
8.6% (244,297)
Number of households with income $40k - 50k:
Gallaway:
22.6% (67)
Tennessee:
8.4% (238,949)
Number of households with income $50k - 60k:
Gallaway:
0.3% (1)
Tennessee:
7.7% (218,438)
Number of households with income $60k - 75k:
Gallaway:
4.4% (13)
Tennessee:
10.3% (294,172)
Number of households with income $75k - 100k:
Gallaway:
5.1% (15)
State:
13.3% (377,310)
Number of households with income $100k - 125k:
Gallaway:
0.0% (0)
State:
9.5% (269,124)
Number of households with income $125k - 150k:
Gallaway:
0.7% (2)
State:
6.3% (178,328)
Number of households with income $150k - 200k:
Gallaway:
0.0% (0)
State:
7.2% (204,030)
Number of households with income > $200k:
Gallaway:
0.0% (0)
State:
7.5% (213,736)
Aggregate household income in Gallaway in 2022: $9,257,935
Median family income in Gallaway in 2022:
Gallaway:
$34,528
Tennessee:
$80,910
Number of families with income < $10k:
Gallaway:
4.7% (7)
State:
3.9% (72,917)
Number of families with income $10k - 20k:
Gallaway:
20.0% (30)
Tennessee:
4.0% (73,770)
Number of families with income $30k - 40k:
Gallaway:
37.2% (55)
Tennessee:
7.2% (133,292)
Number of families with income $40k - 50k:
Gallaway:
18.2% (27)
Tennessee:
7.4% (136,997)
Number of families with income $50k - 60k:
Gallaway:
0.7% (1)
Tennessee:
7.1% (131,374)
Number of families with income $60k - 75k:
Gallaway:
8.1% (12)
State:
10.8% (198,685)
Number of families with income $75k - 100k:
Gallaway:
9.8% (15)
State:
15.1% (279,195)
Number of families with income $125k - 150k:
Gallaway:
1.4% (2)
Tennessee:
7.8% (144,000)
Median non-family income in Gallaway in 2022:
Gallaway:
$19,133
State:
$40,285
Change in median non-family income between 2000 and 2022:
Gallaway, Tennessee:
+143.5%
Tennessee:
+91.5%
Median per capita income in Gallaway in 2022:
Gallaway:
$17,010
State:
$36,704
Change in median per capita income between 2000 and 2022:
Gallaway, Tennessee:
+32.5%
State:
+89.3%
Income statistics for White residents
Median household income in Gallaway, TN in 2022:
Gallaway:
$32,632
State:
$69,826
Change in median household income between 2000 and 2022:
Gallaway, Tennessee:
+43.0%
Tennessee:
+82.9%
Number of households with income < $10k:
Gallaway:
0.0% (0)
State:
4.6% (100,279)
Number of households with income $10k - 20k:
Gallaway:
0.0% (0)
Tennessee:
7.6% (165,031)
Number of households with income $20k - 30k:
Gallaway:
22.0% (9)
State:
7.4% (160,229)
Number of households with income $30k - 40k:
Gallaway:
48.8% (20)
Tennessee:
8.1% (174,784)
Number of households with income $40k - 50k:
Gallaway:
0.0% (0)
State:
7.8% (169,622)
Number of households with income $50k - 60k:
Gallaway:
2.4% (1)
State:
7.6% (165,508)
Number of households with income $60k - 75k:
Gallaway:
26.8% (11)
Tennessee:
10.3% (223,937)
Number of households with income $75k - 100k:
Gallaway:
0.0% (0)
State:
13.5% (292,688)
Number of households with income $100k - 125k:
Gallaway:
0.0% (0)
State:
10.1% (219,251)
Number of households with income $125k - 150k:
Gallaway:
0.0% (0)
Tennessee:
6.6% (142,574)
Number of households with income $150k - 200k:
Gallaway:
0.0% (0)
State:
7.7% (166,039)
Number of households with income > $200k:
Gallaway:
0.0% (0)
Tennessee:
8.5% (184,546)
Aggregate household income in Gallaway in 2022: $1,750,980
Median non-family income in Gallaway in 2022:
Gallaway:
$30,156
State:
$41,178
Median per capita income in Gallaway in 2022:
Gallaway:
$21,036
Tennessee:
$40,126
Change in median per capita income between 2000 and 2022:
Gallaway, Tennessee:
+72.2%
State:
+92.6%
Income statistics for Black or African American residents
Number of households with income < $10k:
Gallaway:
18.7% (43)
State:
9.1% (39,909)
Number of households with income $10k - 20k:
Gallaway:
26.1% (60)
Tennessee:
10.5% (46,276)
Number of households with income $20k - 30k:
Gallaway:
3.0% (7)
State:
10.2% (45,072)
Number of households with income $30k - 40k:
Gallaway:
17.0% (39)
State:
10.0% (43,885)
Number of households with income $40k - 50k:
Gallaway:
28.3% (65)
State:
10.7% (47,267)
Number of households with income $50k - 60k:
Gallaway:
0.0% (0)
Tennessee:
7.7% (33,868)
Number of households with income $60k - 75k:
Gallaway:
0.0% (0)
Tennessee:
10.5% (46,247)
Number of households with income $75k - 100k:
Gallaway:
7.0% (16)
State:
12.6% (55,465)
Number of households with income $100k - 125k:
Gallaway:
0.0% (0)
State:
6.7% (29,515)
Number of households with income $125k - 150k:
Gallaway:
0.0% (0)
State:
4.8% (21,306)
Number of households with income $150k - 200k:
Gallaway:
0.0% (0)
State:
4.6% (20,425)
Number of households with income > $200k:
Gallaway:
0.0% (0)
Tennessee:
2.5% (11,183)
Aggregate household income in Gallaway in 2022: $6,639,368
Median family income in Gallaway in 2022:
Gallaway:
$35,681
State:
$61,153
Number of families with income < $10k:
Gallaway:
5.9% (7)
State:
7.9% (20,476)
Number of families with income $10k - 20k:
Gallaway:
22.1% (25)
State:
6.0% (15,530)
Number of families with income $30k - 40k:
Gallaway:
34.6% (39)
State:
9.3% (24,089)
Number of families with income $40k - 50k:
Gallaway:
23.6% (26)
State:
10.2% (26,463)
Number of families with income $75k - 100k:
Gallaway:
13.9% (15)
Tennessee:
14.7% (38,065)
Median non-family income in Gallaway in 2022:
Gallaway:
$16,821
State:
$35,793
Median per capita income in Gallaway in 2022:
Gallaway:
$14,663
State:
$27,306
Change in median per capita income between 2000 and 2022:
Gallaway, Tennessee:
+10.2%
Tennessee:
+105.3%
Income statistics for Asian residents
Aggregate household income in Gallaway in 2022: $254,807
Median per capita income in Gallaway in 2022:
Gallaway:
$13,522
State:
$46,931
Change in median per capita income between 2000 and 2022:
Gallaway, Tennessee:
+84.4%
State:
+130.8%
Income statistics for Multirace residents
Number of households with income < $10k:
Gallaway:
0.0% (0)
Tennessee:
6.7% (9,867)
Number of households with income $10k - 20k:
Gallaway:
0.0% (0)
State:
8.6% (12,639)
Number of households with income $20k - 30k:
Gallaway:
0.0% (0)
State:
9.2% (13,555)
Number of households with income $30k - 40k:
Gallaway:
0.0% (0)
State:
10.3% (15,117)
Number of households with income $40k - 50k:
Gallaway:
66.7% (10)
State:
9.4% (13,829)
Number of households with income $50k - 60k:
Gallaway:
0.0% (0)
Tennessee:
7.5% (10,969)
Number of households with income $60k - 75k:
Gallaway:
6.7% (1)
State:
9.2% (13,568)
Number of households with income $75k - 100k:
Gallaway:
0.0% (0)
Tennessee:
12.6% (18,516)
Number of households with income $100k - 125k:
Gallaway:
0.0% (0)
State:
8.6% (12,656)
Number of households with income $125k - 150k:
Gallaway:
26.7% (4)
State:
5.9% (8,674)
Number of households with income $150k - 200k:
Gallaway:
0.0% (0)
State:
7.2% (10,611)
Number of households with income > $200k:
Gallaway:
0.0% (0)
Tennessee:
4.8% (6,986)
Aggregate household income in Gallaway in 2022: $808,655
Median per capita income in Gallaway in 2022:
Gallaway:
$49,720
State:
$24,436
Discuss Gallaway, Tennessee (TN) on our hugely popular Tennessee forum.