The median household income in Garberville, CA in 2022 was $56,396, which was 62.3% less than the median annual income of $91,551 across the entire state of California. Compared to the median income of $30,424 in 2000 this represents an increase of 46.1%. The per capita income in 2022 was $33,225, which means an increase of 52.1% compared to 2000 when it was $15,929.
Income statistics for all residents
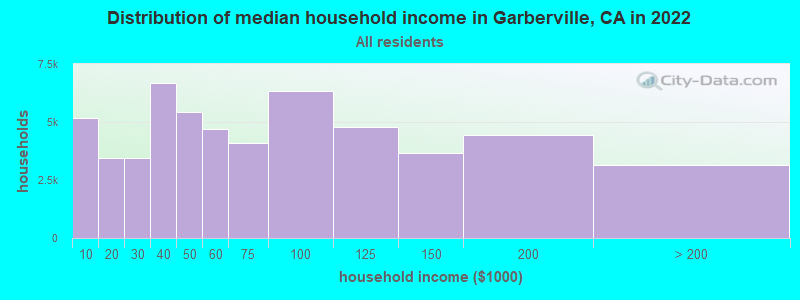
Median household income in Garberville, CA in 2022:
Garberville:
$56,396
California:
$91,551
Change in median household income between 2000 and 2022:
Garberville, California:
+85.4%
State:
+92.8%
Number of households with income < $10k:
Garberville:
9.4% (5,186)
State:
4.8% (654,370)
Number of households with income $10k - 20k:
Garberville:
6.3% (3,464)
California:
5.8% (789,493)
Number of households with income $20k - 30k:
Garberville:
6.3% (3,465)
State:
5.7% (778,318)
Number of households with income $30k - 40k:
Garberville:
12.1% (6,668)
State:
5.8% (783,170)
Number of households with income $40k - 50k:
Garberville:
9.8% (5,423)
California:
5.8% (781,352)
Number of households with income $50k - 60k:
Garberville:
8.5% (4,710)
California:
5.6% (760,175)
Number of households with income $60k - 75k:
Garberville:
7.4% (4,074)
State:
8.2% (1,104,699)
Number of households with income $75k - 100k:
Garberville:
11.4% (6,317)
California:
12.0% (1,627,633)
Number of households with income $100k - 125k:
Garberville:
8.6% (4,776)
State:
10.0% (1,358,619)
Number of households with income $125k - 150k:
Garberville:
6.6% (3,666)
California:
7.6% (1,027,455)
Number of households with income $150k - 200k:
Garberville:
8.0% (4,440)
California:
10.6% (1,439,811)
Number of households with income > $200k:
Garberville:
5.7% (3,138)
State:
18.0% (2,445,491)
Aggregate household income in Garberville in 2022: $415,246,330
Median family income in Garberville in 2022:
Garberville:
$78,986
State:
$104,823
Median non-family income in Garberville in 2022:
Garberville:
$37,732
State:
$59,348
Change in median non-family income between 2000 and 2022:
Garberville, California:
+92.1%
State:
+85.3%
Median per capita income in Garberville in 2022:
Garberville:
$33,226
State:
$46,661
Change in median per capita income between 2000 and 2022:
Garberville, California:
+108.6%
State:
+105.5%
Income statistics for White residents
Median household income in Garberville, CA in 2022:
Garberville:
$55,938
State:
$100,917
Change in median household income between 2000 and 2022:
Garberville, California:
+81.5%
California:
+96.8%
Number of households with income < $10k:
Garberville:
9.7% (4,303)
State:
4.4% (284,109)
Number of households with income $10k - 20k:
Garberville:
5.8% (2,548)
State:
5.3% (340,330)
Number of households with income $20k - 30k:
Garberville:
6.5% (2,860)
State:
5.3% (343,145)
Number of households with income $30k - 40k:
Garberville:
12.6% (5,591)
California:
5.1% (330,146)
Number of households with income $40k - 50k:
Garberville:
8.7% (3,875)
State:
5.2% (335,310)
Number of households with income $50k - 60k:
Garberville:
9.1% (4,045)
State:
5.1% (326,299)
Number of households with income $60k - 75k:
Garberville:
7.4% (3,257)
California:
7.6% (487,640)
Number of households with income $75k - 100k:
Garberville:
11.7% (5,188)
State:
11.5% (736,578)
Number of households with income $100k - 125k:
Garberville:
7.8% (3,457)
State:
10.1% (648,782)
Number of households with income $125k - 150k:
Garberville:
7.5% (3,333)
State:
7.8% (499,671)
Number of households with income $150k - 200k:
Garberville:
7.6% (3,382)
California:
11.4% (729,603)
Number of households with income > $200k:
Garberville:
5.6% (2,470)
California:
21.2% (1,364,246)
Aggregate household income in Garberville in 2022: $338,063,571
Median family income in Garberville in 2022:
Garberville:
$77,098
State:
$125,379
Number of families with income < $10k:
Garberville:
5.7% (118)
State:
2.2% (87,079)
Number of families with income $10k - 20k:
Garberville:
4.3% (89)
California:
2.5% (97,716)
Number of families with income $20k - 30k:
Garberville:
4.6% (95)
State:
3.5% (137,295)
Number of families with income $30k - 40k:
Garberville:
12.5% (260)
California:
3.9% (152,947)
Number of families with income $40k - 50k:
Garberville:
14.3% (296)
State:
4.3% (169,197)
Number of families with income $50k - 60k:
Garberville:
13.7% (284)
State:
4.5% (176,192)
Number of families with income $60k - 75k:
Garberville:
7.2% (150)
California:
7.0% (274,752)
Number of families with income $75k - 100k:
Garberville:
6.7% (140)
State:
11.3% (445,632)
Number of families with income $100k - 125k:
Garberville:
4.4% (92)
State:
10.7% (423,630)
Number of families with income $125k - 150k:
Garberville:
15.4% (320)
State:
9.1% (357,408)
Number of families with income $150k - 200k:
Garberville:
1.7% (36)
State:
13.5% (532,693)
Number of families with income > $200k:
Garberville:
9.5% (198)
California:
27.6% (1,086,948)
Median non-family income in Garberville in 2022:
Garberville:
$37,593
California:
$62,819
Change in median non-family income between 2000 and 2022:
Garberville, California:
+87.1%
State:
+84.4%
Median per capita income in Garberville in 2022:
Garberville:
$34,745
State:
$61,706
Change in median per capita income between 2000 and 2022:
Garberville, California:
+107.7%
California:
+122.7%
Income statistics for Black or African American residents
Median household income in Garberville, CA in 2022:
Garberville:
$299,867
State:
$63,268
Number of households with income < $10k:
Garberville:
9.0% (56,268)
State:
9.0% (73,219)
Number of households with income $10k - 20k:
Garberville:
10.6% (66,599)
State:
10.6% (86,666)
Number of households with income $20k - 30k:
Garberville:
7.1% (44,348)
State:
7.1% (57,719)
Number of households with income $30k - 40k:
Garberville:
7.2% (45,154)
California:
7.2% (58,714)
Number of households with income $40k - 50k:
Garberville:
7.1% (44,606)
State:
7.1% (58,075)
Number of households with income $50k - 60k:
Garberville:
6.8% (42,482)
State:
6.8% (55,229)
Number of households with income $60k - 75k:
Garberville:
8.8% (55,205)
California:
8.8% (71,895)
Number of households with income $75k - 100k:
Garberville:
11.9% (74,449)
State:
11.9% (96,893)
Number of households with income $100k - 125k:
Garberville:
8.7% (54,300)
State:
8.7% (70,729)
Number of households with income $125k - 150k:
Garberville:
6.3% (39,371)
State:
6.3% (51,211)
Number of households with income $150k - 200k:
Garberville:
7.2% (45,100)
State:
7.2% (58,687)
Number of households with income > $200k:
Garberville:
9.3% (57,965)
California:
9.3% (75,487)
Aggregate household income in Garberville in 2022: $626,125
Median per capita income in Garberville in 2022:
Garberville:
$63,581
California:
$36,708
Income statistics for Asian residents
Median household income in Garberville, CA in 2022:
Garberville:
$63,149
State:
$119,861
Change in median household income between 2000 and 2022:
Garberville, California:
+119.6%
California:
+116.5%
Number of households with income < $10k:
Garberville:
5.1% (27,585)
State:
5.1% (106,273)
Number of households with income $10k - 20k:
Garberville:
4.9% (26,440)
State:
4.9% (101,815)
Number of households with income $20k - 30k:
Garberville:
4.6% (24,507)
State:
4.6% (94,414)
Number of households with income $30k - 40k:
Garberville:
4.1% (21,937)
State:
4.1% (84,491)
Number of households with income $40k - 50k:
Garberville:
4.0% (21,224)
State:
4.0% (81,758)
Number of households with income $50k - 60k:
Garberville:
3.9% (21,010)
State:
3.9% (80,971)
Number of households with income $60k - 75k:
Garberville:
6.0% (32,235)
California:
6.0% (124,194)
Number of households with income $75k - 100k:
Garberville:
9.7% (52,024)
State:
9.7% (200,337)
Number of households with income $100k - 125k:
Garberville:
9.4% (50,224)
California:
9.4% (193,488)
Number of households with income $125k - 150k:
Garberville:
7.7% (41,088)
California:
7.7% (158,253)
Number of households with income $150k - 200k:
Garberville:
12.2% (65,444)
California:
12.2% (252,139)
Number of households with income > $200k:
Garberville:
28.4% (152,255)
California:
28.4% (586,641)
Aggregate household income in Garberville in 2022: $10,050,486
Median family income in Garberville in 2022:
Garberville:
$185,822
California:
$136,040
Number of families with income < $10k:
Garberville:
20.6% (6)
California:
2.8% (42,046)
Number of families with income $10k - 20k:
Garberville:
29.3% (9)
California:
3.1% (46,821)
Number of families with income $20k - 30k:
Garberville:
7.3% (2)
State:
4.1% (61,519)
Number of families with income $30k - 40k:
Garberville:
32.6% (10)
State:
3.7% (55,234)
Number of families with income $40k - 50k:
Garberville:
6.2% (2)
State:
3.9% (58,471)
Number of families with income $50k - 60k:
Garberville:
4.0% (1)
California:
3.9% (58,911)
Median per capita income in Garberville in 2022:
Garberville:
$21,047
State:
$58,824
Change in median per capita income between 2000 and 2022:
Garberville, California:
+135.2%
State:
+166.8%
Income statistics for Hispanic or Latino residents
Median household income in Garberville, CA in 2022:
Garberville:
$42,977
State:
$75,698
Change in median household income between 2000 and 2022:
Garberville, California:
+138.8%
State:
+107.2%
Number of households with income < $10k:
Garberville:
4.3% (45,283)
State:
4.3% (183,294)
Number of households with income $10k - 20k:
Garberville:
6.0% (62,663)
California:
6.0% (253,903)
Number of households with income $20k - 30k:
Garberville:
6.8% (70,704)
State:
6.8% (286,386)
Number of households with income $30k - 40k:
Garberville:
7.4% (77,437)
California:
7.4% (313,728)
Number of households with income $40k - 50k:
Garberville:
7.4% (77,328)
State:
7.4% (313,199)
Number of households with income $50k - 60k:
Garberville:
7.2% (75,386)
State:
7.2% (305,366)
Number of households with income $60k - 75k:
Garberville:
10.3% (107,319)
State:
10.3% (434,937)
Number of households with income $75k - 100k:
Garberville:
14.4% (149,701)
California:
14.4% (607,302)
Number of households with income $100k - 125k:
Garberville:
10.6% (110,376)
State:
10.6% (447,424)
Number of households with income $125k - 150k:
Garberville:
7.5% (77,864)
State:
7.5% (316,022)
Number of households with income $150k - 200k:
Garberville:
9.1% (95,259)
State:
9.2% (386,269)
Number of households with income > $200k:
Garberville:
8.8% (91,982)
California:
8.8% (372,651)
Aggregate household income in Garberville in 2022: $19,995,850
Median family income in Garberville in 2022:
Garberville:
$47,568
State:
$77,589
Number of families with income < $10k:
Garberville:
8.8% (123)
State:
3.9% (129,468)
Number of families with income $10k - 20k:
Garberville:
13.2% (185)
California:
4.6% (151,997)
Number of families with income $20k - 30k:
Garberville:
13.1% (183)
State:
6.6% (216,764)
Number of families with income $30k - 40k:
Garberville:
15.2% (213)
State:
7.6% (249,849)
Number of families with income $40k - 50k:
Garberville:
16.4% (229)
State:
7.7% (254,822)
Number of families with income $50k - 60k:
Garberville:
11.1% (154)
State:
7.4% (244,815)
Number of families with income $60k - 75k:
Garberville:
10.1% (141)
California:
10.5% (345,838)
Number of families with income $75k - 100k:
Garberville:
4.2% (58)
State:
14.9% (491,589)
Number of families with income $100k - 125k:
Garberville:
1.4% (20)
California:
10.7% (355,400)
Number of families with income $125k - 150k:
Garberville:
2.9% (41)
State:
7.8% (259,317)
Number of families with income $150k - 200k:
Garberville:
0.3% (4)
State:
9.3% (306,566)
Number of families with income > $200k:
Garberville:
3.3% (46)
California:
9.1% (299,984)
Median non-family income in Garberville in 2022:
Garberville:
$37,094
California:
$49,746
Median per capita income in Garberville in 2022:
Garberville:
$12,303
State:
$27,240
Change in median per capita income between 2000 and 2022:
Garberville, California:
+89.1%
California:
+133.3%
Income statistics for American Indian and Alaska Native residents
Median household income in Garberville, CA in 2022:
Garberville:
$70,376
State:
$76,752
Change in median household income between 2000 and 2022:
Garberville, California:
+134.6%
State:
+110.0%
Number of households with income < $10k:
Garberville:
5.4% (3,462)
State:
5.4% (8,471)
Number of households with income $10k - 20k:
Garberville:
6.0% (3,820)
State:
6.0% (9,381)
Number of households with income $20k - 30k:
Garberville:
5.6% (3,588)
State:
5.5% (8,668)
Number of households with income $30k - 40k:
Garberville:
8.2% (5,264)
State:
8.3% (13,030)
Number of households with income $40k - 50k:
Garberville:
7.0% (4,454)
State:
6.9% (10,908)
Number of households with income $50k - 60k:
Garberville:
7.1% (4,553)
State:
7.1% (11,198)
Number of households with income $60k - 75k:
Garberville:
9.6% (6,149)
California:
9.6% (15,190)
Number of households with income $75k - 100k:
Garberville:
14.0% (8,983)
State:
14.1% (22,274)
Number of households with income $100k - 125k:
Garberville:
11.3% (7,217)
California:
11.2% (17,643)
Number of households with income $125k - 150k:
Garberville:
8.3% (5,288)
State:
8.3% (13,117)
Number of households with income $150k - 200k:
Garberville:
8.8% (5,619)
California:
8.8% (13,853)
Number of households with income > $200k:
Garberville:
8.8% (5,642)
California:
8.8% (13,925)
Aggregate household income in Garberville in 2022: $7,453,633
Median family income in Garberville in 2022:
Garberville:
$98,891
State:
$81,108
Number of families with income < $10k:
Garberville:
23.3% (15)
State:
5.0% (5,711)
Number of families with income $10k - 20k:
Garberville:
2.3% (1)
State:
3.7% (4,148)
Number of families with income $20k - 30k:
Garberville:
8.1% (5)
State:
4.3% (4,876)
Number of families with income $30k - 40k:
Garberville:
17.9% (11)
State:
8.8% (9,994)
Number of families with income $40k - 50k:
Garberville:
14.4% (9)
State:
7.8% (8,776)
Number of families with income $50k - 60k:
Garberville:
7.6% (5)
California:
6.9% (7,834)
Number of families with income $75k - 100k:
Garberville:
12.4% (8)
State:
14.8% (16,731)
Number of families with income $100k - 125k:
Garberville:
14.0% (9)
State:
12.0% (13,609)
Median non-family income in Garberville in 2022:
Garberville:
$130,529
State:
$51,296
Change in median non-family income between 2000 and 2022:
Garberville, California:
+80.0%
State:
+114.0%
Median per capita income in Garberville in 2022:
Garberville:
$22,368
California:
$30,289
Change in median per capita income between 2000 and 2022:
Garberville, California:
+127.6%
California:
+98.9%
Income statistics for Multirace residents
Median household income in Garberville, CA in 2022:
Garberville:
$61,209
State:
$83,153
Number of households with income < $10k:
Garberville:
3.8% (171)
State:
4.2% (85,299)
Number of households with income $10k - 20k:
Garberville:
13.2% (590)
California:
6.1% (122,966)
Number of households with income $20k - 30k:
Garberville:
2.7% (120)
State:
6.4% (129,328)
Number of households with income $30k - 40k:
Garberville:
8.4% (375)
State:
6.4% (130,070)
Number of households with income $40k - 50k:
Garberville:
15.8% (704)
State:
6.5% (131,254)
Number of households with income $50k - 60k:
Garberville:
4.4% (198)
California:
6.5% (132,382)
Number of households with income $60k - 75k:
Garberville:
14.3% (639)
State:
9.4% (191,472)
Number of households with income $75k - 100k:
Garberville:
17.1% (762)
State:
13.3% (269,691)
Number of households with income $100k - 125k:
Garberville:
9.2% (409)
California:
10.2% (207,286)
Number of households with income $125k - 150k:
Garberville:
1.9% (87)
State:
7.8% (158,259)
Number of households with income $150k - 200k:
Garberville:
6.1% (272)
State:
10.3% (209,227)
Number of households with income > $200k:
Garberville:
3.1% (138)
California:
13.0% (263,210)
Aggregate household income in Garberville in 2022: $25,040,788
Median family income in Garberville in 2022:
Garberville:
$55,706
State:
$87,642
Number of families with income < $10k:
Garberville:
10.0% (32)
State:
3.2% (48,017)
Number of families with income $10k - 20k:
Garberville:
15.0% (49)
California:
4.1% (60,419)
Number of families with income $20k - 30k:
Garberville:
5.8% (19)
State:
6.1% (89,742)
Number of families with income $30k - 40k:
Garberville:
9.8% (32)
California:
6.2% (91,415)
Number of families with income $40k - 50k:
Garberville:
9.8% (32)
State:
6.8% (100,085)
Number of families with income $60k - 75k:
Garberville:
6.7% (22)
State:
9.5% (140,131)
Number of families with income $75k - 100k:
Garberville:
15.6% (51)
State:
13.8% (203,439)
Number of families with income $100k - 125k:
Garberville:
27.4% (89)
California:
10.4% (153,515)
Median non-family income in Garberville in 2022:
Garberville:
$51,910
California:
$56,558
Median per capita income in Garberville in 2022:
Garberville:
$18,872
State:
$32,124
Change in median per capita income between 2000 and 2022:
Garberville, California:
+118.0%
State:
+120.4%
Income statistics for other residents
Number of households with income < $10k:
Garberville:
4.6% (72)
California:
4.6% (93,035)
Number of households with income $10k - 20k:
Garberville:
6.3% (98)
California:
6.3% (126,222)
Number of households with income $20k - 30k:
Garberville:
7.1% (111)
State:
7.1% (142,656)
Number of households with income $30k - 40k:
Garberville:
8.2% (128)
California:
8.2% (165,018)
Number of households with income $40k - 50k:
Garberville:
8.0% (125)
California:
8.0% (161,732)
Number of households with income $50k - 60k:
Garberville:
7.6% (118)
State:
7.6% (152,152)
Number of households with income $60k - 75k:
Garberville:
10.4% (163)
State:
10.4% (209,951)
Number of households with income $75k - 100k:
Garberville:
14.7% (230)
California:
14.7% (296,102)
Number of households with income $100k - 125k:
Garberville:
10.7% (167)
State:
10.7% (214,281)
Number of households with income $125k - 150k:
Garberville:
7.1% (111)
State:
7.1% (143,092)
Number of households with income $150k - 200k:
Garberville:
8.6% (134)
State:
8.6% (172,215)
Number of households with income > $200k:
Garberville:
6.7% (104)
California:
6.7% (134,102)
Aggregate household income in Garberville in 2022: $20,665,100
Median family income in Garberville in 2022:
Garberville:
$59,910
State:
$72,756
Number of families with income < $10k:
Garberville:
11.7% (11)
State:
4.3% (69,090)
Number of families with income $10k - 20k:
Garberville:
8.4% (8)
State:
5.1% (82,116)
Number of families with income $20k - 30k:
Garberville:
22.0% (21)
State:
7.0% (112,854)
Number of families with income $40k - 50k:
Garberville:
26.1% (24)
State:
8.4% (135,353)
Number of families with income $50k - 60k:
Garberville:
4.7% (4)
State:
7.7% (124,826)
Number of families with income > $200k:
Garberville:
27.1% (25)
California:
6.6% (106,346)
Median non-family income in Garberville in 2022:
Garberville:
$4,980
State:
$43,881
Change in median non-family income between 2000 and 2022:
Garberville, California:
+99.3%
California:
+84.6%
Median per capita income in Garberville in 2022:
Garberville:
$19,954
California:
$25,164
Change in median per capita income between 2000 and 2022:
Garberville, California:
+97.9%
State:
+137.9%
Discuss Garberville, California (CA) on our hugely popular California forum.