The median household income in Gargatha, VA in 2022 was $78,123, which was 9.9% less than the median annual income of $85,873 across the entire state of Virginia. Compared to the median income of $30,250 in 2000 this represents an increase of 61.3%. The per capita income in 2022 was $35,144, which means an increase of 53.6% compared to 2000 when it was $16,309.
Whole page based on the data from 2000 / 2022 when the population of Gargatha, Virginia was 381 / 638
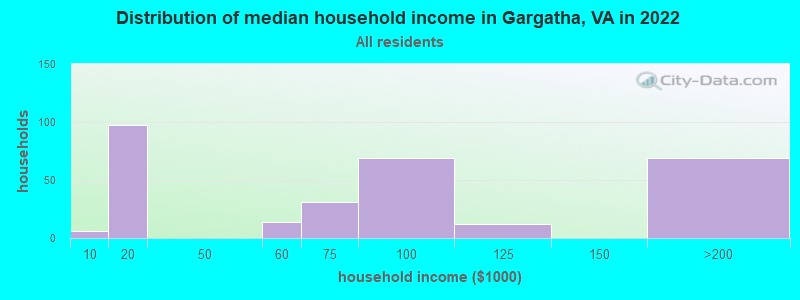
Income statistics for all residents
Median household income in Gargatha, VA in 2022:
Gargatha:
$78,123
Virginia:
$85,873
Number of households with income < $10k:
Gargatha:
2.0% (6)
State:
4.9% (165,315)
Number of households with income $10k - 20k:
Gargatha:
32.6% (97)
State:
5.9% (199,380)
Number of households with income $20k - 30k:
Gargatha:
0.0% (0)
State:
6.0% (202,243)
Number of households with income $30k - 40k:
Gargatha:
0.0% (0)
State:
6.1% (205,967)
Number of households with income $40k - 50k:
Gargatha:
0.0% (0)
State:
6.4% (215,648)
Number of households with income $50k - 60k:
Gargatha:
4.7% (14)
State:
6.2% (210,516)
Number of households with income $60k - 75k:
Gargatha:
10.4% (31)
State:
8.6% (292,112)
Number of households with income $75k - 100k:
Gargatha:
23.2% (69)
Virginia:
12.2% (412,198)
Number of households with income $100k - 125k:
Gargatha:
4.0% (12)
State:
10.3% (348,998)
Number of households with income $125k - 150k:
Gargatha:
0.0% (0)
State:
7.7% (261,236)
Number of households with income $150k - 200k:
Gargatha:
23.2% (69)
State:
10.3% (347,282)
Number of households with income > $200k:
Gargatha:
0.0% (0)
State:
15.4% (519,712)
Aggregate household income in Gargatha in 2022: $22,762,316
Median per capita income in Gargatha in 2022:
Gargatha:
$35,145
State:
$47,199
Change in median per capita income between 2000 and 2022:
Gargatha, Virginia:
+115.5%
Virginia:
+96.9%
Income statistics for White residents
Number of households with income < $10k:
Gargatha:
5.5% (6)
State:
4.1% (90,549)
Number of households with income $10k - 20k:
Gargatha:
51.8% (57)
State:
5.2% (114,324)
Number of households with income $20k - 30k:
Gargatha:
0.0% (0)
State:
5.7% (125,676)
Number of households with income $30k - 40k:
Gargatha:
0.0% (0)
Virginia:
5.5% (121,220)
Number of households with income $40k - 50k:
Gargatha:
0.0% (0)
Virginia:
6.0% (133,011)
Number of households with income $50k - 60k:
Gargatha:
12.7% (14)
State:
6.2% (136,856)
Number of households with income $60k - 75k:
Gargatha:
0.0% (0)
State:
8.4% (186,094)
Number of households with income $75k - 100k:
Gargatha:
4.5% (5)
Virginia:
12.5% (277,077)
Number of households with income $100k - 125k:
Gargatha:
10.9% (12)
Virginia:
10.8% (237,562)
Number of households with income $125k - 150k:
Gargatha:
0.0% (0)
Virginia:
8.0% (177,532)
Number of households with income $150k - 200k:
Gargatha:
14.5% (16)
State:
11.0% (242,106)
Number of households with income > $200k:
Gargatha:
0.0% (0)
Virginia:
16.6% (366,064)
Aggregate household income in Gargatha in 2022: $5,976,367
Median per capita income in Gargatha in 2022:
Gargatha:
$20,704
State:
$53,456
Change in median per capita income between 2000 and 2022:
Gargatha, Virginia:
+4.6%
State:
+99.2%
Income statistics for Black or African American residents
Median household income in Gargatha, VA in 2022:
Gargatha:
$94,214
State:
$60,526
Number of households with income < $10k:
Gargatha:
0.0% (0)
State:
8.3% (52,649)
Number of households with income $10k - 20k:
Gargatha:
21.6% (35)
Virginia:
9.6% (60,583)
Number of households with income $20k - 30k:
Gargatha:
0.0% (0)
State:
8.1% (51,220)
Number of households with income $30k - 40k:
Gargatha:
0.0% (0)
State:
8.6% (54,185)
Number of households with income $40k - 50k:
Gargatha:
0.0% (0)
Virginia:
8.1% (51,156)
Number of households with income $50k - 60k:
Gargatha:
0.0% (0)
State:
7.0% (44,637)
Number of households with income $60k - 75k:
Gargatha:
7.4% (12)
Virginia:
9.8% (62,332)
Number of households with income $75k - 100k:
Gargatha:
38.9% (63)
State:
11.4% (72,479)
Number of households with income $100k - 125k:
Gargatha:
0.0% (0)
Virginia:
8.5% (53,997)
Number of households with income $125k - 150k:
Gargatha:
0.0% (0)
Virginia:
6.3% (40,032)
Number of households with income $150k - 200k:
Gargatha:
32.1% (52)
State:
6.9% (43,513)
Number of households with income > $200k:
Gargatha:
0.0% (0)
Virginia:
7.4% (46,851)
Aggregate household income in Gargatha in 2022: $15,447,492
Median per capita income in Gargatha in 2022:
Gargatha:
$52,807
State:
$34,599
Income statistics for Multirace residents
Number of households with income < $10k:
Gargatha:
0.0% (0)
State:
4.1% (9,125)
Number of households with income $10k - 20k:
Gargatha:
0.0% (0)
State:
5.9% (12,969)
Number of households with income $20k - 30k:
Gargatha:
0.0% (0)
Virginia:
4.8% (10,563)
Number of households with income $30k - 40k:
Gargatha:
0.0% (0)
State:
6.6% (14,553)
Number of households with income $40k - 50k:
Gargatha:
0.0% (0)
State:
5.2% (11,391)
Number of households with income $50k - 60k:
Gargatha:
0.0% (0)
Virginia:
6.8% (14,994)
Number of households with income $60k - 75k:
Gargatha:
100.0% (26)
State:
8.8% (19,323)
Number of households with income $75k - 100k:
Gargatha:
0.0% (0)
Virginia:
12.1% (26,729)
Number of households with income $100k - 125k:
Gargatha:
0.0% (0)
State:
10.4% (22,807)
Number of households with income $125k - 150k:
Gargatha:
0.0% (0)
State:
8.1% (17,881)
Number of households with income $150k - 200k:
Gargatha:
0.0% (0)
State:
10.4% (22,979)
Number of households with income > $200k:
Gargatha:
0.0% (0)
State:
16.7% (36,748)
Aggregate household income in Gargatha in 2022: $56,180,849
Median per capita income in Gargatha in 2022:
Gargatha:
$14,335
State:
$34,385
Change in median per capita income between 2000 and 2022:
Gargatha, Virginia:
+137.8%
Virginia:
+130.2%
Discuss Gargatha, Virginia (VA) on our hugely popular Virginia forum.