The median household income in Garland, TN in 2022 was $71,969, which was 9.3% greater than the median annual income of $65,254 across the entire state of Tennessee. Compared to the median income of $47,083 in 2000 this represents an increase of 34.6%. The per capita income in 2022 was $34,946, which means an increase of 51.2% compared to 2000 when it was $17,069.
Whole page based on the data from 2000 / 2022 when the population of Garland, Tennessee was 309 / 289
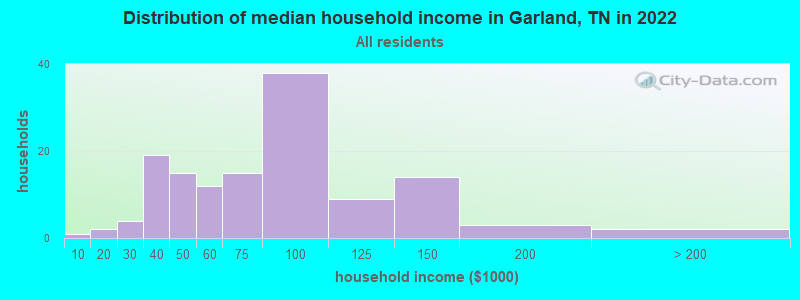
Income statistics for all residents
Median household income in Garland, TN in 2022:
Garland:
$71,969
State:
$65,254
Change in median household income between 2000 and 2022:
Garland, Tennessee:
+52.9%
Tennessee:
+79.5%
Number of households with income < $10k:
Garland:
0.7% (1)
State:
5.4% (154,793)
Number of households with income $10k - 20k:
Garland:
1.5% (2)
Tennessee:
8.0% (228,599)
Number of households with income $20k - 30k:
Garland:
3.0% (4)
Tennessee:
7.9% (224,908)
Number of households with income $30k - 40k:
Garland:
14.2% (19)
Tennessee:
8.6% (244,297)
Number of households with income $40k - 50k:
Garland:
11.2% (15)
State:
8.4% (238,949)
Number of households with income $50k - 60k:
Garland:
9.0% (12)
Tennessee:
7.7% (218,438)
Number of households with income $60k - 75k:
Garland:
11.2% (15)
Tennessee:
10.3% (294,172)
Number of households with income $75k - 100k:
Garland:
28.4% (38)
State:
13.3% (377,310)
Number of households with income $100k - 125k:
Garland:
6.7% (9)
Tennessee:
9.5% (269,124)
Number of households with income $125k - 150k:
Garland:
10.4% (14)
State:
6.3% (178,328)
Number of households with income $150k - 200k:
Garland:
2.2% (3)
State:
7.2% (204,030)
Number of households with income > $200k:
Garland:
1.5% (2)
State:
7.5% (213,736)
Aggregate household income in Garland in 2022: $10,701,569
Median family income in Garland in 2022:
Garland:
$90,846
State:
$80,910
Number of families with income $20k - 30k:
Garland:
5.7% (6)
Tennessee:
5.6% (104,070)
Number of families with income $30k - 40k:
Garland:
5.1% (5)
Tennessee:
7.2% (133,292)
Number of families with income $40k - 50k:
Garland:
16.1% (16)
State:
7.4% (136,997)
Number of families with income $50k - 60k:
Garland:
6.9% (7)
State:
7.1% (131,374)
Number of families with income $60k - 75k:
Garland:
9.7% (10)
Tennessee:
10.8% (198,685)
Number of families with income $75k - 100k:
Garland:
30.8% (31)
Tennessee:
15.1% (279,195)
Number of families with income $100k - 125k:
Garland:
7.2% (7)
State:
11.7% (216,356)
Number of families with income $125k - 150k:
Garland:
13.1% (13)
State:
7.8% (144,000)
Number of families with income $150k - 200k:
Garland:
3.3% (3)
State:
9.3% (172,160)
Number of families with income > $200k:
Garland:
2.1% (2)
State:
10.0% (183,756)
Median non-family income in Garland in 2022:
Garland:
$52,658
State:
$40,285
Change in median non-family income between 2000 and 2022:
Garland, Tennessee:
+130.8%
State:
+91.5%
Median per capita income in Garland in 2022:
Garland:
$34,946
State:
$36,704
Change in median per capita income between 2000 and 2022:
Garland, Tennessee:
+104.7%
State:
+89.3%
Income statistics for White residents
Median household income in Garland, TN in 2022:
Garland:
$82,805
Tennessee:
$69,826
Change in median household income between 2000 and 2022:
Garland, Tennessee:
+75.9%
State:
+82.9%
Number of households with income < $10k:
Garland:
0.8% (1)
State:
4.6% (100,279)
Number of households with income $10k - 20k:
Garland:
1.7% (2)
State:
7.6% (165,031)
Number of households with income $20k - 30k:
Garland:
3.4% (4)
State:
7.4% (160,229)
Number of households with income $30k - 40k:
Garland:
11.8% (14)
Tennessee:
8.1% (174,784)
Number of households with income $40k - 50k:
Garland:
5.9% (7)
State:
7.8% (169,622)
Number of households with income $50k - 60k:
Garland:
10.1% (12)
State:
7.6% (165,508)
Number of households with income $60k - 75k:
Garland:
12.6% (15)
Tennessee:
10.3% (223,937)
Number of households with income $75k - 100k:
Garland:
31.1% (37)
State:
13.5% (292,688)
Number of households with income $100k - 125k:
Garland:
7.6% (9)
Tennessee:
10.1% (219,251)
Number of households with income $125k - 150k:
Garland:
10.9% (13)
State:
6.6% (142,574)
Number of households with income $150k - 200k:
Garland:
2.5% (3)
State:
7.7% (166,039)
Number of households with income > $200k:
Garland:
1.7% (2)
Tennessee:
8.5% (184,546)
Aggregate household income in Garland in 2022: $10,019,044
Median family income in Garland in 2022:
Garland:
$91,581
Tennessee:
$86,015
Number of families with income $20k - 30k:
Garland:
6.4% (6)
State:
5.0% (70,431)
Number of families with income $30k - 40k:
Garland:
1.1% (1)
State:
6.6% (93,498)
Number of families with income $40k - 50k:
Garland:
9.1% (8)
State:
6.8% (96,726)
Number of families with income $50k - 60k:
Garland:
8.1% (7)
Tennessee:
7.2% (101,879)
Number of families with income $60k - 75k:
Garland:
11.1% (10)
State:
10.7% (151,997)
Number of families with income $75k - 100k:
Garland:
34.8% (30)
State:
15.4% (218,373)
Number of families with income $100k - 125k:
Garland:
8.3% (7)
State:
12.6% (178,761)
Number of families with income $125k - 150k:
Garland:
14.9% (13)
Tennessee:
8.2% (116,575)
Number of families with income $150k - 200k:
Garland:
3.7% (3)
State:
9.9% (141,123)
Number of families with income > $200k:
Garland:
2.5% (2)
State:
11.2% (159,431)
Median non-family income in Garland in 2022:
Garland:
$52,020
Tennessee:
$41,178
Change in median non-family income between 2000 and 2022:
Garland, Tennessee:
+121.9%
State:
+91.1%
Median per capita income in Garland in 2022:
Garland:
$35,949
State:
$40,126
Change in median per capita income between 2000 and 2022:
Garland, Tennessee:
+108.8%
State:
+92.6%
Income statistics for Black or African American residents
Aggregate household income in Garland in 2022: $88,018
Median per capita income in Garland in 2022:
Garland:
$12,953
State:
$27,306
Change in median per capita income between 2000 and 2022:
Garland, Tennessee:
+112.3%
Tennessee:
+105.3%
Discuss Garland, Tennessee (TN) on our hugely popular Tennessee forum.