Gilgo-Oak Beach-Captree, New York (NY) income map, earnings map, and wages data
The median household income in Gilgo-Oak Beach-Captree, NY in 2022 was $121,603, which was 34.6% greater than the median annual income of $79,557 across the entire state of New York. Compared to the median income of $66,250 in 2000 this represents an increase of 45.5%. The per capita income in 2022 was $111,968, which means an increase of 50.2% compared to 2000 when it was $55,813.
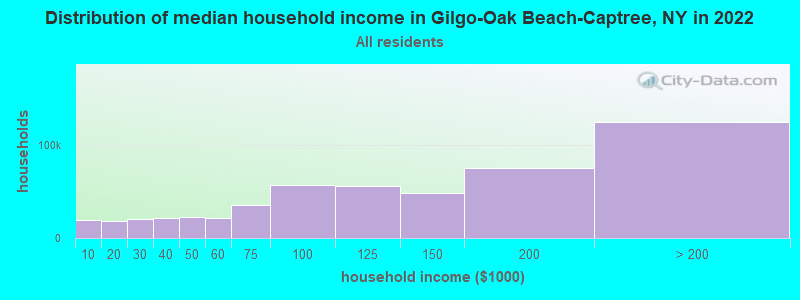
Income statistics for all residents
Median household income in Gilgo-Oak Beach-Captree, NY in 2022:| Gilgo-Oak Beach-Captree: | $121,604 |
| New York: | $79,557 |
Change in median household income between 2000 and 2022:| Gilgo-Oak Beach-Captree, New York: | +83.6% |
| State: | +83.3% |
Number of households with income < $10k:| Gilgo-Oak Beach-Captree: | 3.7% (19,120) |
| State: | 6.8% (527,598) |
Number of households with income $10k - 20k:| Gilgo-Oak Beach-Captree: | 3.4% (17,787) |
| New York: | 7.4% (574,940) |
Number of households with income $20k - 30k:| Gilgo-Oak Beach-Captree: | 3.9% (20,014) |
| State: | 6.7% (517,718) |
Number of households with income $30k - 40k:| Gilgo-Oak Beach-Captree: | 4.2% (21,978) |
| New York: | 6.5% (506,674) |
Number of households with income $40k - 50k:| Gilgo-Oak Beach-Captree: | 4.3% (22,206) |
| State: | 6.1% (470,439) |
Number of households with income $50k - 60k:| Gilgo-Oak Beach-Captree: | 4.1% (21,543) |
| New York: | 5.8% (454,042) |
Number of households with income $60k - 75k:| Gilgo-Oak Beach-Captree: | 6.8% (35,482) |
| State: | 8.5% (657,508) |
Number of households with income $75k - 100k:| Gilgo-Oak Beach-Captree: | 11.0% (57,371) |
| State: | 11.6% (899,824) |
Number of households with income $100k - 125k:| Gilgo-Oak Beach-Captree: | 10.7% (55,465) |
| New York: | 9.3% (723,825) |
Number of households with income $125k - 150k:| Gilgo-Oak Beach-Captree: | 9.3% (48,405) |
| State: | 7.1% (552,420) |
Number of households with income $150k - 200k:| Gilgo-Oak Beach-Captree: | 14.6% (75,609) |
| State: | 9.4% (727,051) |
Number of households with income > $200k:| Gilgo-Oak Beach-Captree: | 24.0% (124,527) |
| State: | 15.0% (1,162,269) |
Aggregate household income in Gilgo-Oak Beach-Captree in 2022: $667,528,572
Median family income in Gilgo-Oak Beach-Captree in 2022:| Gilgo-Oak Beach-Captree: | $202,908 |
| New York: | $99,066 |
Median non-family income in Gilgo-Oak Beach-Captree in 2022:| Gilgo-Oak Beach-Captree: | $77,893 |
| State: | $50,181 |
Change in median non-family income between 2000 and 2022:| Gilgo-Oak Beach-Captree, New York: | +80.1% |
| State: | +85.4% |
Median per capita income in Gilgo-Oak Beach-Captree in 2022:| Gilgo-Oak Beach-Captree: | $111,968 |
| New York: | $47,421 |
Change in median per capita income between 2000 and 2022:| Gilgo-Oak Beach-Captree, New York: | +100.6% |
| State: | +102.7% |
Income statistics for White residents
Median household income in Gilgo-Oak Beach-Captree, NY in 2022:| Gilgo-Oak Beach-Captree: | $126,946 |
| State: | $89,408 |
Change in median household income between 2000 and 2022:| Gilgo-Oak Beach-Captree, New York: | +84.6% |
| New York: | +85.5% |
Number of households with income < $10k:| Gilgo-Oak Beach-Captree: | 3.3% (13,281) |
| New York: | 4.8% (225,550) |
Number of households with income $10k - 20k:| Gilgo-Oak Beach-Captree: | 3.1% (12,567) |
| State: | 6.1% (289,425) |
Number of households with income $20k - 30k:| Gilgo-Oak Beach-Captree: | 3.9% (15,557) |
| New York: | 5.9% (280,254) |
Number of households with income $30k - 40k:| Gilgo-Oak Beach-Captree: | 4.4% (17,418) |
| State: | 6.1% (288,263) |
Number of households with income $40k - 50k:| Gilgo-Oak Beach-Captree: | 4.2% (16,835) |
| New York: | 5.9% (278,079) |
Number of households with income $50k - 60k:| Gilgo-Oak Beach-Captree: | 4.3% (17,304) |
| New York: | 5.7% (267,554) |
Number of households with income $60k - 75k:| Gilgo-Oak Beach-Captree: | 6.8% (27,104) |
| State: | 8.4% (398,344) |
Number of households with income $75k - 100k:| Gilgo-Oak Beach-Captree: | 10.8% (43,090) |
| State: | 11.8% (554,841) |
Number of households with income $100k - 125k:| Gilgo-Oak Beach-Captree: | 9.8% (39,346) |
| State: | 10.0% (469,794) |
Number of households with income $125k - 150k:| Gilgo-Oak Beach-Captree: | 9.1% (36,338) |
| State: | 7.6% (360,467) |
Number of households with income $150k - 200k:| Gilgo-Oak Beach-Captree: | 14.2% (56,757) |
| State: | 10.1% (477,078) |
Number of households with income > $200k:| Gilgo-Oak Beach-Captree: | 26.0% (103,888) |
| State: | 17.6% (829,233) |
Aggregate household income in Gilgo-Oak Beach-Captree in 2022: $521,615,735
Median family income in Gilgo-Oak Beach-Captree in 2022:| Gilgo-Oak Beach-Captree: | $212,324 |
| State: | $115,170 |
Number of families with income $20k - 30k:| Gilgo-Oak Beach-Captree: | 0.4% (0) |
| New York: | 3.5% (97,578) |
Number of families with income $40k - 50k:| Gilgo-Oak Beach-Captree: | 1.5% (2) |
| State: | 4.7% (130,902) |
Number of families with income $50k - 60k:| Gilgo-Oak Beach-Captree: | 2.4% (3) |
| State: | 4.9% (135,118) |
Number of families with income $60k - 75k:| Gilgo-Oak Beach-Captree: | 2.0% (3) |
| State: | 7.8% (216,254) |
Number of families with income $75k - 100k:| Gilgo-Oak Beach-Captree: | 4.8% (6) |
| New York: | 12.4% (342,382) |
Number of families with income $100k - 125k:| Gilgo-Oak Beach-Captree: | 5.3% (7) |
| State: | 11.4% (314,917) |
Number of families with income $125k - 150k:| Gilgo-Oak Beach-Captree: | 11.3% (14) |
| State: | 9.4% (260,489) |
Number of families with income $150k - 200k:| Gilgo-Oak Beach-Captree: | 23.1% (29) |
| New York: | 13.2% (365,586) |
Number of families with income > $200k:| Gilgo-Oak Beach-Captree: | 49.1% (62) |
| State: | 23.2% (642,319) |
Median non-family income in Gilgo-Oak Beach-Captree in 2022:| Gilgo-Oak Beach-Captree: | $80,694 |
| State: | $54,783 |
Change in median non-family income between 2000 and 2022:| Gilgo-Oak Beach-Captree, New York: | +80.3% |
| State: | +87.9% |
Median per capita income in Gilgo-Oak Beach-Captree in 2022:| Gilgo-Oak Beach-Captree: | $124,706 |
| New York: | $57,640 |
Change in median per capita income between 2000 and 2022:| Gilgo-Oak Beach-Captree, New York: | +120.8% |
| New York: | +111.6% |
Income statistics for Asian residents
Median household income in Gilgo-Oak Beach-Captree, NY in 2022:| Gilgo-Oak Beach-Captree: | $38,263 |
| State: | $89,947 |
Change in median household income between 2000 and 2022:| Gilgo-Oak Beach-Captree, New York: | +80.1% |
| State: | +98.1% |
Number of households with income < $10k:| Gilgo-Oak Beach-Captree: | 3.8% (206) |
| New York: | 6.9% (42,537) |
Number of households with income $10k - 20k:| Gilgo-Oak Beach-Captree: | 3.0% (161) |
| State: | 7.3% (44,745) |
Number of households with income $20k - 30k:| Gilgo-Oak Beach-Captree: | 6.2% (337) |
| New York: | 6.2% (38,249) |
Number of households with income $30k - 40k:| Gilgo-Oak Beach-Captree: | 2.4% (131) |
| State: | 5.5% (33,993) |
Number of households with income $40k - 50k:| Gilgo-Oak Beach-Captree: | 4.7% (254) |
| State: | 4.8% (29,795) |
Number of households with income $50k - 60k:| Gilgo-Oak Beach-Captree: | 1.7% (93) |
| New York: | 5.2% (32,100) |
Number of households with income $60k - 75k:| Gilgo-Oak Beach-Captree: | 6.7% (365) |
| State: | 7.3% (44,615) |
Number of households with income $75k - 100k:| Gilgo-Oak Beach-Captree: | 9.4% (513) |
| State: | 10.8% (66,687) |
Number of households with income $100k - 125k:| Gilgo-Oak Beach-Captree: | 9.7% (529) |
| State: | 8.2% (50,233) |
Number of households with income $125k - 150k:| Gilgo-Oak Beach-Captree: | 12.3% (669) |
| State: | 7.2% (44,299) |
Number of households with income $150k - 200k:| Gilgo-Oak Beach-Captree: | 16.2% (881) |
| New York: | 10.4% (63,837) |
Number of households with income > $200k:| Gilgo-Oak Beach-Captree: | 24.1% (1,314) |
| New York: | 20.1% (123,891) |
Aggregate household income in Gilgo-Oak Beach-Captree in 2022: $488,248
Median non-family income in Gilgo-Oak Beach-Captree in 2022:| Gilgo-Oak Beach-Captree: | $44,647 |
| State: | $63,573 |
Change in median non-family income between 2000 and 2022:| Gilgo-Oak Beach-Captree, New York: | +110.1% |
| State: | +101.1% |
Median per capita income in Gilgo-Oak Beach-Captree in 2022:| Gilgo-Oak Beach-Captree: | $42,097 |
| New York: | $46,726 |
Change in median per capita income between 2000 and 2022:| Gilgo-Oak Beach-Captree, New York: | +102.1% |
| State: | +126.6% |
Income statistics for Hispanic or Latino residents
Number of households with income < $10k:| Gilgo-Oak Beach-Captree: | 3.3% (5,246) |
| State: | 9.9% (127,185) |
Number of households with income $10k - 20k:| Gilgo-Oak Beach-Captree: | 4.0% (6,265) |
| State: | 10.7% (136,699) |
Number of households with income $20k - 30k:| Gilgo-Oak Beach-Captree: | 2.5% (4,016) |
| State: | 8.1% (102,991) |
Number of households with income $30k - 40k:| Gilgo-Oak Beach-Captree: | 4.8% (7,530) |
| New York: | 7.8% (100,149) |
Number of households with income $40k - 50k:| Gilgo-Oak Beach-Captree: | 4.3% (6,862) |
| State: | 6.9% (87,760) |
Number of households with income $50k - 60k:| Gilgo-Oak Beach-Captree: | 5.1% (8,000) |
| State: | 6.3% (80,968) |
Number of households with income $60k - 75k:| Gilgo-Oak Beach-Captree: | 7.6% (12,094) |
| New York: | 8.7% (110,631) |
Number of households with income $75k - 100k:| Gilgo-Oak Beach-Captree: | 12.6% (19,993) |
| State: | 11.2% (142,787) |
Number of households with income $100k - 125k:| Gilgo-Oak Beach-Captree: | 13.6% (21,603) |
| State: | 8.2% (104,850) |
Number of households with income $125k - 150k:| Gilgo-Oak Beach-Captree: | 9.9% (15,692) |
| State: | 6.3% (80,274) |
Number of households with income $150k - 200k:| Gilgo-Oak Beach-Captree: | 16.0% (25,412) |
| State: | 7.4% (95,117) |
Number of households with income > $200k:| Gilgo-Oak Beach-Captree: | 16.2% (25,654) |
| New York: | 8.6% (109,514) |
Median per capita income in Gilgo-Oak Beach-Captree in 2022:| Gilgo-Oak Beach-Captree: | $67,045 |
| New York: | $29,761 |
Change in median per capita income between 2000 and 2022:| Gilgo-Oak Beach-Captree, New York: | +103.2% |
| State: | +132.7% |