The median household income in Glenville, CT in 2022 was $193,711, which was 54.4% greater than the median annual income of $88,429 across the entire state of Connecticut. Compared to the median income of $65,249 in 2000 this represents an increase of 66.3%. The per capita income in 2022 was $114,510, which means an increase of 66.5% compared to 2000 when it was $38,350.
Whole page based on the data from 2000 / 2022 when the population of Glenville, Connecticut was 2,327 / 3,125
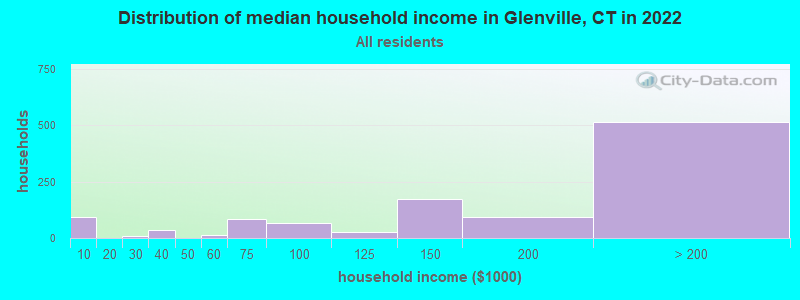
Income statistics for all residents
Median household income in Glenville, CT in 2022:
Glenville:
$193,711
State:
$88,429
Number of households with income < $10k:
Glenville:
8.3% (92)
Connecticut:
5.1% (72,746)
Number of households with income $10k - 20k:
Glenville:
0.0% (0)
State:
5.7% (81,643)
Number of households with income $20k - 30k:
Glenville:
0.8% (9)
State:
6.5% (92,844)
Number of households with income $30k - 40k:
Glenville:
3.2% (35)
State:
5.9% (83,934)
Number of households with income $40k - 50k:
Glenville:
0.0% (0)
Connecticut:
5.8% (83,025)
Number of households with income $50k - 60k:
Glenville:
1.3% (14)
State:
5.7% (81,788)
Number of households with income $60k - 75k:
Glenville:
7.7% (85)
Connecticut:
8.1% (115,651)
Number of households with income $75k - 100k:
Glenville:
6.0% (67)
Connecticut:
12.6% (180,173)
Number of households with income $100k - 125k:
Glenville:
2.4% (27)
State:
9.9% (141,231)
Number of households with income $125k - 150k:
Glenville:
15.8% (175)
Connecticut:
7.9% (112,826)
Number of households with income $150k - 200k:
Glenville:
8.4% (93)
State:
10.8% (154,641)
Number of households with income > $200k:
Glenville:
46.3% (514)
State:
16.3% (233,133)
Aggregate household income in Glenville in 2022: $316,743,427
Median family income in Glenville in 2022:
Glenville:
$224,619
State:
$115,183
Number of families with income < $10k:
Glenville:
2.0% (17)
Connecticut:
2.6% (23,251)
Number of families with income $30k - 40k:
Glenville:
1.7% (14)
Connecticut:
4.2% (38,052)
Number of families with income $60k - 75k:
Glenville:
4.8% (41)
Connecticut:
7.4% (66,521)
Number of families with income $75k - 100k:
Glenville:
6.6% (56)
Connecticut:
12.9% (116,232)
Number of families with income $100k - 125k:
Glenville:
1.1% (10)
State:
10.6% (95,504)
Number of families with income $125k - 150k:
Glenville:
19.5% (165)
State:
9.5% (86,149)
Number of families with income $150k - 200k:
Glenville:
10.2% (86)
State:
14.0% (125,908)
Number of families with income > $200k:
Glenville:
54.0% (456)
State:
22.4% (202,515)
Median non-family income in Glenville in 2022:
Glenville:
$73,521
State:
$50,964
Change in median non-family income between 2000 and 2022:
Glenville, Connecticut:
+102.1%
State:
+65.1%
Median per capita income in Glenville in 2022:
Glenville:
$114,510
State:
$51,581
Income statistics for White residents
Median household income in Glenville, CT in 2022:
Glenville:
$210,849
State:
$96,890
Number of households with income < $10k:
Glenville:
7.9% (71)
State:
4.2% (42,265)
Number of households with income $10k - 20k:
Glenville:
0.0% (0)
State:
4.8% (48,323)
Number of households with income $20k - 30k:
Glenville:
0.9% (8)
Connecticut:
5.7% (57,716)
Number of households with income $30k - 40k:
Glenville:
3.7% (33)
State:
5.3% (53,827)
Number of households with income $40k - 50k:
Glenville:
0.0% (0)
State:
5.3% (53,301)
Number of households with income $50k - 60k:
Glenville:
1.6% (14)
Connecticut:
5.5% (55,690)
Number of households with income $60k - 75k:
Glenville:
9.1% (81)
State:
8.0% (80,329)
Number of households with income $75k - 100k:
Glenville:
7.0% (63)
Connecticut:
12.7% (128,070)
Number of households with income $100k - 125k:
Glenville:
2.8% (25)
State:
10.0% (101,210)
Number of households with income $125k - 150k:
Glenville:
4.5% (40)
Connecticut:
8.0% (81,250)
Number of households with income $150k - 200k:
Glenville:
9.9% (89)
Connecticut:
11.8% (119,527)
Number of households with income > $200k:
Glenville:
52.6% (471)
State:
18.6% (187,875)
Aggregate household income in Glenville in 2022: $270,620,207
Median family income in Glenville in 2022:
Glenville:
$249,331
State:
$128,955
Number of families with income $30k - 40k:
Glenville:
1.8% (12)
State:
2.9% (18,160)
Number of families with income $60k - 75k:
Glenville:
6.0% (39)
State:
7.1% (44,075)
Number of families with income $75k - 100k:
Glenville:
7.9% (52)
State:
12.5% (77,679)
Number of families with income $100k - 125k:
Glenville:
1.4% (9)
State:
11.1% (69,086)
Number of families with income $125k - 150k:
Glenville:
4.8% (32)
Connecticut:
9.6% (59,616)
Number of families with income $150k - 200k:
Glenville:
12.7% (83)
Connecticut:
15.7% (97,890)
Number of families with income > $200k:
Glenville:
65.5% (430)
Connecticut:
26.3% (163,417)
Median non-family income in Glenville in 2022:
Glenville:
$71,245
State:
$54,067
Change in median non-family income between 2000 and 2022:
Glenville, Connecticut:
+84.4%
Connecticut:
+68.7%
Median per capita income in Glenville in 2022:
Glenville:
$130,915
State:
$59,916
Income statistics for Black or African American residents
Number of households with income < $10k:
Glenville:
0.0% (0)
Connecticut:
6.8% (9,494)
Number of households with income $10k - 20k:
Glenville:
0.0% (0)
State:
7.9% (11,003)
Number of households with income $20k - 30k:
Glenville:
0.0% (0)
State:
10.8% (15,045)
Number of households with income $30k - 40k:
Glenville:
0.0% (0)
State:
8.2% (11,501)
Number of households with income $40k - 50k:
Glenville:
0.0% (0)
Connecticut:
7.4% (10,416)
Number of households with income $50k - 60k:
Glenville:
0.0% (0)
State:
7.5% (10,534)
Number of households with income $60k - 75k:
Glenville:
0.0% (0)
State:
8.0% (11,244)
Number of households with income $75k - 100k:
Glenville:
0.0% (0)
State:
9.6% (13,370)
Number of households with income $100k - 125k:
Glenville:
0.0% (0)
State:
10.2% (14,244)
Number of households with income $125k - 150k:
Glenville:
100.0% (154)
State:
8.0% (11,246)
Number of households with income $150k - 200k:
Glenville:
0.0% (0)
State:
7.7% (10,727)
Number of households with income > $200k:
Glenville:
0.0% (0)
Connecticut:
7.9% (11,086)
Aggregate household income in Glenville in 2022: $7,652,433,958
Median per capita income in Glenville in 2022:
Glenville:
$47,011
State:
$36,289
Income statistics for Asian residents
Number of households with income < $10k:
Glenville:
0.0% (0)
State:
7.1% (4,245)
Number of households with income $10k - 20k:
Glenville:
0.0% (0)
Connecticut:
3.5% (2,087)
Number of households with income $20k - 30k:
Glenville:
0.0% (0)
Connecticut:
4.1% (2,464)
Number of households with income $30k - 40k:
Glenville:
0.0% (0)
Connecticut:
4.1% (2,478)
Number of households with income $40k - 50k:
Glenville:
0.0% (0)
Connecticut:
3.3% (1,983)
Number of households with income $50k - 60k:
Glenville:
0.0% (0)
State:
3.9% (2,328)
Number of households with income $60k - 75k:
Glenville:
0.0% (0)
State:
7.0% (4,228)
Number of households with income $75k - 100k:
Glenville:
0.0% (0)
State:
11.5% (6,911)
Number of households with income $100k - 125k:
Glenville:
0.0% (0)
State:
10.2% (6,127)
Number of households with income $125k - 150k:
Glenville:
0.0% (0)
State:
8.5% (5,079)
Number of households with income $150k - 200k:
Glenville:
0.0% (0)
State:
12.4% (7,434)
Number of households with income > $200k:
Glenville:
100.0% (22)
State:
24.4% (14,661)
Aggregate household income in Glenville in 2022: $12,389,587
Median per capita income in Glenville in 2022:
Glenville:
$127,103
Connecticut:
$55,295
Income statistics for Hispanic or Latino residents
Number of households with income < $10k:
Glenville:
100.0% (20)
Connecticut:
8.7% (18,584)
Number of households with income $10k - 20k:
Glenville:
0.0% (0)
State:
9.1% (19,235)
Number of households with income $20k - 30k:
Glenville:
0.0% (0)
State:
8.9% (18,989)
Number of households with income $30k - 40k:
Glenville:
0.0% (0)
State:
7.5% (15,967)
Number of households with income $40k - 50k:
Glenville:
0.0% (0)
Connecticut:
8.7% (18,466)
Number of households with income $50k - 60k:
Glenville:
0.0% (0)
State:
6.9% (14,706)
Number of households with income $60k - 75k:
Glenville:
0.0% (0)
State:
8.9% (18,888)
Number of households with income $75k - 100k:
Glenville:
0.0% (0)
State:
13.5% (28,669)
Number of households with income $100k - 125k:
Glenville:
0.0% (0)
Connecticut:
8.2% (17,434)
Number of households with income $125k - 150k:
Glenville:
0.0% (0)
State:
6.5% (13,752)
Number of households with income $150k - 200k:
Glenville:
0.0% (0)
Connecticut:
6.6% (14,114)
Number of households with income > $200k:
Glenville:
0.0% (0)
State:
6.4% (13,630)
Median per capita income in Glenville in 2022:
Glenville:
$26,357
State:
$28,507
Change in median per capita income between 2000 and 2022:
Glenville, Connecticut:
+69.2%
State:
+117.2%
Income statistics for Multirace residents
Number of households with income < $10k:
Glenville:
100.0% (24)
State:
6.0% (7,457)
Number of households with income $10k - 20k:
Glenville:
0.0% (0)
State:
8.1% (10,139)
Number of households with income $20k - 30k:
Glenville:
0.0% (0)
State:
7.0% (8,702)
Number of households with income $30k - 40k:
Glenville:
0.0% (0)
State:
6.9% (8,546)
Number of households with income $40k - 50k:
Glenville:
0.0% (0)
Connecticut:
7.0% (8,712)
Number of households with income $50k - 60k:
Glenville:
0.0% (0)
State:
5.9% (7,331)
Number of households with income $60k - 75k:
Glenville:
0.0% (0)
Connecticut:
8.5% (10,634)
Number of households with income $75k - 100k:
Glenville:
0.0% (0)
State:
14.1% (17,600)
Number of households with income $100k - 125k:
Glenville:
0.0% (0)
Connecticut:
9.9% (12,383)
Number of households with income $125k - 150k:
Glenville:
0.0% (0)
State:
7.2% (8,921)
Number of households with income $150k - 200k:
Glenville:
0.0% (0)
State:
8.8% (10,922)
Number of households with income > $200k:
Glenville:
0.0% (0)
State:
10.6% (13,247)
Median per capita income in Glenville in 2022:
Glenville:
$30,938
State:
$32,794
Change in median per capita income between 2000 and 2022:
Glenville, Connecticut:
+75.0%
State:
+117.2%
Income statistics for other residents
Median per capita income in Glenville in 2022:
Glenville:
$97,554
State:
$29,353
Discuss Glenville, Connecticut (CT) on our hugely popular Connecticut forum.