Goodings Grove, Illinois (IL) income map, earnings map, and wages data
The median household income in Goodings Grove, IL in 2022 was $131,220, which was 41.5% greater than the median annual income of $76,708 across the entire state of Illinois. Compared to the median income of $84,484 in 2000 this represents an increase of 35.6%. The per capita income in 2022 was $51,829, which means an increase of 43.2% compared to 2000 when it was $29,452.
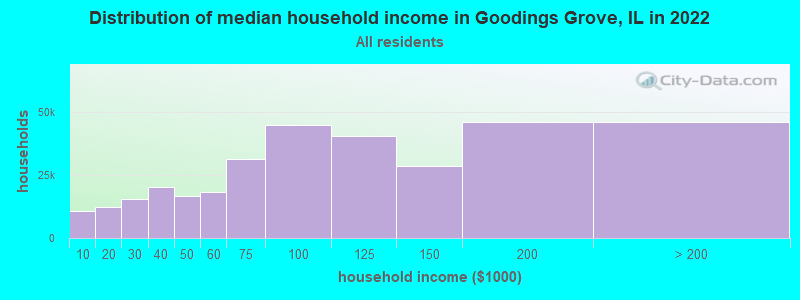
Income statistics for all residents
Median household income in Goodings Grove, IL in 2022:| Goodings Grove: | $131,220 |
| State: | $76,708 |
Change in median household income between 2000 and 2022:| Goodings Grove, Illinois: | +55.3% |
| State: | +64.6% |
Number of households with income < $10k:| Goodings Grove: | 3.2% (10,570) |
| State: | 5.9% (296,090) |
Number of households with income $10k - 20k:| Goodings Grove: | 3.7% (12,316) |
| State: | 6.6% (333,259) |
Number of households with income $20k - 30k:| Goodings Grove: | 4.7% (15,656) |
| State: | 6.8% (342,921) |
Number of households with income $30k - 40k:| Goodings Grove: | 6.1% (20,303) |
| State: | 7.0% (355,254) |
Number of households with income $40k - 50k:| Goodings Grove: | 5.1% (16,839) |
| State: | 6.7% (340,678) |
Number of households with income $50k - 60k:| Goodings Grove: | 5.6% (18,418) |
| Illinois: | 6.7% (339,405) |
Number of households with income $60k - 75k:| Goodings Grove: | 9.4% (31,305) |
| Illinois: | 9.2% (465,709) |
Number of households with income $75k - 100k:| Goodings Grove: | 13.5% (44,907) |
| State: | 12.9% (651,353) |
Number of households with income $100k - 125k:| Goodings Grove: | 12.2% (40,395) |
| Illinois: | 10.3% (522,359) |
Number of households with income $125k - 150k:| Goodings Grove: | 8.7% (28,708) |
| State: | 7.3% (367,136) |
Number of households with income $150k - 200k:| Goodings Grove: | 13.9% (46,003) |
| State: | 9.0% (455,249) |
Number of households with income > $200k:| Goodings Grove: | 13.9% (46,050) |
| State: | 11.6% (586,947) |
Aggregate household income in Goodings Grove in 2022: $6,915,486,660
Median family income in Goodings Grove in 2022:| Goodings Grove: | $143,678 |
| State: | $96,948 |
Median non-family income in Goodings Grove in 2022:| Goodings Grove: | $81,735 |
| State: | $46,533 |
Change in median non-family income between 2000 and 2022:| Goodings Grove, Illinois: | +62.0% |
| State: | +64.0% |
Median per capita income in Goodings Grove in 2022:| Goodings Grove: | $51,830 |
| State: | $43,317 |
Change in median per capita income between 2000 and 2022:| Goodings Grove, Illinois: | +76.0% |
| Illinois: | +87.5% |
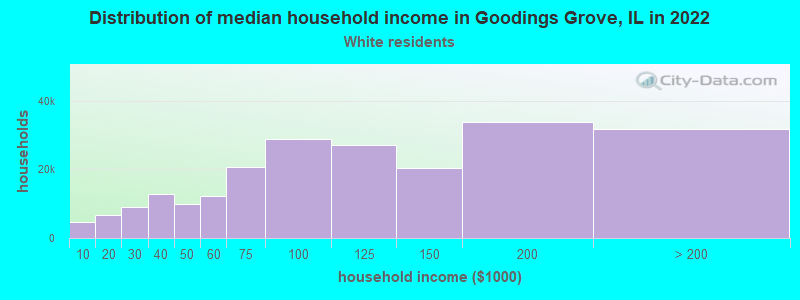
Income statistics for White residents
Median household income in Goodings Grove, IL in 2022:| Goodings Grove: | $135,788 |
| State: | $83,346 |
Change in median household income between 2000 and 2022:| Goodings Grove, Illinois: | +62.0% |
| Illinois: | +67.5% |
Number of households with income < $10k:| Goodings Grove: | 2.2% (4,798) |
| State: | 4.5% (149,895) |
Number of households with income $10k - 20k:| Goodings Grove: | 3.1% (6,819) |
| State: | 5.5% (184,529) |
Number of households with income $20k - 30k:| Goodings Grove: | 4.1% (8,904) |
| Illinois: | 6.1% (205,767) |
Number of households with income $30k - 40k:| Goodings Grove: | 5.9% (12,904) |
| State: | 6.7% (225,572) |
Number of households with income $40k - 50k:| Goodings Grove: | 4.6% (10,006) |
| Illinois: | 6.5% (216,965) |
Number of households with income $50k - 60k:| Goodings Grove: | 5.6% (12,298) |
| Illinois: | 6.6% (222,841) |
Number of households with income $60k - 75k:| Goodings Grove: | 9.5% (20,658) |
| State: | 9.3% (312,758) |
Number of households with income $75k - 100k:| Goodings Grove: | 13.2% (28,924) |
| State: | 12.9% (433,180) |
Number of households with income $100k - 125k:| Goodings Grove: | 12.4% (27,112) |
| State: | 10.7% (360,753) |
Number of households with income $125k - 150k:| Goodings Grove: | 9.3% (20,324) |
| State: | 7.9% (266,532) |
Number of households with income $150k - 200k:| Goodings Grove: | 15.5% (33,835) |
| Illinois: | 10.0% (337,357) |
Number of households with income > $200k:| Goodings Grove: | 14.5% (31,740) |
| Illinois: | 13.3% (446,069) |
Aggregate household income in Goodings Grove in 2022: $4,863,244,574
Median family income in Goodings Grove in 2022:| Goodings Grove: | $147,515 |
| State: | $107,938 |
Number of families with income < $10k:| Goodings Grove: | 0.2% (12) |
| State: | 2.2% (45,983) |
Number of families with income $10k - 20k:| Goodings Grove: | 1.0% (65) |
| State: | 2.5% (50,574) |
Number of families with income $20k - 30k:| Goodings Grove: | 0.9% (54) |
| State: | 3.5% (70,927) |
Number of families with income $30k - 40k:| Goodings Grove: | 1.5% (93) |
| State: | 4.4% (90,563) |
Number of families with income $40k - 50k:| Goodings Grove: | 1.8% (114) |
| State: | 5.0% (102,597) |
Number of families with income $50k - 60k:| Goodings Grove: | 2.8% (175) |
| State: | 5.8% (119,129) |
Number of families with income $60k - 75k:| Goodings Grove: | 5.9% (371) |
| State: | 8.8% (179,665) |
Number of families with income $75k - 100k:| Goodings Grove: | 12.4% (775) |
| State: | 13.5% (276,887) |
Number of families with income $100k - 125k:| Goodings Grove: | 15.4% (965) |
| State: | 12.5% (256,099) |
Number of families with income $125k - 150k:| Goodings Grove: | 12.4% (777) |
| State: | 9.8% (199,855) |
Number of families with income $150k - 200k:| Goodings Grove: | 26.3% (1,651) |
| Illinois: | 13.4% (274,569) |
Number of families with income > $200k:| Goodings Grove: | 19.5% (1,222) |
| Illinois: | 18.6% (381,354) |
Median non-family income in Goodings Grove in 2022:| Goodings Grove: | $85,951 |
| Illinois: | $50,934 |
Change in median non-family income between 2000 and 2022:| Goodings Grove, Illinois: | +70.3% |
| State: | +70.7% |
Median per capita income in Goodings Grove in 2022:| Goodings Grove: | $55,879 |
| Illinois: | $50,738 |
Change in median per capita income between 2000 and 2022:| Goodings Grove, Illinois: | +89.9% |
| State: | +95.5% |
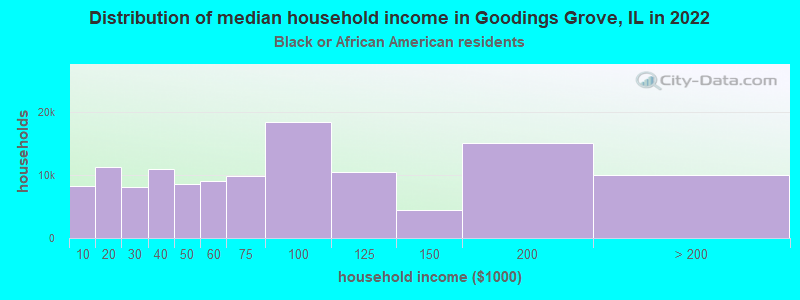
Income statistics for Black or African American residents
Median household income in Goodings Grove, IL in 2022:| Goodings Grove: | $293,046 |
| State: | $45,019 |
Change in median household income between 2000 and 2022:| Goodings Grove, Illinois: | +46.5% |
| State: | +42.0% |
Number of households with income < $10k:| Goodings Grove: | 6.7% (8,253) |
| State: | 13.3% (92,224) |
Number of households with income $10k - 20k:| Goodings Grove: | 9.0% (11,163) |
| Illinois: | 13.5% (93,732) |
Number of households with income $20k - 30k:| Goodings Grove: | 6.5% (8,024) |
| State: | 9.9% (68,453) |
Number of households with income $30k - 40k:| Goodings Grove: | 8.8% (10,851) |
| State: | 8.5% (59,072) |
Number of households with income $40k - 50k:| Goodings Grove: | 6.9% (8,528) |
| State: | 7.9% (55,033) |
Number of households with income $50k - 60k:| Goodings Grove: | 7.2% (8,974) |
| State: | 7.2% (49,556) |
Number of households with income $60k - 75k:| Goodings Grove: | 7.9% (9,779) |
| State: | 7.8% (53,726) |
Number of households with income $75k - 100k:| Goodings Grove: | 14.8% (18,365) |
| Illinois: | 11.6% (80,439) |
Number of households with income $100k - 125k:| Goodings Grove: | 8.5% (10,500) |
| Illinois: | 7.5% (52,244) |
Number of households with income $125k - 150k:| Goodings Grove: | 3.6% (4,429) |
| State: | 3.9% (27,058) |
Number of households with income $150k - 200k:| Goodings Grove: | 12.2% (15,113) |
| Illinois: | 4.6% (32,057) |
Number of households with income > $200k:| Goodings Grove: | 8.1% (10,029) |
| State: | 4.1% (28,731) |
Aggregate household income in Goodings Grove in 2022: $5,901,892
Median family income in Goodings Grove in 2022:| Goodings Grove: | $321,568 |
| State: | $60,661 |
Number of families with income > $200k:| Goodings Grove: | 100.0% (102) |
| Illinois: | 6.3% (23,371) |
Median per capita income in Goodings Grove in 2022:| Goodings Grove: | $90,007 |
| State: | $28,045 |
Change in median per capita income between 2000 and 2022:| Goodings Grove, Illinois: | +83.6% |
| State: | +90.2% |
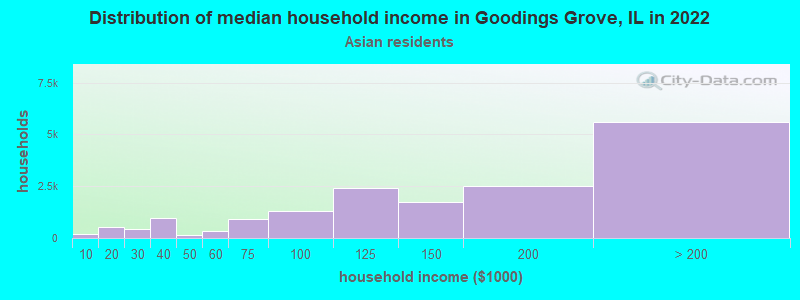
Income statistics for Asian residents
Median household income in Goodings Grove, IL in 2022:| Goodings Grove: | $175,766 |
| State: | $104,287 |
Change in median household income between 2000 and 2022:| Goodings Grove, Illinois: | +82.4% |
| State: | +81.9% |
Number of households with income < $10k:| Goodings Grove: | 1.1% (185) |
| State: | 5.3% (14,653) |
Number of households with income $10k - 20k:| Goodings Grove: | 3.0% (518) |
| State: | 4.5% (12,283) |
Number of households with income $20k - 30k:| Goodings Grove: | 2.4% (412) |
| State: | 4.8% (13,135) |
Number of households with income $30k - 40k:| Goodings Grove: | 5.7% (978) |
| State: | 5.0% (13,655) |
Number of households with income $40k - 50k:| Goodings Grove: | 0.9% (159) |
| State: | 4.5% (12,357) |
Number of households with income $50k - 60k:| Goodings Grove: | 2.1% (360) |
| State: | 4.9% (13,568) |
Number of households with income $60k - 75k:| Goodings Grove: | 5.4% (924) |
| State: | 7.1% (19,606) |
Number of households with income $75k - 100k:| Goodings Grove: | 7.6% (1,301) |
| Illinois: | 12.1% (33,349) |
Number of households with income $100k - 125k:| Goodings Grove: | 14.2% (2,437) |
| State: | 9.7% (26,669) |
Number of households with income $125k - 150k:| Goodings Grove: | 10.1% (1,723) |
| State: | 7.3% (20,172) |
Number of households with income $150k - 200k:| Goodings Grove: | 14.7% (2,510) |
| State: | 11.5% (31,711) |
Number of households with income > $200k:| Goodings Grove: | 32.7% (5,603) |
| State: | 23.1% (63,411) |
Aggregate household income in Goodings Grove in 2022: $46,454,885
Median family income in Goodings Grove in 2022:| Goodings Grove: | $178,631 |
| State: | $124,630 |
Number of families with income $10k - 20k:| Goodings Grove: | 7.0% (15) |
| Illinois: | 2.6% (5,077) |
Number of families with income $20k - 30k:| Goodings Grove: | 14.5% (31) |
| Illinois: | 4.4% (8,618) |
Number of families with income $40k - 50k:| Goodings Grove: | 1.7% (4) |
| Illinois: | 3.9% (7,584) |
Number of families with income $75k - 100k:| Goodings Grove: | 12.3% (27) |
| Illinois: | 12.3% (24,156) |
Number of families with income $100k - 125k:| Goodings Grove: | 32.9% (71) |
| State: | 9.6% (18,808) |
Number of families with income $150k - 200k:| Goodings Grove: | 31.6% (69) |
| Illinois: | 13.9% (27,222) |
Median per capita income in Goodings Grove in 2022:| Goodings Grove: | $51,444 |
| State: | $52,977 |
Change in median per capita income between 2000 and 2022:| Goodings Grove, Illinois: | +91.6% |
| Illinois: | +119.5% |
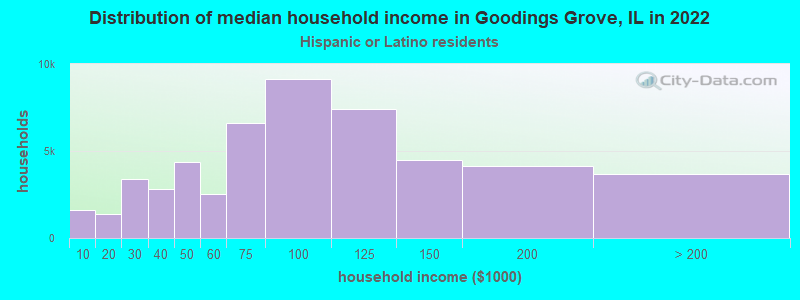
Income statistics for Hispanic or Latino residents
Median household income in Goodings Grove, IL in 2022:| Goodings Grove: | $128,650 |
| Illinois: | $72,139 |
Change in median household income between 2000 and 2022:| Goodings Grove, Illinois: | +56.4% |
| State: | +75.7% |
Number of households with income < $10k:| Goodings Grove: | 3.1% (1,598) |
| State: | 4.9% (33,145) |
Number of households with income $10k - 20k:| Goodings Grove: | 2.7% (1,372) |
| State: | 5.4% (36,345) |
Number of households with income $20k - 30k:| Goodings Grove: | 6.6% (3,397) |
| State: | 7.5% (50,677) |
Number of households with income $30k - 40k:| Goodings Grove: | 5.4% (2,788) |
| State: | 7.7% (52,008) |
Number of households with income $40k - 50k:| Goodings Grove: | 8.4% (4,346) |
| State: | 8.1% (54,702) |
Number of households with income $50k - 60k:| Goodings Grove: | 4.9% (2,517) |
| State: | 7.5% (51,062) |
Number of households with income $60k - 75k:| Goodings Grove: | 12.8% (6,603) |
| State: | 11.3% (76,576) |
Number of households with income $75k - 100k:| Goodings Grove: | 17.7% (9,117) |
| State: | 15.5% (105,152) |
Number of households with income $100k - 125k:| Goodings Grove: | 14.4% (7,411) |
| State: | 11.5% (77,760) |
Number of households with income $125k - 150k:| Goodings Grove: | 8.8% (4,507) |
| State: | 7.3% (49,310) |
Number of households with income $150k - 200k:| Goodings Grove: | 8.1% (4,147) |
| State: | 7.6% (51,233) |
Number of households with income > $200k:| Goodings Grove: | 7.1% (3,661) |
| Illinois: | 5.9% (40,028) |
Aggregate household income in Goodings Grove in 2022: $53,549,798
Median family income in Goodings Grove in 2022:| Goodings Grove: | $128,590 |
| State: | $76,467 |
Number of families with income < $10k:| Goodings Grove: | 1.2% (15) |
| Illinois: | 3.8% (19,330) |
Number of families with income $10k - 20k:| Goodings Grove: | 1.8% (24) |
| State: | 3.8% (19,314) |
Number of families with income $20k - 30k:| Goodings Grove: | 3.4% (44) |
| Illinois: | 6.8% (34,467) |
Number of families with income $30k - 40k:| Goodings Grove: | 1.8% (22) |
| Illinois: | 7.5% (37,976) |
Number of families with income $40k - 50k:| Goodings Grove: | 5.6% (72) |
| State: | 7.7% (38,858) |
Number of families with income $50k - 60k:| Goodings Grove: | 5.2% (67) |
| State: | 7.6% (38,606) |
Number of families with income $60k - 75k:| Goodings Grove: | 8.5% (109) |
| State: | 11.5% (58,164) |
Number of families with income $75k - 100k:| Goodings Grove: | 17.8% (227) |
| State: | 16.0% (81,055) |
Number of families with income $100k - 125k:| Goodings Grove: | 17.6% (225) |
| State: | 12.1% (61,491) |
Number of families with income $125k - 150k:| Goodings Grove: | 12.2% (156) |
| State: | 8.0% (40,271) |
Number of families with income $150k - 200k:| Goodings Grove: | 15.1% (194) |
| State: | 8.6% (43,536) |
Number of families with income > $200k:| Goodings Grove: | 9.8% (125) |
| State: | 6.6% (33,240) |
Median non-family income in Goodings Grove in 2022:| Goodings Grove: | $29,780 |
| Illinois: | $45,965 |
Change in median non-family income between 2000 and 2022:| Goodings Grove, Illinois: | +58.8% |
| Illinois: | +75.9% |
Median per capita income in Goodings Grove in 2022:| Goodings Grove: | $39,558 |
| Illinois: | $26,551 |
Change in median per capita income between 2000 and 2022:| Goodings Grove, Illinois: | +76.4% |
| State: | +111.0% |
Income statistics for American Indian and Alaska Native residents
Number of households with income < $10k:| Goodings Grove: | 3.2% (1,769) |
| State: | 3.2% (935) |
Number of households with income $10k - 20k:| Goodings Grove: | 7.1% (3,884) |
| State: | 7.1% (2,053) |
Number of households with income $20k - 30k:| Goodings Grove: | 10.1% (5,560) |
| State: | 10.1% (2,939) |
Number of households with income $30k - 40k:| Goodings Grove: | 7.7% (4,249) |
| Illinois: | 7.7% (2,246) |
Number of households with income $40k - 50k:| Goodings Grove: | 7.9% (4,351) |
| State: | 7.9% (2,300) |
Number of households with income $50k - 60k:| Goodings Grove: | 8.5% (4,654) |
| State: | 8.5% (2,460) |
Number of households with income $60k - 75k:| Goodings Grove: | 10.7% (5,855) |
| State: | 10.7% (3,095) |
Number of households with income $75k - 100k:| Goodings Grove: | 15.3% (8,420) |
| State: | 15.3% (4,451) |
Number of households with income $100k - 125k:| Goodings Grove: | 11.7% (6,405) |
| Illinois: | 11.7% (3,386) |
Number of households with income $125k - 150k:| Goodings Grove: | 7.8% (4,292) |
| State: | 7.8% (2,269) |
Number of households with income $150k - 200k:| Goodings Grove: | 5.8% (3,165) |
| State: | 5.8% (1,673) |
Number of households with income > $200k:| Goodings Grove: | 4.1% (2,266) |
| Illinois: | 4.1% (1,198) |
Median per capita income in Goodings Grove in 2022:| Goodings Grove: | $41,787 |
| State: | $26,979 |
Change in median per capita income between 2000 and 2022:| Goodings Grove, Illinois: | +34.5% |
| State: | +64.2% |
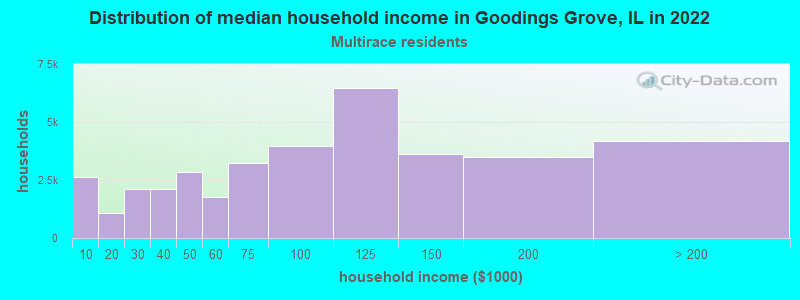
Income statistics for Multirace residents
Median household income in Goodings Grove, IL in 2022:| Goodings Grove: | $187,229 |
| Illinois: | $71,185 |
Change in median household income between 2000 and 2022:| Goodings Grove, Illinois: | +90.4% |
| State: | +81.4% |
Number of households with income < $10k:| Goodings Grove: | 7.0% (2,620) |
| State: | 5.3% (21,595) |
Number of households with income $10k - 20k:| Goodings Grove: | 2.9% (1,091) |
| State: | 6.5% (26,720) |
Number of households with income $20k - 30k:| Goodings Grove: | 5.6% (2,095) |
| State: | 8.0% (32,573) |
Number of households with income $30k - 40k:| Goodings Grove: | 5.7% (2,124) |
| State: | 8.4% (34,383) |
Number of households with income $40k - 50k:| Goodings Grove: | 7.6% (2,853) |
| State: | 7.4% (30,234) |
Number of households with income $50k - 60k:| Goodings Grove: | 4.7% (1,777) |
| State: | 6.9% (28,432) |
Number of households with income $60k - 75k:| Goodings Grove: | 8.7% (3,254) |
| State: | 10.2% (41,780) |
Number of households with income $75k - 100k:| Goodings Grove: | 10.6% (3,969) |
| State: | 13.0% (53,426) |
Number of households with income $100k - 125k:| Goodings Grove: | 17.2% (6,462) |
| Illinois: | 10.5% (43,126) |
Number of households with income $125k - 150k:| Goodings Grove: | 9.6% (3,615) |
| State: | 7.6% (31,153) |
Number of households with income $150k - 200k:| Goodings Grove: | 9.3% (3,472) |
| Illinois: | 7.6% (30,946) |
Number of households with income > $200k:| Goodings Grove: | 11.1% (4,169) |
| State: | 8.6% (35,208) |
Aggregate household income in Goodings Grove in 2022: $120,895,426
Median family income in Goodings Grove in 2022:| Goodings Grove: | $167,286 |
| State: | $84,400 |
Number of families with income $40k - 50k:| Goodings Grove: | 3.1% (30) |
| State: | 7.1% (19,595) |
Number of families with income $75k - 100k:| Goodings Grove: | 18.2% (177) |
| State: | 13.6% (37,857) |
Number of families with income $150k - 200k:| Goodings Grove: | 78.8% (768) |
| State: | 9.5% (26,306) |
Median per capita income in Goodings Grove in 2022:| Goodings Grove: | $60,463 |
| Illinois: | $29,285 |
Change in median per capita income between 2000 and 2022:| Goodings Grove, Illinois: | +114.1% |
| Illinois: | +112.9% |
Income statistics for other residents
Number of households with income < $10k:| Goodings Grove: | 4.8% (3,545) |
| State: | 5.7% (16,383) |
Number of households with income $10k - 20k:| Goodings Grove: | 1.4% (1,039) |
| State: | 4.8% (13,886) |
Number of households with income $20k - 30k:| Goodings Grove: | 10.1% (7,522) |
| State: | 7.0% (20,054) |
Number of households with income $30k - 40k:| Goodings Grove: | 4.5% (3,366) |
| Illinois: | 7.0% (20,038) |
Number of households with income $40k - 50k:| Goodings Grove: | 7.1% (5,243) |
| Illinois: | 8.3% (23,759) |
Number of households with income $50k - 60k:| Goodings Grove: | 3.4% (2,500) |
| State: | 7.8% (22,410) |
Number of households with income $60k - 75k:| Goodings Grove: | 17.8% (13,188) |
| State: | 12.0% (34,448) |
Number of households with income $75k - 100k:| Goodings Grove: | 25.2% (18,729) |
| State: | 16.2% (46,508) |
Number of households with income $100k - 125k:| Goodings Grove: | 8.1% (6,028) |
| State: | 12.5% (35,952) |
Number of households with income $125k - 150k:| Goodings Grove: | 8.8% (6,521) |
| State: | 6.9% (19,732) |
Number of households with income $150k - 200k:| Goodings Grove: | 4.5% (3,312) |
| State: | 7.5% (21,422) |
Number of households with income > $200k:| Goodings Grove: | 4.3% (3,193) |
| State: | 4.3% (12,194) |
Median per capita income in Goodings Grove in 2022:| Goodings Grove: | $139,817 |
| Illinois: | $25,392 |
Change in median per capita income between 2000 and 2022:| Goodings Grove, Illinois: | +72.3% |
| State: | +117.4% |