Goshen, Connecticut (CT) income map, earnings map, and wages data
The median household income in Goshen, CT in 2022 was $109,027, which was 18.9% greater than the median annual income of $88,429 across the entire state of Connecticut. Compared to the median income of $64,432 in 2000 this represents an increase of 40.9%. The per capita income in 2022 was $62,058, which means an increase of 45.3% compared to 2000 when it was $33,925.
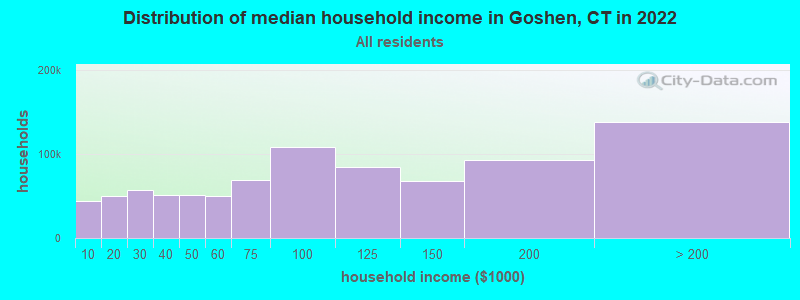
Income statistics for all residents
Median household income in Goshen, CT in 2022:| Goshen: | $109,028 |
| Connecticut: | $88,429 |
Change in median household income between 2000 and 2022:| Goshen, Connecticut: | +69.2% |
| State: | +64.0% |
Number of households with income < $10k:| Goshen: | 5.2% (44,409) |
| State: | 5.1% (72,746) |
Number of households with income $10k - 20k:| Goshen: | 5.8% (50,077) |
| State: | 5.7% (81,643) |
Number of households with income $20k - 30k:| Goshen: | 6.6% (56,683) |
| Connecticut: | 6.5% (92,844) |
Number of households with income $30k - 40k:| Goshen: | 5.9% (50,870) |
| State: | 5.9% (83,934) |
Number of households with income $40k - 50k:| Goshen: | 5.9% (50,543) |
| Connecticut: | 5.8% (83,025) |
Number of households with income $50k - 60k:| Goshen: | 5.8% (49,561) |
| State: | 5.7% (81,788) |
Number of households with income $60k - 75k:| Goshen: | 8.1% (69,441) |
| State: | 8.1% (115,651) |
Number of households with income $75k - 100k:| Goshen: | 12.6% (108,452) |
| State: | 12.6% (180,173) |
Number of households with income $100k - 125k:| Goshen: | 9.8% (84,428) |
| State: | 9.9% (141,231) |
Number of households with income $125k - 150k:| Goshen: | 7.8% (67,424) |
| Connecticut: | 7.9% (112,826) |
Number of households with income $150k - 200k:| Goshen: | 10.7% (92,231) |
| State: | 10.8% (154,641) |
Number of households with income > $200k:| Goshen: | 16.0% (137,787) |
| State: | 16.3% (233,133) |
Aggregate household income in Goshen in 2022: $3,893,508,827
Median family income in Goshen in 2022:| Goshen: | $129,399 |
| Connecticut: | $115,183 |
Median non-family income in Goshen in 2022:| Goshen: | $59,451 |
| Connecticut: | $50,964 |
Change in median non-family income between 2000 and 2022:| Goshen, Connecticut: | +71.5% |
| Connecticut: | +65.1% |
Median per capita income in Goshen in 2022:| Goshen: | $62,059 |
| State: | $51,581 |
Change in median per capita income between 2000 and 2022:| Goshen, Connecticut: | +82.9% |
| State: | +79.3% |
Income statistics for White residents
Median household income in Goshen, CT in 2022:| Goshen: | $110,722 |
| Connecticut: | $96,890 |
Change in median household income between 2000 and 2022:| Goshen, Connecticut: | +69.4% |
| State: | +68.5% |
Number of households with income < $10k:| Goshen: | 4.2% (24,217) |
| Connecticut: | 4.2% (42,265) |
Number of households with income $10k - 20k:| Goshen: | 4.9% (27,843) |
| State: | 4.8% (48,323) |
Number of households with income $20k - 30k:| Goshen: | 5.8% (33,112) |
| Connecticut: | 5.7% (57,716) |
Number of households with income $30k - 40k:| Goshen: | 5.4% (30,650) |
| State: | 5.3% (53,827) |
Number of households with income $40k - 50k:| Goshen: | 5.3% (30,524) |
| State: | 5.3% (53,301) |
Number of households with income $50k - 60k:| Goshen: | 5.6% (31,766) |
| State: | 5.5% (55,690) |
Number of households with income $60k - 75k:| Goshen: | 7.9% (45,395) |
| State: | 8.0% (80,329) |
Number of households with income $75k - 100k:| Goshen: | 12.7% (72,740) |
| State: | 12.7% (128,070) |
Number of households with income $100k - 125k:| Goshen: | 10.0% (57,118) |
| State: | 10.0% (101,210) |
Number of households with income $125k - 150k:| Goshen: | 8.0% (45,856) |
| State: | 8.0% (81,250) |
Number of households with income $150k - 200k:| Goshen: | 11.8% (67,427) |
| Connecticut: | 11.8% (119,527) |
Number of households with income > $200k:| Goshen: | 18.4% (105,553) |
| State: | 18.6% (187,875) |
Aggregate household income in Goshen in 2022: $2,908,581,956
Median family income in Goshen in 2022:| Goshen: | $133,577 |
| State: | $128,955 |
Number of families with income < $10k:| Goshen: | 3.7% (27) |
| State: | 1.9% (11,537) |
Number of families with income $10k - 20k:| Goshen: | 0.8% (6) |
| State: | 1.8% (11,289) |
Number of families with income $20k - 30k:| Goshen: | 1.4% (10) |
| State: | 3.0% (18,506) |
Number of families with income $30k - 40k:| Goshen: | 4.0% (29) |
| State: | 2.9% (18,160) |
Number of families with income $40k - 50k:| Goshen: | 3.4% (24) |
| State: | 3.9% (24,550) |
Number of families with income $50k - 60k:| Goshen: | 4.1% (29) |
| State: | 4.3% (26,723) |
Number of families with income $60k - 75k:| Goshen: | 8.4% (61) |
| State: | 7.1% (44,075) |
Number of families with income $75k - 100k:| Goshen: | 15.0% (108) |
| State: | 12.5% (77,679) |
Number of families with income $100k - 125k:| Goshen: | 9.7% (70) |
| State: | 11.1% (69,086) |
Number of families with income $125k - 150k:| Goshen: | 9.2% (66) |
| State: | 9.6% (59,616) |
Number of families with income $150k - 200k:| Goshen: | 13.7% (99) |
| Connecticut: | 15.7% (97,890) |
Number of families with income > $200k:| Goshen: | 26.7% (193) |
| Connecticut: | 26.3% (163,417) |
Median non-family income in Goshen in 2022:| Goshen: | $59,187 |
| State: | $54,067 |
Change in median non-family income between 2000 and 2022:| Goshen, Connecticut: | +73.7% |
| Connecticut: | +68.7% |
Median per capita income in Goshen in 2022:| Goshen: | $64,840 |
| State: | $59,916 |
Change in median per capita income between 2000 and 2022:| Goshen, Connecticut: | +92.1% |
| Connecticut: | +90.2% |
Income statistics for Black or African American residents
Median household income in Goshen, CT in 2022:| Goshen: | $74,420 |
| State: | $61,803 |
Change in median household income between 2000 and 2022:| Goshen, Connecticut: | +60.9% |
| State: | +76.1% |
Number of households with income < $10k:| Goshen: | 6.8% (12,508) |
| State: | 6.8% (9,494) |
Number of households with income $10k - 20k:| Goshen: | 7.9% (14,496) |
| State: | 7.9% (11,003) |
Number of households with income $20k - 30k:| Goshen: | 10.8% (19,822) |
| State: | 10.8% (15,045) |
Number of households with income $30k - 40k:| Goshen: | 8.2% (15,152) |
| State: | 8.2% (11,501) |
Number of households with income $40k - 50k:| Goshen: | 7.4% (13,724) |
| State: | 7.4% (10,416) |
Number of households with income $50k - 60k:| Goshen: | 7.5% (13,879) |
| Connecticut: | 7.5% (10,534) |
Number of households with income $60k - 75k:| Goshen: | 8.0% (14,814) |
| State: | 8.0% (11,244) |
Number of households with income $75k - 100k:| Goshen: | 9.6% (17,615) |
| State: | 9.6% (13,370) |
Number of households with income $100k - 125k:| Goshen: | 10.2% (18,767) |
| State: | 10.2% (14,244) |
Number of households with income $125k - 150k:| Goshen: | 8.0% (14,817) |
| State: | 8.0% (11,246) |
Number of households with income $150k - 200k:| Goshen: | 7.7% (14,133) |
| State: | 7.7% (10,727) |
Number of households with income > $200k:| Goshen: | 7.9% (14,606) |
| State: | 7.9% (11,086) |
Aggregate household income in Goshen in 2022: $690,698
Median non-family income in Goshen in 2022:| Goshen: | $81,853 |
| Connecticut: | $38,608 |
Change in median non-family income between 2000 and 2022:| Goshen, Connecticut: | +77.0% |
| Connecticut: | +77.0% |
Median per capita income in Goshen in 2022:| Goshen: | $49,465 |
| State: | $36,289 |
Change in median per capita income between 2000 and 2022:| Goshen, Connecticut: | +115.2% |
| State: | +117.5% |
Income statistics for Hispanic or Latino residents
Median household income in Goshen, CT in 2022:| Goshen: | $136,333 |
| State: | $60,275 |
Change in median household income between 2000 and 2022:| Goshen, Connecticut: | +67.8% |
| State: | +87.9% |
Number of households with income < $10k:| Goshen: | 8.7% (47,076) |
| State: | 8.7% (18,584) |
Number of households with income $10k - 20k:| Goshen: | 9.1% (48,725) |
| Connecticut: | 9.1% (19,235) |
Number of households with income $20k - 30k:| Goshen: | 8.9% (48,101) |
| State: | 8.9% (18,989) |
Number of households with income $30k - 40k:| Goshen: | 7.5% (40,446) |
| State: | 7.5% (15,967) |
Number of households with income $40k - 50k:| Goshen: | 8.7% (46,777) |
| State: | 8.7% (18,466) |
Number of households with income $50k - 60k:| Goshen: | 6.9% (37,252) |
| State: | 6.9% (14,706) |
Number of households with income $60k - 75k:| Goshen: | 8.9% (47,846) |
| State: | 8.9% (18,888) |
Number of households with income $75k - 100k:| Goshen: | 13.5% (72,622) |
| Connecticut: | 13.5% (28,669) |
Number of households with income $100k - 125k:| Goshen: | 8.2% (44,163) |
| Connecticut: | 8.2% (17,434) |
Number of households with income $125k - 150k:| Goshen: | 6.5% (34,836) |
| Connecticut: | 6.5% (13,752) |
Number of households with income $150k - 200k:| Goshen: | 6.6% (35,753) |
| Connecticut: | 6.6% (14,114) |
Number of households with income > $200k:| Goshen: | 6.4% (34,527) |
| State: | 6.4% (13,630) |
Aggregate household income in Goshen in 2022: $5,830,136
Median family income in Goshen in 2022:| Goshen: | $139,003 |
| Connecticut: | $68,336 |
Number of families with income < $10k:| Goshen: | 8.5% (13) |
| State: | 5.2% (7,456) |
Number of families with income $10k - 20k:| Goshen: | 2.7% (4) |
| Connecticut: | 6.0% (8,616) |
Number of families with income $20k - 30k:| Goshen: | 5.2% (8) |
| State: | 8.9% (12,680) |
Number of families with income $30k - 40k:| Goshen: | 10.6% (17) |
| State: | 8.5% (12,090) |
Number of families with income $40k - 50k:| Goshen: | 7.7% (12) |
| Connecticut: | 8.8% (12,624) |
Number of families with income $50k - 60k:| Goshen: | 8.8% (14) |
| State: | 8.4% (11,924) |
Number of families with income $60k - 75k:| Goshen: | 10.5% (17) |
| State: | 8.9% (12,677) |
Number of families with income $75k - 100k:| Goshen: | 18.2% (29) |
| State: | 14.3% (20,457) |
Number of families with income $100k - 125k:| Goshen: | 6.7% (11) |
| Connecticut: | 8.2% (11,720) |
Number of families with income $125k - 150k:| Goshen: | 8.0% (13) |
| State: | 8.2% (11,729) |
Number of families with income $150k - 200k:| Goshen: | 6.0% (9) |
| Connecticut: | 7.1% (10,096) |
Number of families with income > $200k:| Goshen: | 6.9% (11) |
| Connecticut: | 7.4% (10,622) |
Median per capita income in Goshen in 2022:| Goshen: | $54,004 |
| Connecticut: | $28,507 |
Change in median per capita income between 2000 and 2022:| Goshen, Connecticut: | +80.3% |
| State: | +117.2% |
Income statistics for American Indian and Alaska Native residents
Median household income in Goshen, CT in 2022:| Goshen: | $70,823 |
| Connecticut: | $41,848 |
Change in median household income between 2000 and 2022:| Goshen, Connecticut: | +12.9% |
| Connecticut: | +12.9% |
Number of households with income < $10k:| Goshen: | 8.4% (178,433) |
| State: | 10.2% (340) |
Number of households with income $10k - 20k:| Goshen: | 9.4% (199,127) |
| Connecticut: | 8.5% (283) |
Number of households with income $20k - 30k:| Goshen: | 8.5% (180,113) |
| State: | 9.4% (314) |
Number of households with income $30k - 40k:| Goshen: | 9.1% (192,969) |
| State: | 10.1% (337) |
Number of households with income $40k - 50k:| Goshen: | 8.3% (177,004) |
| State: | 13.4% (447) |
Number of households with income $50k - 60k:| Goshen: | 7.8% (166,900) |
| State: | 3.1% (104) |
Number of households with income $60k - 75k:| Goshen: | 9.8% (208,033) |
| Connecticut: | 5.6% (188) |
Number of households with income $75k - 100k:| Goshen: | 12.6% (268,538) |
| Connecticut: | 13.4% (447) |
Number of households with income $100k - 125k:| Goshen: | 9.4% (200,813) |
| State: | 9.5% (317) |
Number of households with income $125k - 150k:| Goshen: | 5.6% (120,226) |
| State: | 3.9% (131) |
Number of households with income $150k - 200k:| Goshen: | 6.0% (126,741) |
| Connecticut: | 6.3% (212) |
Number of households with income > $200k:| Goshen: | 5.2% (109,701) |
| Connecticut: | 6.8% (228) |
Aggregate household income in Goshen in 2022: $555,527
Median family income in Goshen in 2022:| Goshen: | $85,743 |
| State: | $57,217 |
Median per capita income in Goshen in 2022:| Goshen: | $44,070 |
| State: | $25,355 |
Change in median per capita income between 2000 and 2022:| Goshen, Connecticut: | +45.9% |
| State: | +39.4% |
Income statistics for Multirace residents
Median household income in Goshen, CT in 2022:| Goshen: | $135,780 |
| State: | $77,277 |
Change in median household income between 2000 and 2022:| Goshen, Connecticut: | +119.4% |
| Connecticut: | +113.6% |
Number of households with income < $10k:| Goshen: | 6.0% (12,751) |
| State: | 6.0% (7,457) |
Number of households with income $10k - 20k:| Goshen: | 8.1% (17,337) |
| State: | 8.1% (10,139) |
Number of households with income $20k - 30k:| Goshen: | 7.0% (14,879) |
| Connecticut: | 7.0% (8,702) |
Number of households with income $30k - 40k:| Goshen: | 6.9% (14,613) |
| State: | 6.9% (8,546) |
Number of households with income $40k - 50k:| Goshen: | 7.0% (14,897) |
| State: | 7.0% (8,712) |
Number of households with income $50k - 60k:| Goshen: | 5.9% (12,535) |
| Connecticut: | 5.9% (7,331) |
Number of households with income $60k - 75k:| Goshen: | 8.5% (18,183) |
| State: | 8.5% (10,634) |
Number of households with income $75k - 100k:| Goshen: | 14.1% (30,095) |
| State: | 14.1% (17,600) |
Number of households with income $100k - 125k:| Goshen: | 9.9% (21,174) |
| State: | 9.9% (12,383) |
Number of households with income $125k - 150k:| Goshen: | 7.2% (15,254) |
| State: | 7.2% (8,921) |
Number of households with income $150k - 200k:| Goshen: | 8.8% (18,676) |
| State: | 8.8% (10,922) |
Number of households with income > $200k:| Goshen: | 10.6% (22,651) |
| Connecticut: | 10.6% (13,247) |
Aggregate household income in Goshen in 2022: $16,783,575
Median family income in Goshen in 2022:| Goshen: | $215,852 |
| State: | $84,255 |
Number of families with income $60k - 75k:| Goshen: | 20.5% (15) |
| State: | 7.8% (6,550) |
Number of families with income $100k - 125k:| Goshen: | 79.5% (59) |
| State: | 9.2% (7,787) |
Median non-family income in Goshen in 2022:| Goshen: | $110,876 |
| State: | $44,462 |
Change in median non-family income between 2000 and 2022:| Goshen, Connecticut: | +81.0% |
| Connecticut: | +97.6% |
Median per capita income in Goshen in 2022:| Goshen: | $142,503 |
| State: | $32,794 |
Change in median per capita income between 2000 and 2022:| Goshen, Connecticut: | +95.5% |
| State: | +117.2% |