The median household income in Grand Mound, WA in 2022 was $59,666, which was 53.0% less than the median annual income of $91,306 across the entire state of Washington. Compared to the median income of $42,153 in 2000 this represents an increase of 29.4%. The per capita income in 2022 was $29,274, which means an increase of 45.3% compared to 2000 when it was $16,008.
Whole page based on the data from 2000 / 2022 when the population of Grand Mound, Washington was 1,948 / 3,494
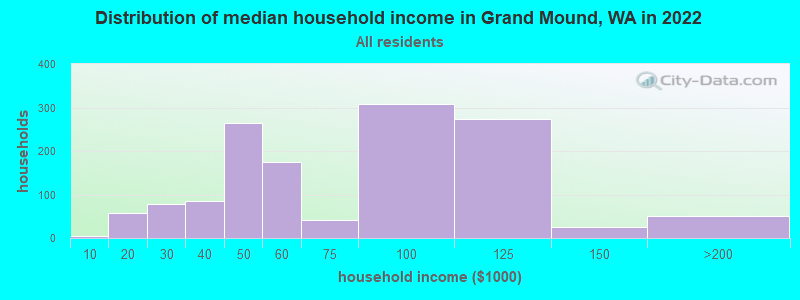
Income statistics for all residents
Median household income in Grand Mound, WA in 2022:
Grand Mound:
$59,667
Washington:
$91,306
Change in median household income between 2000 and 2022:
Grand Mound, Washington:
+41.5%
State:
+99.5%
Number of households with income < $10k:
Grand Mound:
0.4% (5)
State:
4.5% (139,331)
Number of households with income $10k - 20k:
Grand Mound:
4.2% (57)
State:
5.0% (154,508)
Number of households with income $20k - 30k:
Grand Mound:
5.7% (78)
State:
5.4% (166,555)
Number of households with income $30k - 40k:
Grand Mound:
6.2% (84)
State:
5.5% (170,324)
Number of households with income $40k - 50k:
Grand Mound:
19.4% (265)
State:
6.0% (183,941)
Number of households with income $50k - 60k:
Grand Mound:
12.8% (174)
State:
6.1% (187,395)
Number of households with income $60k - 75k:
Grand Mound:
3.1% (42)
State:
8.7% (266,771)
Number of households with income $75k - 100k:
Grand Mound:
22.6% (308)
Washington:
13.1% (404,672)
Number of households with income $100k - 125k:
Grand Mound:
20.1% (274)
State:
11.0% (337,911)
Number of households with income $125k - 150k:
Grand Mound:
1.8% (25)
State:
8.0% (244,934)
Number of households with income $150k - 200k:
Grand Mound:
3.7% (51)
State:
10.5% (323,812)
Number of households with income > $200k:
Grand Mound:
0.0% (0)
State:
16.2% (499,799)
Aggregate household income in Grand Mound in 2022: $98,288,328
Median family income in Grand Mound in 2022:
Grand Mound:
$83,203
State:
$109,192
Number of families with income < $10k:
Grand Mound:
0.4% (3)
State:
2.9% (55,953)
Number of families with income $10k - 20k:
Grand Mound:
2.3% (19)
Washington:
2.6% (50,138)
Number of families with income $20k - 30k:
Grand Mound:
3.2% (26)
Washington:
3.2% (61,974)
Number of families with income $30k - 40k:
Grand Mound:
0.2% (1)
State:
4.1% (80,240)
Number of families with income $40k - 50k:
Grand Mound:
20.0% (162)
State:
4.9% (94,310)
Number of families with income $50k - 60k:
Grand Mound:
10.3% (83)
State:
5.3% (101,674)
Number of families with income $60k - 75k:
Grand Mound:
4.5% (37)
Washington:
8.2% (158,348)
Number of families with income $75k - 100k:
Grand Mound:
23.0% (186)
State:
13.8% (267,812)
Number of families with income $100k - 125k:
Grand Mound:
28.6% (232)
Washington:
12.4% (240,213)
Number of families with income $125k - 150k:
Grand Mound:
3.1% (25)
Washington:
9.3% (180,011)
Number of families with income $150k - 200k:
Grand Mound:
4.4% (36)
State:
13.0% (250,874)
Median non-family income in Grand Mound in 2022:
Grand Mound:
$51,537
State:
$57,299
Change in median non-family income between 2000 and 2022:
Grand Mound, Washington:
+50.2%
State:
+94.9%
Median per capita income in Grand Mound in 2022:
Grand Mound:
$29,275
State:
$50,764
Change in median per capita income between 2000 and 2022:
Grand Mound, Washington:
+82.9%
Washington:
+121.0%
Income statistics for White residents
Median household income in Grand Mound, WA in 2022:
Grand Mound:
$62,931
State:
$91,916
Change in median household income between 2000 and 2022:
Grand Mound, Washington:
+48.2%
Washington:
+95.4%
Number of households with income < $10k:
Grand Mound:
0.5% (5)
Washington:
4.3% (95,850)
Number of households with income $10k - 20k:
Grand Mound:
5.4% (59)
Washington:
4.8% (106,421)
Number of households with income $20k - 30k:
Grand Mound:
7.3% (80)
Washington:
5.5% (122,860)
Number of households with income $30k - 40k:
Grand Mound:
7.7% (84)
State:
5.4% (119,627)
Number of households with income $40k - 50k:
Grand Mound:
11.1% (122)
State:
5.9% (132,276)
Number of households with income $50k - 60k:
Grand Mound:
14.9% (164)
Washington:
6.1% (136,212)
Number of households with income $60k - 75k:
Grand Mound:
3.3% (36)
Washington:
8.8% (196,086)
Number of households with income $75k - 100k:
Grand Mound:
19.1% (210)
State:
13.4% (299,192)
Number of households with income $100k - 125k:
Grand Mound:
24.2% (266)
State:
11.3% (252,209)
Number of households with income $125k - 150k:
Grand Mound:
2.1% (23)
State:
7.9% (175,962)
Number of households with income $150k - 200k:
Grand Mound:
4.4% (48)
State:
10.7% (239,156)
Number of households with income > $200k:
Grand Mound:
0.0% (0)
State:
16.1% (359,917)
Aggregate household income in Grand Mound in 2022: $78,713,997
Median family income in Grand Mound in 2022:
Grand Mound:
$90,948
State:
$112,511
Number of families with income < $10k:
Grand Mound:
0.6% (4)
Washington:
2.4% (33,676)
Number of families with income $10k - 20k:
Grand Mound:
3.4% (22)
State:
2.0% (28,228)
Number of families with income $20k - 30k:
Grand Mound:
5.3% (34)
State:
2.9% (39,288)
Number of families with income $30k - 40k:
Grand Mound:
0.3% (2)
State:
3.6% (50,190)
Number of families with income $40k - 50k:
Grand Mound:
8.0% (52)
Washington:
4.6% (63,009)
Number of families with income $50k - 60k:
Grand Mound:
10.6% (69)
State:
5.0% (69,270)
Number of families with income $60k - 75k:
Grand Mound:
5.1% (33)
Washington:
8.2% (112,369)
Number of families with income $75k - 100k:
Grand Mound:
24.2% (157)
State:
14.1% (194,214)
Number of families with income $100k - 125k:
Grand Mound:
33.6% (217)
Washington:
13.2% (182,184)
Number of families with income $125k - 150k:
Grand Mound:
3.7% (24)
State:
9.5% (130,928)
Number of families with income $150k - 200k:
Grand Mound:
5.3% (35)
State:
13.7% (188,621)
Median non-family income in Grand Mound in 2022:
Grand Mound:
$48,152
Washington:
$56,103
Change in median non-family income between 2000 and 2022:
Grand Mound, Washington:
+18.9%
State:
+87.7%
Median per capita income in Grand Mound in 2022:
Grand Mound:
$29,952
State:
$55,212
Change in median per capita income between 2000 and 2022:
Grand Mound, Washington:
+80.6%
Washington:
+123.8%
Income statistics for Asian residents
Number of households with income < $10k:
Grand Mound:
0.0% (0)
State:
4.9% (14,099)
Number of households with income $10k - 20k:
Grand Mound:
0.0% (0)
Washington:
3.5% (9,873)
Number of households with income $20k - 30k:
Grand Mound:
0.0% (0)
State:
2.9% (8,352)
Number of households with income $30k - 40k:
Grand Mound:
0.0% (0)
Washington:
4.0% (11,415)
Number of households with income $40k - 50k:
Grand Mound:
78.9% (45)
State:
4.0% (11,421)
Number of households with income $50k - 60k:
Grand Mound:
21.1% (12)
State:
4.2% (12,100)
Number of households with income $60k - 75k:
Grand Mound:
0.0% (0)
Washington:
6.3% (17,903)
Number of households with income $75k - 100k:
Grand Mound:
0.0% (0)
State:
10.4% (29,663)
Number of households with income $100k - 125k:
Grand Mound:
0.0% (0)
State:
9.4% (26,839)
Number of households with income $125k - 150k:
Grand Mound:
0.0% (0)
State:
8.5% (24,200)
Number of households with income $150k - 200k:
Grand Mound:
0.0% (0)
Washington:
12.6% (35,976)
Number of households with income > $200k:
Grand Mound:
0.0% (0)
Washington:
29.2% (83,109)
Median per capita income in Grand Mound in 2022:
Grand Mound:
$48,552
State:
$67,666
Income statistics for Hispanic or Latino residents
Number of households with income < $10k:
Grand Mound:
0.0% (0)
State:
4.9% (14,456)
Number of households with income $10k - 20k:
Grand Mound:
0.0% (0)
State:
5.3% (15,449)
Number of households with income $20k - 30k:
Grand Mound:
9.8% (24)
State:
6.8% (20,016)
Number of households with income $30k - 40k:
Grand Mound:
0.0% (0)
Washington:
7.7% (22,548)
Number of households with income $40k - 50k:
Grand Mound:
27.2% (67)
State:
7.3% (21,450)
Number of households with income $50k - 60k:
Grand Mound:
0.0% (0)
State:
7.7% (22,744)
Number of households with income $60k - 75k:
Grand Mound:
0.0% (0)
State:
10.5% (30,737)
Number of households with income $75k - 100k:
Grand Mound:
63.0% (155)
State:
14.9% (43,843)
Number of households with income $100k - 125k:
Grand Mound:
0.0% (0)
State:
11.1% (32,554)
Number of households with income $125k - 150k:
Grand Mound:
0.0% (0)
Washington:
7.4% (21,624)
Number of households with income $150k - 200k:
Grand Mound:
0.0% (0)
State:
7.3% (21,360)
Number of households with income > $200k:
Grand Mound:
0.0% (0)
State:
9.2% (27,055)
Aggregate household income in Grand Mound in 2022: $21,529,678
Median family income in Grand Mound in 2022:
Grand Mound:
$64,832
Washington:
$76,866
Number of families with income $20k - 30k:
Grand Mound:
13.2% (22)
State:
5.6% (12,052)
Number of families with income $40k - 50k:
Grand Mound:
50.5% (84)
State:
7.7% (16,361)
Number of families with income $75k - 100k:
Grand Mound:
36.3% (60)
Washington:
14.4% (30,698)
Median per capita income in Grand Mound in 2022:
Grand Mound:
$22,647
State:
$28,252
Change in median per capita income between 2000 and 2022:
Grand Mound, Washington:
+122.9%
State:
+150.2%
Income statistics for American Indian and Alaska Native residents
Median per capita income in Grand Mound in 2022:
Grand Mound:
$19,783
State:
$27,053
Change in median per capita income between 2000 and 2022:
Grand Mound, Washington:
+31.2%
State:
+98.6%
Income statistics for Multirace residents
Median household income in Grand Mound, WA in 2022:
Grand Mound:
$104,340
Washington:
$84,303
Change in median household income between 2000 and 2022:
Grand Mound, Washington:
+29.6%
State:
+125.7%
Number of households with income < $10k:
Grand Mound:
0.0% (0)
Washington:
4.3% (12,040)
Number of households with income $10k - 20k:
Grand Mound:
0.0% (0)
State:
6.6% (18,437)
Number of households with income $20k - 30k:
Grand Mound:
0.0% (0)
State:
5.2% (14,559)
Number of households with income $30k - 40k:
Grand Mound:
0.0% (0)
State:
6.7% (18,491)
Number of households with income $40k - 50k:
Grand Mound:
0.0% (0)
Washington:
6.3% (17,459)
Number of households with income $50k - 60k:
Grand Mound:
3.9% (4)
State:
6.9% (19,086)
Number of households with income $60k - 75k:
Grand Mound:
0.0% (0)
State:
9.1% (25,310)
Number of households with income $75k - 100k:
Grand Mound:
85.4% (88)
Washington:
13.5% (37,493)
Number of households with income $100k - 125k:
Grand Mound:
10.7% (11)
State:
10.7% (29,626)
Number of households with income $125k - 150k:
Grand Mound:
0.0% (0)
State:
8.6% (23,899)
Number of households with income $150k - 200k:
Grand Mound:
0.0% (0)
Washington:
10.2% (28,214)
Number of households with income > $200k:
Grand Mound:
0.0% (0)
Washington:
11.9% (32,947)
Aggregate household income in Grand Mound in 2022: $9,612,791
Median per capita income in Grand Mound in 2022:
Grand Mound:
$38,607
State:
$32,496
Income statistics for other residents
Median household income in Grand Mound, WA in 2022:
Grand Mound:
$33,936
State:
$69,545
Number of households with income < $10k:
Grand Mound:
0.0% (0)
State:
5.3% (6,540)
Number of households with income $10k - 20k:
Grand Mound:
0.0% (0)
State:
6.0% (7,385)
Number of households with income $20k - 30k:
Grand Mound:
0.0% (0)
State:
7.5% (9,289)
Number of households with income $30k - 40k:
Grand Mound:
0.0% (0)
Washington:
8.9% (11,015)
Number of households with income $40k - 50k:
Grand Mound:
84.7% (83)
Washington:
7.6% (9,399)
Number of households with income $50k - 60k:
Grand Mound:
0.0% (0)
State:
7.2% (8,867)
Number of households with income $60k - 75k:
Grand Mound:
0.0% (0)
Washington:
10.5% (13,032)
Number of households with income $75k - 100k:
Grand Mound:
15.3% (15)
Washington:
14.6% (18,007)
Number of households with income $100k - 125k:
Grand Mound:
0.0% (0)
State:
12.2% (15,128)
Number of households with income $125k - 150k:
Grand Mound:
0.0% (0)
Washington:
5.6% (6,950)
Number of households with income $150k - 200k:
Grand Mound:
0.0% (0)
State:
7.1% (8,749)
Number of households with income > $200k:
Grand Mound:
0.0% (0)
State:
7.5% (9,208)
Aggregate household income in Grand Mound in 2022: $5,420,316
Median family income in Grand Mound in 2022:
Grand Mound:
$56,093
Washington:
$72,588
Number of families with income $40k - 50k:
Grand Mound:
86.3% (92)
State:
8.0% (7,634)
Number of families with income $60k - 75k:
Grand Mound:
0.9% (1)
State:
10.3% (9,864)
Number of families with income $75k - 100k:
Grand Mound:
12.8% (14)
Washington:
14.5% (13,800)
Median per capita income in Grand Mound in 2022:
Grand Mound:
$14,439
Washington:
$27,542
Change in median per capita income between 2000 and 2022:
Grand Mound, Washington:
+34.9%
State:
+167.8%
Discuss Grand Mound, Washington (WA) on our hugely popular Washington forum.