The median household income in Green Tree, PA in 2022 was $85,846, which was 16.4% greater than the median annual income of $71,798 across the entire state of Pennsylvania. Compared to the median income of $54,159 in 2000 this represents an increase of 36.9%. The per capita income in 2022 was $48,992, which means an increase of 43.9% compared to 2000 when it was $27,480.
Whole page based on the data from 2000 / 2022 when the population of Green Tree, Pennsylvania was 4,719 / 4,823
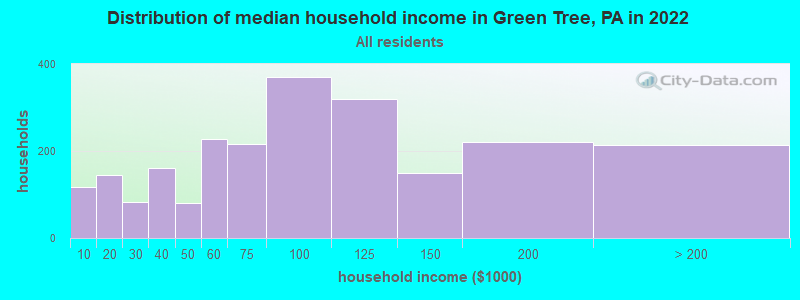
Income statistics for all residents
Median household income in Green Tree, PA in 2022:
Green Tree:
$85,847
State:
$71,798
Change in median household income between 2000 and 2022:
Green Tree, Pennsylvania:
+58.5%
State:
+79.0%
Number of households with income < $10k:
Green Tree:
5.1% (117)
State:
5.5% (291,562)
Number of households with income $10k - 20k:
Green Tree:
6.3% (145)
State:
7.3% (384,726)
Number of households with income $20k - 30k:
Green Tree:
3.6% (83)
State:
7.4% (389,464)
Number of households with income $30k - 40k:
Green Tree:
7.0% (161)
State:
7.6% (402,138)
Number of households with income $40k - 50k:
Green Tree:
3.5% (80)
State:
7.3% (387,945)
Number of households with income $50k - 60k:
Green Tree:
9.9% (227)
State:
7.0% (372,468)
Number of households with income $60k - 75k:
Green Tree:
9.3% (215)
State:
9.9% (524,786)
Number of households with income $75k - 100k:
Green Tree:
16.1% (371)
State:
12.6% (666,253)
Number of households with income $100k - 125k:
Green Tree:
13.9% (319)
State:
9.9% (526,402)
Number of households with income $125k - 150k:
Green Tree:
6.5% (149)
Pennsylvania:
6.9% (362,702)
Number of households with income $150k - 200k:
Green Tree:
9.6% (221)
State:
8.3% (440,827)
Number of households with income > $200k:
Green Tree:
9.3% (213)
State:
10.3% (544,792)
Aggregate household income in Green Tree in 2022: $232,338,439
Median family income in Green Tree in 2022:
Green Tree:
$106,763
State:
$93,029
Number of families with income < $10k:
Green Tree:
2.0% (27)
Pennsylvania:
3.1% (101,868)
Number of families with income $10k - 20k:
Green Tree:
1.5% (21)
Pennsylvania:
3.5% (115,881)
Number of families with income $20k - 30k:
Green Tree:
2.2% (30)
State:
4.8% (156,521)
Number of families with income $30k - 40k:
Green Tree:
2.4% (33)
Pennsylvania:
5.8% (191,305)
Number of families with income $50k - 60k:
Green Tree:
16.6% (227)
State:
6.4% (209,910)
Number of families with income $60k - 75k:
Green Tree:
6.6% (89)
State:
9.7% (318,991)
Number of families with income $75k - 100k:
Green Tree:
13.0% (177)
Pennsylvania:
14.0% (461,021)
Number of families with income $100k - 125k:
Green Tree:
18.7% (255)
Pennsylvania:
12.2% (400,961)
Number of families with income $125k - 150k:
Green Tree:
10.0% (136)
State:
8.8% (288,471)
Number of families with income $150k - 200k:
Green Tree:
12.7% (173)
Pennsylvania:
11.2% (367,642)
Number of families with income > $200k:
Green Tree:
14.2% (194)
Pennsylvania:
14.3% (470,863)
Median non-family income in Green Tree in 2022:
Green Tree:
$45,274
Pennsylvania:
$42,203
Change in median non-family income between 2000 and 2022:
Green Tree, Pennsylvania:
+38.3%
Pennsylvania:
+90.1%
Median per capita income in Green Tree in 2022:
Green Tree:
$48,993
Pennsylvania:
$41,489
Change in median per capita income between 2000 and 2022:
Green Tree, Pennsylvania:
+78.3%
State:
+98.7%
Income statistics for White residents
Median household income in Green Tree, PA in 2022:
Green Tree:
$84,322
Pennsylvania:
$76,765
Change in median household income between 2000 and 2022:
Green Tree, Pennsylvania:
+55.3%
State:
+84.3%
Number of households with income < $10k:
Green Tree:
5.3% (113)
Pennsylvania:
4.3% (179,792)
Number of households with income $10k - 20k:
Green Tree:
6.7% (142)
State:
6.5% (268,738)
Number of households with income $20k - 30k:
Green Tree:
4.3% (92)
State:
7.0% (288,138)
Number of households with income $30k - 40k:
Green Tree:
6.6% (140)
State:
7.2% (300,208)
Number of households with income $40k - 50k:
Green Tree:
3.9% (82)
State:
7.2% (298,756)
Number of households with income $50k - 60k:
Green Tree:
9.9% (210)
State:
6.8% (283,251)
Number of households with income $60k - 75k:
Green Tree:
9.6% (204)
Pennsylvania:
9.9% (408,159)
Number of households with income $75k - 100k:
Green Tree:
17.3% (365)
State:
13.2% (547,809)
Number of households with income $100k - 125k:
Green Tree:
14.2% (300)
State:
10.5% (436,652)
Number of households with income $125k - 150k:
Green Tree:
5.9% (124)
Pennsylvania:
7.3% (304,132)
Number of households with income $150k - 200k:
Green Tree:
8.6% (181)
Pennsylvania:
9.0% (374,658)
Number of households with income > $200k:
Green Tree:
7.7% (162)
State:
10.9% (452,618)
Aggregate household income in Green Tree in 2022: $204,235,686
Median family income in Green Tree in 2022:
Green Tree:
$105,092
Pennsylvania:
$99,396
Number of families with income < $10k:
Green Tree:
1.7% (22)
State:
2.2% (56,136)
Number of families with income $10k - 20k:
Green Tree:
2.0% (25)
Pennsylvania:
2.7% (69,032)
Number of families with income $20k - 30k:
Green Tree:
2.8% (35)
State:
3.9% (100,065)
Number of families with income $30k - 40k:
Green Tree:
2.3% (29)
State:
5.2% (134,367)
Number of families with income $50k - 60k:
Green Tree:
18.2% (226)
State:
6.1% (157,983)
Number of families with income $60k - 75k:
Green Tree:
6.9% (86)
Pennsylvania:
9.6% (249,292)
Number of families with income $75k - 100k:
Green Tree:
13.3% (166)
State:
14.7% (379,316)
Number of families with income $100k - 125k:
Green Tree:
19.0% (236)
Pennsylvania:
12.9% (333,626)
Number of families with income $125k - 150k:
Green Tree:
9.7% (121)
State:
9.4% (243,915)
Number of families with income $150k - 200k:
Green Tree:
12.4% (155)
Pennsylvania:
12.2% (314,926)
Number of families with income > $200k:
Green Tree:
11.5% (143)
State:
15.1% (390,885)
Median non-family income in Green Tree in 2022:
Green Tree:
$42,332
Pennsylvania:
$44,251
Change in median non-family income between 2000 and 2022:
Green Tree, Pennsylvania:
+26.6%
State:
+94.2%
Median per capita income in Green Tree in 2022:
Green Tree:
$48,275
Pennsylvania:
$45,306
Change in median per capita income between 2000 and 2022:
Green Tree, Pennsylvania:
+75.9%
Pennsylvania:
+105.4%
Income statistics for Black or African American residents
Median per capita income in Green Tree in 2022:
Green Tree:
$57,683
Pennsylvania:
$28,010
Change in median per capita income between 2000 and 2022:
Green Tree, Pennsylvania:
+89.3%
Pennsylvania:
+101.5%
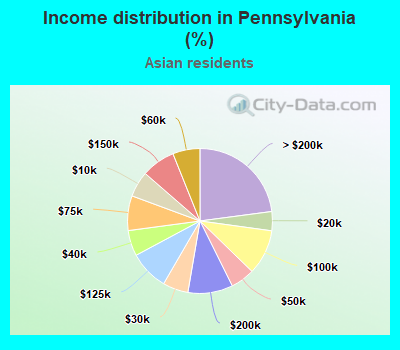
Income statistics for Asian residents
Median household income in Green Tree, PA in 2022:
Green Tree:
$194,447
Pennsylvania:
$98,296
Number of households with income < $10k:
Green Tree:
0.0% (0)
State:
5.8% (9,650)
Number of households with income $10k - 20k:
Green Tree:
0.0% (0)
Pennsylvania:
4.3% (7,158)
Number of households with income $20k - 30k:
Green Tree:
0.0% (0)
Pennsylvania:
5.7% (9,531)
Number of households with income $30k - 40k:
Green Tree:
0.0% (0)
Pennsylvania:
5.7% (9,580)
Number of households with income $40k - 50k:
Green Tree:
0.0% (0)
Pennsylvania:
5.4% (9,050)
Number of households with income $50k - 60k:
Green Tree:
10.9% (15)
State:
6.1% (10,189)
Number of households with income $60k - 75k:
Green Tree:
0.0% (0)
State:
7.8% (13,008)
Number of households with income $75k - 100k:
Green Tree:
7.2% (10)
State:
10.1% (16,923)
Number of households with income $100k - 125k:
Green Tree:
7.2% (10)
Pennsylvania:
8.8% (14,765)
Number of households with income $125k - 150k:
Green Tree:
4.3% (6)
Pennsylvania:
7.5% (12,634)
Number of households with income $150k - 200k:
Green Tree:
25.4% (35)
Pennsylvania:
10.0% (16,823)
Number of households with income > $200k:
Green Tree:
44.9% (62)
State:
22.9% (38,426)
Aggregate household income in Green Tree in 2022: $25,089,086
Median family income in Green Tree in 2022:
Green Tree:
$206,747
Pennsylvania:
$115,357
Number of families with income $50k - 60k:
Green Tree:
9.8% (11)
State:
5.3% (6,562)
Number of families with income $75k - 100k:
Green Tree:
9.8% (11)
Pennsylvania:
8.9% (10,970)
Number of families with income $100k - 125k:
Green Tree:
13.3% (15)
State:
9.4% (11,585)
Number of families with income $150k - 200k:
Green Tree:
16.7% (19)
State:
11.4% (14,081)
Number of families with income > $200k:
Green Tree:
50.4% (57)
State:
27.8% (34,149)
Median per capita income in Green Tree in 2022:
Green Tree:
$77,380
State:
$48,341
Income statistics for Hispanic or Latino residents
Number of households with income < $10k:
Green Tree:
0.0% (0)
State:
8.7% (29,517)
Number of households with income $10k - 20k:
Green Tree:
0.0% (0)
State:
10.0% (33,785)
Number of households with income $20k - 30k:
Green Tree:
0.0% (0)
Pennsylvania:
9.9% (33,399)
Number of households with income $30k - 40k:
Green Tree:
0.0% (0)
Pennsylvania:
8.8% (29,878)
Number of households with income $40k - 50k:
Green Tree:
0.0% (0)
Pennsylvania:
8.5% (28,549)
Number of households with income $50k - 60k:
Green Tree:
0.0% (0)
Pennsylvania:
7.6% (25,792)
Number of households with income $60k - 75k:
Green Tree:
100.0% (26)
State:
10.6% (35,808)
Number of households with income $75k - 100k:
Green Tree:
0.0% (0)
State:
11.9% (40,287)
Number of households with income $100k - 125k:
Green Tree:
0.0% (0)
State:
8.0% (27,028)
Number of households with income $125k - 150k:
Green Tree:
0.0% (0)
Pennsylvania:
5.2% (17,622)
Number of households with income $150k - 200k:
Green Tree:
0.0% (0)
Pennsylvania:
5.2% (17,563)
Number of households with income > $200k:
Green Tree:
0.0% (0)
Pennsylvania:
5.5% (18,469)
Aggregate household income in Green Tree in 2022: $5,789,563
Median per capita income in Green Tree in 2022:
Green Tree:
$47,265
State:
$23,829
Income statistics for Multirace residents
Number of households with income < $10k:
Green Tree:
0.0% (0)
State:
7.8% (21,911)
Number of households with income $10k - 20k:
Green Tree:
0.0% (0)
Pennsylvania:
8.2% (22,847)
Number of households with income $20k - 30k:
Green Tree:
0.0% (0)
State:
8.7% (24,252)
Number of households with income $30k - 40k:
Green Tree:
50.0% (17)
Pennsylvania:
7.3% (20,502)
Number of households with income $40k - 50k:
Green Tree:
0.0% (0)
State:
7.7% (21,525)
Number of households with income $50k - 60k:
Green Tree:
0.0% (0)
Pennsylvania:
8.6% (24,174)
Number of households with income $60k - 75k:
Green Tree:
0.0% (0)
State:
11.9% (33,350)
Number of households with income $75k - 100k:
Green Tree:
0.0% (0)
State:
11.5% (32,274)
Number of households with income $100k - 125k:
Green Tree:
0.0% (0)
Pennsylvania:
8.3% (23,361)
Number of households with income $125k - 150k:
Green Tree:
50.0% (17)
State:
5.3% (14,784)
Number of households with income $150k - 200k:
Green Tree:
0.0% (0)
Pennsylvania:
6.9% (19,314)
Number of households with income > $200k:
Green Tree:
0.0% (0)
Pennsylvania:
7.8% (21,759)
Median per capita income in Green Tree in 2022:
Green Tree:
$19,333
State:
$27,581
Income statistics for other residents
Median per capita income in Green Tree in 2022:
Green Tree:
$127,715
Pennsylvania:
$24,779
Discuss Green Tree, Pennsylvania (PA) on our hugely popular Pennsylvania forum.