The median household income in Guilford, PA in 2022 was $124,841, which was 42.5% greater than the median annual income of $71,798 across the entire state of Pennsylvania. Compared to the median income of $60,594 in 2000 this represents an increase of 51.5%. The per capita income in 2022 was $46,266, which means an increase of 37.9% compared to 2000 when it was $28,723.
Whole page based on the data from 2000 / 2022 when the population of Guilford, Pennsylvania was 1,835 / 3,976
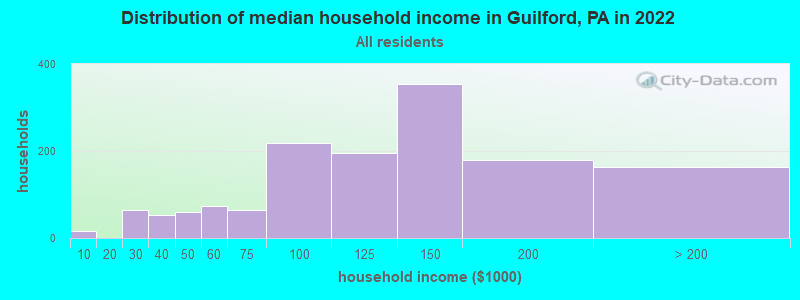
Income statistics for all residents
Median household income in Guilford, PA in 2022:
Guilford:
$124,841
Pennsylvania:
$71,798
Change in median household income between 2000 and 2022:
Guilford, Pennsylvania:
+106.0%
Pennsylvania:
+79.0%
Number of households with income < $10k:
Guilford:
1.1% (16)
Pennsylvania:
5.5% (291,562)
Number of households with income $10k - 20k:
Guilford:
0.0% (0)
State:
7.3% (384,726)
Number of households with income $20k - 30k:
Guilford:
4.5% (65)
State:
7.4% (389,464)
Number of households with income $30k - 40k:
Guilford:
3.7% (53)
State:
7.6% (402,138)
Number of households with income $40k - 50k:
Guilford:
4.1% (59)
State:
7.3% (387,945)
Number of households with income $50k - 60k:
Guilford:
5.1% (74)
Pennsylvania:
7.0% (372,468)
Number of households with income $60k - 75k:
Guilford:
4.5% (65)
State:
9.9% (524,786)
Number of households with income $75k - 100k:
Guilford:
15.2% (219)
State:
12.6% (666,253)
Number of households with income $100k - 125k:
Guilford:
13.5% (195)
State:
9.9% (526,402)
Number of households with income $125k - 150k:
Guilford:
24.6% (355)
State:
6.9% (362,702)
Number of households with income $150k - 200k:
Guilford:
12.4% (179)
Pennsylvania:
8.3% (440,827)
Number of households with income > $200k:
Guilford:
11.3% (163)
State:
10.3% (544,792)
Aggregate household income in Guilford in 2022: $179,663,087
Median family income in Guilford in 2022:
Guilford:
$125,481
State:
$93,029
Number of families with income < $10k:
Guilford:
1.1% (14)
Pennsylvania:
3.1% (101,868)
Number of families with income $20k - 30k:
Guilford:
4.4% (57)
State:
4.8% (156,521)
Number of families with income $30k - 40k:
Guilford:
1.2% (16)
State:
5.8% (191,305)
Number of families with income $40k - 50k:
Guilford:
6.0% (78)
Pennsylvania:
6.4% (211,380)
Number of families with income $50k - 60k:
Guilford:
2.3% (30)
State:
6.4% (209,910)
Number of families with income $60k - 75k:
Guilford:
2.5% (33)
State:
9.7% (318,991)
Number of families with income $75k - 100k:
Guilford:
16.1% (209)
State:
14.0% (461,021)
Number of families with income $100k - 125k:
Guilford:
16.3% (211)
State:
12.2% (400,961)
Number of families with income $125k - 150k:
Guilford:
25.9% (336)
State:
8.8% (288,471)
Number of families with income $150k - 200k:
Guilford:
12.1% (157)
State:
11.2% (367,642)
Number of families with income > $200k:
Guilford:
12.0% (156)
State:
14.3% (470,863)
Median non-family income in Guilford in 2022:
Guilford:
$56,801
State:
$42,203
Change in median non-family income between 2000 and 2022:
Guilford, Pennsylvania:
+73.9%
State:
+90.1%
Median per capita income in Guilford in 2022:
Guilford:
$46,267
State:
$41,489
Change in median per capita income between 2000 and 2022:
Guilford, Pennsylvania:
+61.1%
Pennsylvania:
+98.7%
Income statistics for White residents
Median household income in Guilford, PA in 2022:
Guilford:
$121,992
Pennsylvania:
$76,765
Change in median household income between 2000 and 2022:
Guilford, Pennsylvania:
+101.7%
State:
+84.3%
Number of households with income < $10k:
Guilford:
1.2% (16)
State:
4.3% (179,792)
Number of households with income $10k - 20k:
Guilford:
0.0% (0)
State:
6.5% (268,738)
Number of households with income $20k - 30k:
Guilford:
4.9% (64)
Pennsylvania:
7.0% (288,138)
Number of households with income $30k - 40k:
Guilford:
4.0% (52)
Pennsylvania:
7.2% (300,208)
Number of households with income $40k - 50k:
Guilford:
5.0% (65)
State:
7.2% (298,756)
Number of households with income $50k - 60k:
Guilford:
5.6% (73)
State:
6.8% (283,251)
Number of households with income $60k - 75k:
Guilford:
3.7% (48)
State:
9.9% (408,159)
Number of households with income $75k - 100k:
Guilford:
16.9% (220)
State:
13.2% (547,809)
Number of households with income $100k - 125k:
Guilford:
14.5% (188)
State:
10.5% (436,652)
Number of households with income $125k - 150k:
Guilford:
26.8% (349)
State:
7.3% (304,132)
Number of households with income $150k - 200k:
Guilford:
7.7% (100)
State:
9.0% (374,658)
Number of households with income > $200k:
Guilford:
9.6% (125)
Pennsylvania:
10.9% (452,618)
Aggregate household income in Guilford in 2022: $153,939,619
Median family income in Guilford in 2022:
Guilford:
$124,887
State:
$99,396
Number of families with income < $10k:
Guilford:
1.1% (12)
State:
2.2% (56,136)
Number of families with income $20k - 30k:
Guilford:
4.3% (49)
Pennsylvania:
3.9% (100,065)
Number of families with income $30k - 40k:
Guilford:
1.5% (17)
State:
5.2% (134,367)
Number of families with income $40k - 50k:
Guilford:
6.2% (70)
Pennsylvania:
6.0% (154,327)
Number of families with income $50k - 60k:
Guilford:
2.9% (33)
Pennsylvania:
6.1% (157,983)
Number of families with income $60k - 75k:
Guilford:
1.6% (18)
Pennsylvania:
9.6% (249,292)
Number of families with income $75k - 100k:
Guilford:
18.5% (211)
Pennsylvania:
14.7% (379,316)
Number of families with income $100k - 125k:
Guilford:
17.3% (197)
State:
12.9% (333,626)
Number of families with income $125k - 150k:
Guilford:
29.5% (335)
State:
9.4% (243,915)
Number of families with income $150k - 200k:
Guilford:
6.9% (79)
State:
12.2% (314,926)
Number of families with income > $200k:
Guilford:
10.3% (117)
State:
15.1% (390,885)
Median non-family income in Guilford in 2022:
Guilford:
$56,730
Pennsylvania:
$44,251
Change in median non-family income between 2000 and 2022:
Guilford, Pennsylvania:
+95.8%
Pennsylvania:
+94.2%
Median per capita income in Guilford in 2022:
Guilford:
$48,450
Pennsylvania:
$45,306
Change in median per capita income between 2000 and 2022:
Guilford, Pennsylvania:
+70.2%
State:
+105.4%
Income statistics for Asian residents
Number of households with income < $10k:
Guilford:
0.0% (0)
State:
5.8% (9,650)
Number of households with income $10k - 20k:
Guilford:
0.0% (0)
State:
4.3% (7,158)
Number of households with income $20k - 30k:
Guilford:
0.0% (0)
State:
5.7% (9,531)
Number of households with income $30k - 40k:
Guilford:
0.0% (0)
Pennsylvania:
5.7% (9,580)
Number of households with income $40k - 50k:
Guilford:
0.0% (0)
Pennsylvania:
5.4% (9,050)
Number of households with income $50k - 60k:
Guilford:
0.0% (0)
State:
6.1% (10,189)
Number of households with income $60k - 75k:
Guilford:
0.0% (0)
State:
7.8% (13,008)
Number of households with income $75k - 100k:
Guilford:
0.0% (0)
Pennsylvania:
10.1% (16,923)
Number of households with income $100k - 125k:
Guilford:
0.0% (0)
State:
8.8% (14,765)
Number of households with income $125k - 150k:
Guilford:
0.0% (0)
Pennsylvania:
7.5% (12,634)
Number of households with income $150k - 200k:
Guilford:
100.0% (82)
Pennsylvania:
10.0% (16,823)
Number of households with income > $200k:
Guilford:
0.0% (0)
Pennsylvania:
22.9% (38,426)
Aggregate household income in Guilford in 2022: $8,039,824
Median per capita income in Guilford in 2022:
Guilford:
$9,743
Pennsylvania:
$48,341
Change in median per capita income between 2000 and 2022:: -69.9%
Guilford, Pennsylvania:
-69.9%
State:
+140.6%
Income statistics for Hispanic or Latino residents
Number of households with income < $10k:
Guilford:
0.0% (0)
State:
8.7% (29,517)
Number of households with income $10k - 20k:
Guilford:
0.0% (0)
Pennsylvania:
10.0% (33,785)
Number of households with income $20k - 30k:
Guilford:
0.0% (0)
State:
9.9% (33,399)
Number of households with income $30k - 40k:
Guilford:
0.0% (0)
State:
8.8% (29,878)
Number of households with income $40k - 50k:
Guilford:
0.0% (0)
Pennsylvania:
8.5% (28,549)
Number of households with income $50k - 60k:
Guilford:
0.0% (0)
State:
7.6% (25,792)
Number of households with income $60k - 75k:
Guilford:
0.0% (0)
Pennsylvania:
10.6% (35,808)
Number of households with income $75k - 100k:
Guilford:
68.4% (52)
State:
11.9% (40,287)
Number of households with income $100k - 125k:
Guilford:
0.0% (0)
State:
8.0% (27,028)
Number of households with income $125k - 150k:
Guilford:
0.0% (0)
State:
5.2% (17,622)
Number of households with income $150k - 200k:
Guilford:
0.0% (0)
State:
5.2% (17,563)
Number of households with income > $200k:
Guilford:
31.6% (24)
Pennsylvania:
5.5% (18,469)
Aggregate household income in Guilford in 2022: $13,306,769
Median per capita income in Guilford in 2022:
Guilford:
$37,531
State:
$23,829
Income statistics for other residents
Number of households with income < $10k:
Guilford:
0.0% (0)
State:
9.2% (14,206)
Number of households with income $10k - 20k:
Guilford:
0.0% (0)
Pennsylvania:
11.0% (17,038)
Number of households with income $20k - 30k:
Guilford:
0.0% (0)
State:
11.0% (17,000)
Number of households with income $30k - 40k:
Guilford:
0.0% (0)
Pennsylvania:
11.0% (17,022)
Number of households with income $40k - 50k:
Guilford:
0.0% (0)
Pennsylvania:
7.7% (11,829)
Number of households with income $50k - 60k:
Guilford:
0.0% (0)
Pennsylvania:
8.0% (12,320)
Number of households with income $60k - 75k:
Guilford:
0.0% (0)
State:
8.8% (13,590)
Number of households with income $75k - 100k:
Guilford:
0.0% (0)
State:
10.5% (16,166)
Number of households with income $100k - 125k:
Guilford:
0.0% (0)
Pennsylvania:
8.0% (12,371)
Number of households with income $125k - 150k:
Guilford:
0.0% (0)
State:
4.0% (6,190)
Number of households with income $150k - 200k:
Guilford:
0.0% (0)
State:
5.1% (7,862)
Number of households with income > $200k:
Guilford:
100.0% (36)
Pennsylvania:
5.6% (8,691)
Median per capita income in Guilford in 2022:
Guilford:
$26,739
State:
$24,779
Discuss Guilford, Pennsylvania (PA) on our hugely popular Pennsylvania forum.