The median household income in Harrisburg, IL in 2022 was $38,080, which was 101.4% less than the median annual income of $76,708 across the entire state of Illinois. Compared to the median income of $26,507 in 2000 this represents an increase of 30.4%. The per capita income in 2022 was $26,247, which means an increase of 42.8% compared to 2000 when it was $15,005.
Whole page based on the data from 2000 / 2022 when the population of Harrisburg, Illinois was 9,860 / 8,265
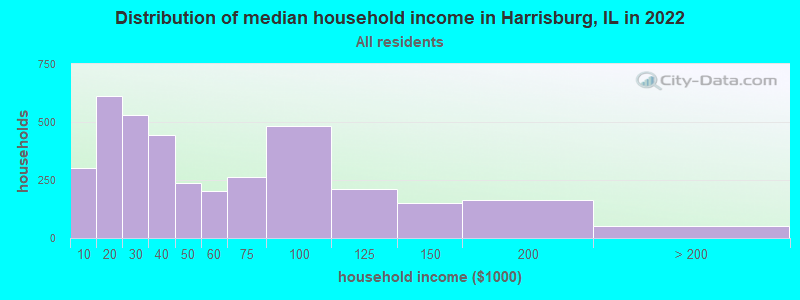
Income statistics for all residents
Median household income in Harrisburg, IL in 2022:
Harrisburg:
$38,081
State:
$76,708
Change in median household income between 2000 and 2022:
Harrisburg, Illinois:
+43.7%
State:
+64.6%
Number of households with income < $10k:
Harrisburg:
8.3% (302)
Illinois:
5.9% (296,090)
Number of households with income $10k - 20k:
Harrisburg:
16.8% (613)
Illinois:
6.6% (333,259)
Number of households with income $20k - 30k:
Harrisburg:
14.5% (529)
State:
6.8% (342,921)
Number of households with income $30k - 40k:
Harrisburg:
12.1% (442)
Illinois:
7.0% (355,254)
Number of households with income $40k - 50k:
Harrisburg:
6.5% (237)
State:
6.7% (340,678)
Number of households with income $50k - 60k:
Harrisburg:
5.6% (203)
Illinois:
6.7% (339,405)
Number of households with income $60k - 75k:
Harrisburg:
7.1% (261)
Illinois:
9.2% (465,709)
Number of households with income $75k - 100k:
Harrisburg:
13.3% (484)
State:
12.9% (651,353)
Number of households with income $100k - 125k:
Harrisburg:
5.8% (213)
State:
10.3% (522,359)
Number of households with income $125k - 150k:
Harrisburg:
4.1% (151)
State:
7.3% (367,136)
Number of households with income $150k - 200k:
Harrisburg:
4.5% (165)
Illinois:
9.0% (455,249)
Number of households with income > $200k:
Harrisburg:
1.4% (51)
Illinois:
11.6% (586,947)
Aggregate household income in Harrisburg in 2022: $208,414,300
Median family income in Harrisburg in 2022:
Harrisburg:
$58,864
State:
$96,948
Number of families with income < $10k:
Harrisburg:
7.7% (158)
State:
3.4% (105,875)
Number of families with income $10k - 20k:
Harrisburg:
10.2% (209)
Illinois:
3.3% (105,017)
Number of families with income $20k - 30k:
Harrisburg:
5.9% (121)
State:
4.7% (146,403)
Number of families with income $30k - 40k:
Harrisburg:
10.8% (223)
Illinois:
5.3% (167,069)
Number of families with income $40k - 50k:
Harrisburg:
10.2% (209)
Illinois:
5.8% (181,164)
Number of families with income $50k - 60k:
Harrisburg:
4.9% (100)
State:
6.1% (191,561)
Number of families with income $60k - 75k:
Harrisburg:
11.3% (232)
State:
9.0% (282,985)
Number of families with income $75k - 100k:
Harrisburg:
13.7% (281)
State:
13.8% (432,725)
Number of families with income $100k - 125k:
Harrisburg:
9.1% (187)
State:
11.9% (373,296)
Number of families with income $125k - 150k:
Harrisburg:
6.8% (139)
State:
8.9% (279,791)
Number of families with income $150k - 200k:
Harrisburg:
7.5% (153)
State:
11.9% (372,004)
Number of families with income > $200k:
Harrisburg:
2.1% (44)
State:
15.9% (500,033)
Median non-family income in Harrisburg in 2022:
Harrisburg:
$25,577
State:
$46,533
Change in median non-family income between 2000 and 2022:
Harrisburg, Illinois:
+66.1%
State:
+64.0%
Median per capita income in Harrisburg in 2022:
Harrisburg:
$26,247
State:
$43,317
Change in median per capita income between 2000 and 2022:
Harrisburg, Illinois:
+74.9%
State:
+87.5%
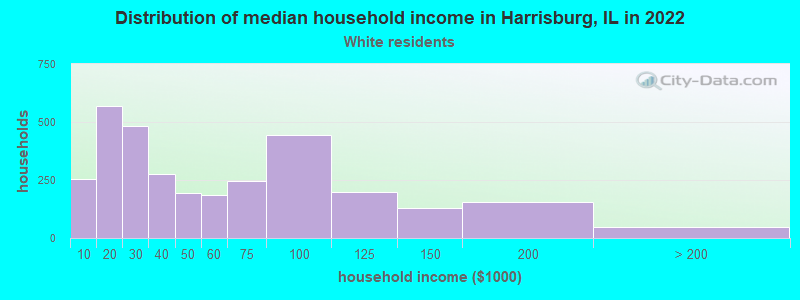
Income statistics for White residents
Median household income in Harrisburg, IL in 2022:
Harrisburg:
$39,415
State:
$83,346
Change in median household income between 2000 and 2022:
Harrisburg, Illinois:
+47.8%
State:
+67.5%
Number of households with income < $10k:
Harrisburg:
8.0% (255)
State:
4.5% (149,895)
Number of households with income $10k - 20k:
Harrisburg:
17.8% (568)
State:
5.5% (184,529)
Number of households with income $20k - 30k:
Harrisburg:
15.2% (484)
State:
6.1% (205,767)
Number of households with income $30k - 40k:
Harrisburg:
8.6% (275)
State:
6.7% (225,572)
Number of households with income $40k - 50k:
Harrisburg:
6.1% (193)
Illinois:
6.5% (216,965)
Number of households with income $50k - 60k:
Harrisburg:
5.8% (184)
State:
6.6% (222,841)
Number of households with income $60k - 75k:
Harrisburg:
7.7% (244)
State:
9.3% (312,758)
Number of households with income $75k - 100k:
Harrisburg:
14.0% (446)
State:
12.9% (433,180)
Number of households with income $100k - 125k:
Harrisburg:
6.2% (197)
State:
10.7% (360,753)
Number of households with income $125k - 150k:
Harrisburg:
4.1% (131)
Illinois:
7.9% (266,532)
Number of households with income $150k - 200k:
Harrisburg:
4.9% (157)
State:
10.0% (337,357)
Number of households with income > $200k:
Harrisburg:
1.5% (49)
State:
13.3% (446,069)
Aggregate household income in Harrisburg in 2022: $188,044,192
Median family income in Harrisburg in 2022:
Harrisburg:
$67,503
State:
$107,938
Number of families with income < $10k:
Harrisburg:
8.8% (152)
State:
2.2% (45,983)
Number of families with income $10k - 20k:
Harrisburg:
11.3% (195)
Illinois:
2.5% (50,574)
Number of families with income $20k - 30k:
Harrisburg:
6.4% (111)
State:
3.5% (70,927)
Number of families with income $30k - 40k:
Harrisburg:
4.5% (77)
State:
4.4% (90,563)
Number of families with income $40k - 50k:
Harrisburg:
9.2% (159)
State:
5.0% (102,597)
Number of families with income $50k - 60k:
Harrisburg:
5.0% (86)
State:
5.8% (119,129)
Number of families with income $60k - 75k:
Harrisburg:
12.2% (210)
Illinois:
8.8% (179,665)
Number of families with income $75k - 100k:
Harrisburg:
14.6% (252)
Illinois:
13.5% (276,887)
Number of families with income $100k - 125k:
Harrisburg:
10.0% (173)
State:
12.5% (256,099)
Number of families with income $125k - 150k:
Harrisburg:
6.9% (119)
Illinois:
9.8% (199,855)
Number of families with income $150k - 200k:
Harrisburg:
8.5% (146)
Illinois:
13.4% (274,569)
Number of families with income > $200k:
Harrisburg:
2.4% (42)
State:
18.6% (381,354)
Median non-family income in Harrisburg in 2022:
Harrisburg:
$26,327
Illinois:
$50,934
Change in median non-family income between 2000 and 2022:
Harrisburg, Illinois:
+71.4%
Illinois:
+70.7%
Median per capita income in Harrisburg in 2022:
Harrisburg:
$27,932
State:
$50,738
Change in median per capita income between 2000 and 2022:
Harrisburg, Illinois:
+78.7%
State:
+95.5%
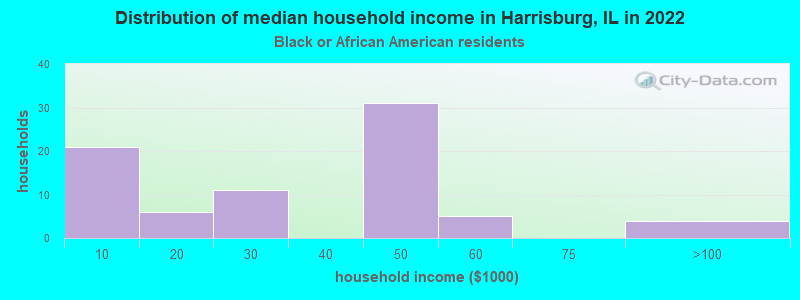
Income statistics for Black or African American residents
Number of households with income < $10k:
Harrisburg:
26.9% (21)
State:
13.3% (92,224)
Number of households with income $10k - 20k:
Harrisburg:
7.7% (6)
Illinois:
13.5% (93,732)
Number of households with income $20k - 30k:
Harrisburg:
14.1% (11)
Illinois:
9.9% (68,453)
Number of households with income $30k - 40k:
Harrisburg:
0.0% (0)
State:
8.5% (59,072)
Number of households with income $40k - 50k:
Harrisburg:
39.7% (31)
State:
7.9% (55,033)
Number of households with income $50k - 60k:
Harrisburg:
6.4% (5)
State:
7.2% (49,556)
Number of households with income $60k - 75k:
Harrisburg:
0.0% (0)
Illinois:
7.8% (53,726)
Number of households with income $75k - 100k:
Harrisburg:
5.1% (4)
State:
11.6% (80,439)
Number of households with income $100k - 125k:
Harrisburg:
0.0% (0)
Illinois:
7.5% (52,244)
Number of households with income $125k - 150k:
Harrisburg:
0.0% (0)
State:
3.9% (27,058)
Number of households with income $150k - 200k:
Harrisburg:
0.0% (0)
State:
4.6% (32,057)
Number of households with income > $200k:
Harrisburg:
0.0% (0)
State:
4.1% (28,731)
Aggregate household income in Harrisburg in 2022: $1,911,805
Median family income in Harrisburg in 2022:
Harrisburg:
$42,119
State:
$60,661
Number of families with income $40k - 50k:
Harrisburg:
78.4% (33)
State:
8.5% (31,429)
Number of families with income $50k - 60k:
Harrisburg:
11.1% (5)
Illinois:
7.1% (26,341)
Number of families with income $75k - 100k:
Harrisburg:
10.5% (4)
State:
14.0% (51,750)
Median per capita income in Harrisburg in 2022:
Harrisburg:
$13,385
State:
$28,045
Change in median per capita income between 2000 and 2022:
Harrisburg, Illinois:
+75.3%
State:
+90.2%
Income statistics for Asian residents
Aggregate household income in Harrisburg in 2022: $2,094,569
Median per capita income in Harrisburg in 2022:
Harrisburg:
$8,460
Illinois:
$52,977
Change in median per capita income between 2000 and 2022:: -78.8%
Harrisburg, Illinois:
-78.8%
Illinois:
+119.5%
Income statistics for Hispanic or Latino residents
Number of households with income < $10k:
Harrisburg:
0.0% (0)
Illinois:
4.9% (33,145)
Number of households with income $10k - 20k:
Harrisburg:
0.0% (0)
State:
5.4% (36,345)
Number of households with income $20k - 30k:
Harrisburg:
0.0% (0)
Illinois:
7.5% (50,677)
Number of households with income $30k - 40k:
Harrisburg:
100.0% (20)
State:
7.7% (52,008)
Number of households with income $40k - 50k:
Harrisburg:
0.0% (0)
State:
8.1% (54,702)
Number of households with income $50k - 60k:
Harrisburg:
0.0% (0)
State:
7.5% (51,062)
Number of households with income $60k - 75k:
Harrisburg:
0.0% (0)
State:
11.3% (76,576)
Number of households with income $75k - 100k:
Harrisburg:
0.0% (0)
Illinois:
15.5% (105,152)
Number of households with income $100k - 125k:
Harrisburg:
0.0% (0)
Illinois:
11.5% (77,760)
Number of households with income $125k - 150k:
Harrisburg:
0.0% (0)
State:
7.3% (49,310)
Number of households with income $150k - 200k:
Harrisburg:
0.0% (0)
State:
7.6% (51,233)
Number of households with income > $200k:
Harrisburg:
0.0% (0)
State:
5.9% (40,028)
Aggregate household income in Harrisburg in 2022: $1,232,836
Median per capita income in Harrisburg in 2022:
Harrisburg:
$20,210
Illinois:
$26,551
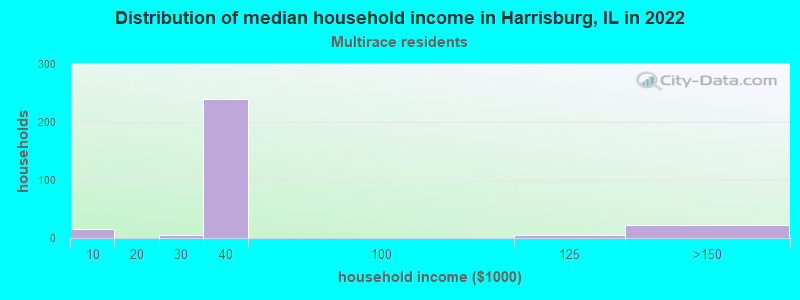
Income statistics for Multirace residents
Median household income in Harrisburg, IL in 2022:
Harrisburg:
$37,095
State:
$71,185
Change in median household income between 2000 and 2022:
Harrisburg, Illinois:
+9.9%
State:
+81.4%
Number of households with income < $10k:
Harrisburg:
5.2% (15)
State:
5.3% (21,595)
Number of households with income $10k - 20k:
Harrisburg:
0.0% (0)
Illinois:
6.5% (26,720)
Number of households with income $20k - 30k:
Harrisburg:
1.7% (5)
Illinois:
8.0% (32,573)
Number of households with income $30k - 40k:
Harrisburg:
83.6% (239)
State:
8.4% (34,383)
Number of households with income $40k - 50k:
Harrisburg:
0.0% (0)
State:
7.4% (30,234)
Number of households with income $50k - 60k:
Harrisburg:
0.0% (0)
State:
6.9% (28,432)
Number of households with income $60k - 75k:
Harrisburg:
0.0% (0)
State:
10.2% (41,780)
Number of households with income $75k - 100k:
Harrisburg:
0.0% (0)
Illinois:
13.0% (53,426)
Number of households with income $100k - 125k:
Harrisburg:
1.7% (5)
Illinois:
10.5% (43,126)
Number of households with income $125k - 150k:
Harrisburg:
7.7% (22)
State:
7.6% (31,153)
Number of households with income $150k - 200k:
Harrisburg:
0.0% (0)
Illinois:
7.6% (30,946)
Number of households with income > $200k:
Harrisburg:
0.0% (0)
State:
8.6% (35,208)
Aggregate household income in Harrisburg in 2022: $12,757,896
Median family income in Harrisburg in 2022:
Harrisburg:
$38,057
Illinois:
$84,400
Number of families with income $30k - 40k:
Harrisburg:
89.3% (231)
State:
7.5% (20,780)
Number of families with income $100k - 125k:
Harrisburg:
2.0% (5)
Illinois:
12.2% (33,852)
Number of families with income $125k - 150k:
Harrisburg:
8.7% (22)
Illinois:
9.0% (25,085)
Median per capita income in Harrisburg in 2022:
Harrisburg:
$18,727
Illinois:
$29,285
Discuss Harrisburg, Illinois (IL) on our hugely popular Illinois forum.