Harrold-Oklaunion, Texas (TX) income map, earnings map, and wages data
The median household income in Harrold-Oklaunion, TX in 2022 was $62,751, which was 15.2% less than the median annual income of $72,284 across the entire state of Texas. Compared to the median income of $34,038 in 2000 this represents an increase of 45.8%. The per capita income in 2022 was $38,947, which means an increase of 48.5% compared to 2000 when it was $20,054.
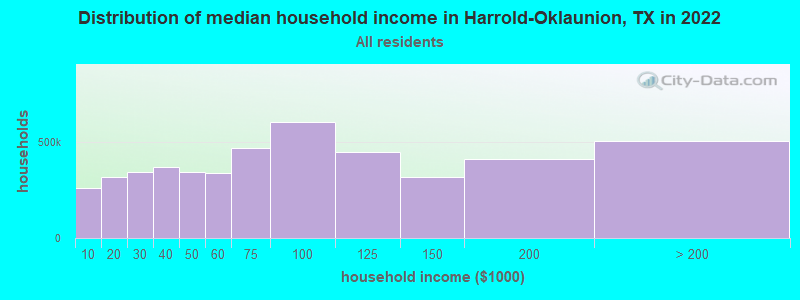
Income statistics for all residents
Median household income in Harrold-Oklaunion, TX in 2022:| Harrold-Oklaunion: | $62,752 |
| State: | $72,284 |
Change in median household income between 2000 and 2022:| Harrold-Oklaunion, Texas: | +84.4% |
| State: | +81.0% |
Number of households with income < $10k:| Harrold-Oklaunion: | 5.5% (260,303) |
| State: | 5.5% (611,011) |
Number of households with income $10k - 20k:| Harrold-Oklaunion: | 6.7% (316,764) |
| State: | 6.7% (743,157) |
Number of households with income $20k - 30k:| Harrold-Oklaunion: | 7.2% (342,444) |
| State: | 7.2% (803,381) |
Number of households with income $30k - 40k:| Harrold-Oklaunion: | 7.8% (369,128) |
| State: | 7.8% (866,080) |
Number of households with income $40k - 50k:| Harrold-Oklaunion: | 7.3% (345,428) |
| State: | 7.3% (810,440) |
Number of households with income $50k - 60k:| Harrold-Oklaunion: | 7.2% (340,840) |
| State: | 7.2% (799,783) |
Number of households with income $60k - 75k:| Harrold-Oklaunion: | 9.9% (466,838) |
| Texas: | 9.9% (1,095,384) |
Number of households with income $75k - 100k:| Harrold-Oklaunion: | 12.8% (604,948) |
| State: | 12.8% (1,419,057) |
Number of households with income $100k - 125k:| Harrold-Oklaunion: | 9.5% (449,615) |
| State: | 9.5% (1,054,577) |
Number of households with income $125k - 150k:| Harrold-Oklaunion: | 6.7% (316,222) |
| State: | 6.7% (741,518) |
Number of households with income $150k - 200k:| Harrold-Oklaunion: | 8.7% (409,923) |
| State: | 8.7% (961,776) |
Number of households with income > $200k:| Harrold-Oklaunion: | 10.7% (503,384) |
| State: | 10.7% (1,181,544) |
Aggregate household income in Harrold-Oklaunion in 2022: $2,907,840,505
Median family income in Harrold-Oklaunion in 2022:| Harrold-Oklaunion: | $66,900 |
| Texas: | $86,267 |
Median non-family income in Harrold-Oklaunion in 2022:| Harrold-Oklaunion: | $35,875 |
| Texas: | $45,999 |
Change in median non-family income between 2000 and 2022:| Harrold-Oklaunion, Texas: | +85.2% |
| State: | +79.5% |
Median per capita income in Harrold-Oklaunion in 2022:| Harrold-Oklaunion: | $38,947 |
| State: | $38,123 |
Change in median per capita income between 2000 and 2022:| Harrold-Oklaunion, Texas: | +94.2% |
| State: | +94.3% |
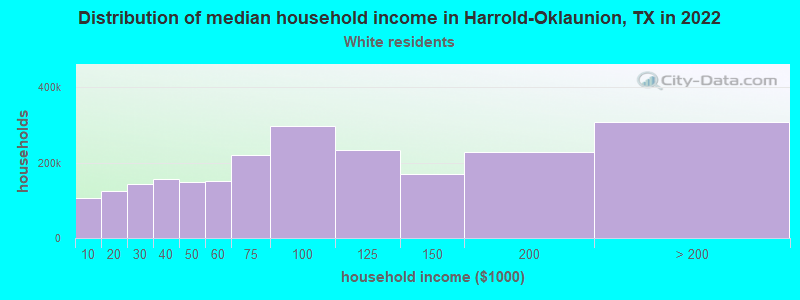
Income statistics for White residents
Median household income in Harrold-Oklaunion, TX in 2022:| Harrold-Oklaunion: | $63,890 |
| State: | $82,032 |
Change in median household income between 2000 and 2022:| Harrold-Oklaunion, Texas: | +90.4% |
| State: | +91.0% |
Number of households with income < $10k:| Harrold-Oklaunion: | 4.7% (106,622) |
| State: | 4.7% (273,716) |
Number of households with income $10k - 20k:| Harrold-Oklaunion: | 5.5% (125,934) |
| State: | 5.5% (322,702) |
Number of households with income $20k - 30k:| Harrold-Oklaunion: | 6.2% (142,108) |
| Texas: | 6.2% (363,947) |
Number of households with income $30k - 40k:| Harrold-Oklaunion: | 6.8% (155,768) |
| State: | 6.8% (399,275) |
Number of households with income $40k - 50k:| Harrold-Oklaunion: | 6.5% (149,528) |
| Texas: | 6.5% (383,417) |
Number of households with income $50k - 60k:| Harrold-Oklaunion: | 6.6% (151,495) |
| State: | 6.6% (388,535) |
Number of households with income $60k - 75k:| Harrold-Oklaunion: | 9.6% (220,515) |
| State: | 9.7% (566,295) |
Number of households with income $75k - 100k:| Harrold-Oklaunion: | 13.0% (296,336) |
| Texas: | 13.0% (760,276) |
Number of households with income $100k - 125k:| Harrold-Oklaunion: | 10.2% (232,931) |
| State: | 10.2% (597,596) |
Number of households with income $125k - 150k:| Harrold-Oklaunion: | 7.4% (170,220) |
| State: | 7.4% (436,830) |
Number of households with income $150k - 200k:| Harrold-Oklaunion: | 9.9% (227,024) |
| State: | 9.9% (583,067) |
Number of households with income > $200k:| Harrold-Oklaunion: | 13.5% (307,822) |
| Texas: | 13.5% (792,647) |
Aggregate household income in Harrold-Oklaunion in 2022: $1,367,275,964
Median family income in Harrold-Oklaunion in 2022:| Harrold-Oklaunion: | $69,430 |
| State: | $101,788 |
Number of families with income < $10k:| Harrold-Oklaunion: | 3.1% (4) |
| State: | 2.8% (108,142) |
Number of families with income $10k - 20k:| Harrold-Oklaunion: | 4.4% (5) |
| State: | 2.9% (113,421) |
Number of families with income $20k - 30k:| Harrold-Oklaunion: | 13.4% (17) |
| State: | 4.1% (157,688) |
Number of families with income $30k - 40k:| Harrold-Oklaunion: | 7.1% (9) |
| State: | 5.2% (198,847) |
Number of families with income $40k - 50k:| Harrold-Oklaunion: | 9.9% (12) |
| State: | 5.6% (216,490) |
Number of families with income $50k - 60k:| Harrold-Oklaunion: | 4.3% (5) |
| State: | 5.7% (220,689) |
Number of families with income $60k - 75k:| Harrold-Oklaunion: | 13.1% (16) |
| State: | 9.0% (346,106) |
Number of families with income $75k - 100k:| Harrold-Oklaunion: | 12.4% (15) |
| State: | 13.7% (527,363) |
Number of families with income $150k - 200k:| Harrold-Oklaunion: | 32.2% (40) |
| State: | 12.5% (480,185) |
Median non-family income in Harrold-Oklaunion in 2022:| Harrold-Oklaunion: | $36,005 |
| State: | $50,587 |
Change in median non-family income between 2000 and 2022:| Harrold-Oklaunion, Texas: | +85.8% |
| State: | +87.7% |
Median per capita income in Harrold-Oklaunion in 2022:| Harrold-Oklaunion: | $36,206 |
| State: | $47,740 |
Change in median per capita income between 2000 and 2022:| Harrold-Oklaunion, Texas: | +112.1% |
| Texas: | +114.3% |
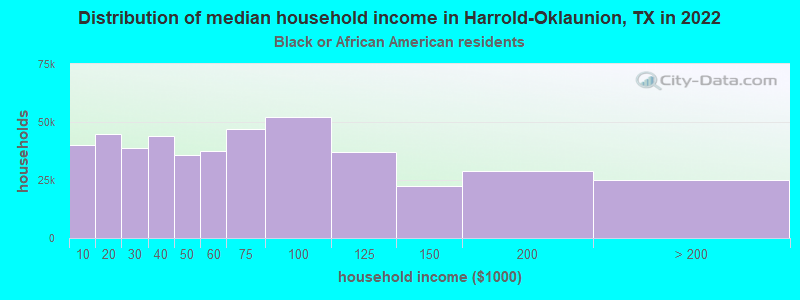
Income statistics for Black or African American residents
Median household income in Harrold-Oklaunion, TX in 2022:| Harrold-Oklaunion: | $40,039 |
| State: | $55,759 |
Change in median household income between 2000 and 2022:| Harrold-Oklaunion, Texas: | +113.5% |
| Texas: | +90.3% |
Number of households with income < $10k:| Harrold-Oklaunion: | 8.9% (40,282) |
| State: | 8.9% (126,378) |
Number of households with income $10k - 20k:| Harrold-Oklaunion: | 9.9% (45,035) |
| State: | 9.9% (140,369) |
Number of households with income $20k - 30k:| Harrold-Oklaunion: | 8.5% (38,745) |
| Texas: | 8.5% (120,639) |
Number of households with income $30k - 40k:| Harrold-Oklaunion: | 9.7% (43,806) |
| State: | 9.7% (137,517) |
Number of households with income $40k - 50k:| Harrold-Oklaunion: | 7.9% (35,987) |
| State: | 8.0% (112,973) |
Number of households with income $50k - 60k:| Harrold-Oklaunion: | 8.2% (37,290) |
| Texas: | 8.3% (117,156) |
Number of households with income $60k - 75k:| Harrold-Oklaunion: | 10.4% (47,073) |
| State: | 10.4% (147,462) |
Number of households with income $75k - 100k:| Harrold-Oklaunion: | 11.5% (51,976) |
| State: | 11.5% (162,718) |
Number of households with income $100k - 125k:| Harrold-Oklaunion: | 8.1% (36,903) |
| Texas: | 8.2% (115,829) |
Number of households with income $125k - 150k:| Harrold-Oklaunion: | 4.9% (22,363) |
| Texas: | 4.9% (69,556) |
Number of households with income $150k - 200k:| Harrold-Oklaunion: | 6.4% (28,964) |
| State: | 6.4% (90,701) |
Number of households with income > $200k:| Harrold-Oklaunion: | 5.5% (24,883) |
| Texas: | 5.5% (77,988) |
Aggregate household income in Harrold-Oklaunion in 2022: $962,877
Median family income in Harrold-Oklaunion in 2022:| Harrold-Oklaunion: | $41,962 |
| State: | $69,134 |
Median per capita income in Harrold-Oklaunion in 2022:| Harrold-Oklaunion: | $21,193 |
| State: | $30,490 |
Change in median per capita income between 2000 and 2022:| Harrold-Oklaunion, Texas: | +116.3% |
| State: | +113.9% |
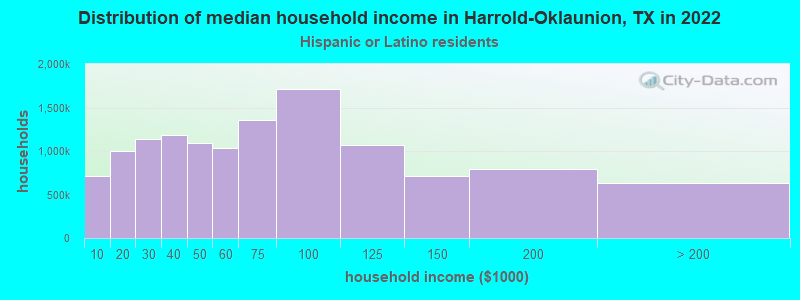
Income statistics for Hispanic or Latino residents
Median household income in Harrold-Oklaunion, TX in 2022:| Harrold-Oklaunion: | $425,795 |
| State: | $60,504 |
Change in median household income between 2000 and 2022:| Harrold-Oklaunion, Texas: | +112.9% |
| State: | +102.5% |
Number of households with income < $10k:| Harrold-Oklaunion: | 5.8% (717,006) |
| Texas: | 5.8% (213,953) |
Number of households with income $10k - 20k:| Harrold-Oklaunion: | 8.0% (997,186) |
| State: | 8.0% (297,456) |
Number of households with income $20k - 30k:| Harrold-Oklaunion: | 9.2% (1,139,352) |
| Texas: | 9.2% (340,166) |
Number of households with income $30k - 40k:| Harrold-Oklaunion: | 9.5% (1,187,890) |
| State: | 9.5% (354,336) |
Number of households with income $40k - 50k:| Harrold-Oklaunion: | 8.8% (1,095,547) |
| State: | 8.8% (327,013) |
Number of households with income $50k - 60k:| Harrold-Oklaunion: | 8.3% (1,033,984) |
| State: | 8.3% (308,818) |
Number of households with income $60k - 75k:| Harrold-Oklaunion: | 10.9% (1,357,578) |
| State: | 10.9% (405,109) |
Number of households with income $75k - 100k:| Harrold-Oklaunion: | 13.8% (1,715,338) |
| State: | 13.8% (511,639) |
Number of households with income $100k - 125k:| Harrold-Oklaunion: | 8.6% (1,072,004) |
| Texas: | 8.6% (319,728) |
Number of households with income $125k - 150k:| Harrold-Oklaunion: | 5.7% (707,836) |
| Texas: | 5.7% (210,932) |
Number of households with income $150k - 200k:| Harrold-Oklaunion: | 6.4% (790,521) |
| State: | 6.4% (236,055) |
Number of households with income > $200k:| Harrold-Oklaunion: | 5.1% (634,678) |
| State: | 5.1% (189,259) |
Aggregate household income in Harrold-Oklaunion in 2022: $163,150,942
Median family income in Harrold-Oklaunion in 2022:| Harrold-Oklaunion: | $438,624 |
| Texas: | $65,080 |
Number of families with income < $10k:| Harrold-Oklaunion: | 7.0% (8) |
| Texas: | 5.3% (147,493) |
Number of families with income $10k - 20k:| Harrold-Oklaunion: | 10.7% (13) |
| State: | 6.3% (174,531) |
Number of families with income $20k - 30k:| Harrold-Oklaunion: | 26.1% (31) |
| Texas: | 8.6% (238,528) |
Number of families with income $30k - 40k:| Harrold-Oklaunion: | 10.6% (13) |
| State: | 9.1% (251,999) |
Number of families with income $40k - 50k:| Harrold-Oklaunion: | 11.5% (14) |
| State: | 8.6% (240,188) |
Number of families with income $50k - 60k:| Harrold-Oklaunion: | 4.3% (5) |
| State: | 8.0% (223,566) |
Number of families with income $60k - 75k:| Harrold-Oklaunion: | 11.0% (13) |
| State: | 10.9% (302,688) |
Number of families with income $75k - 100k:| Harrold-Oklaunion: | 8.4% (10) |
| State: | 14.3% (398,554) |
Number of families with income $150k - 200k:| Harrold-Oklaunion: | 10.3% (12) |
| Texas: | 7.3% (202,259) |
Median per capita income in Harrold-Oklaunion in 2022:| Harrold-Oklaunion: | $175,087 |
| State: | $24,862 |
Change in median per capita income between 2000 and 2022:| Harrold-Oklaunion, Texas: | +128.5% |
| Texas: | +130.8% |
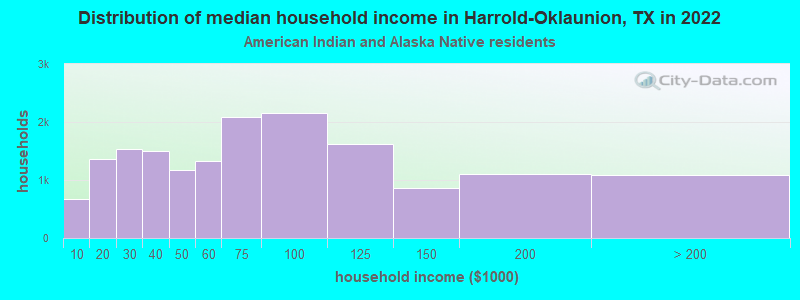
Income statistics for American Indian and Alaska Native residents
Median household income in Harrold-Oklaunion, TX in 2022:| Harrold-Oklaunion: | $26,637 |
| State: | $65,765 |
Change in median household income between 2000 and 2022:| Harrold-Oklaunion, Texas: | +93.7% |
| Texas: | +88.3% |
Number of households with income < $10k:| Harrold-Oklaunion: | 4.1% (670) |
| State: | 4.1% (3,398) |
Number of households with income $10k - 20k:| Harrold-Oklaunion: | 8.3% (1,370) |
| Texas: | 8.3% (6,949) |
Number of households with income $20k - 30k:| Harrold-Oklaunion: | 9.3% (1,527) |
| Texas: | 9.3% (7,742) |
Number of households with income $30k - 40k:| Harrold-Oklaunion: | 9.1% (1,502) |
| Texas: | 9.1% (7,627) |
Number of households with income $40k - 50k:| Harrold-Oklaunion: | 7.1% (1,169) |
| Texas: | 7.1% (5,922) |
Number of households with income $50k - 60k:| Harrold-Oklaunion: | 8.1% (1,334) |
| State: | 8.1% (6,761) |
Number of households with income $60k - 75k:| Harrold-Oklaunion: | 12.7% (2,087) |
| State: | 12.7% (10,588) |
Number of households with income $75k - 100k:| Harrold-Oklaunion: | 13.0% (2,150) |
| State: | 13.0% (10,903) |
Number of households with income $100k - 125k:| Harrold-Oklaunion: | 9.9% (1,628) |
| State: | 9.9% (8,256) |
Number of households with income $125k - 150k:| Harrold-Oklaunion: | 5.2% (858) |
| State: | 5.2% (4,355) |
Number of households with income $150k - 200k:| Harrold-Oklaunion: | 6.7% (1,108) |
| Texas: | 6.7% (5,623) |
Number of households with income > $200k:| Harrold-Oklaunion: | 6.6% (1,087) |
| State: | 6.6% (5,522) |
Aggregate household income in Harrold-Oklaunion in 2022: $52,005
Median family income in Harrold-Oklaunion in 2022:| Harrold-Oklaunion: | $26,220 |
| State: | $72,369 |
Median per capita income in Harrold-Oklaunion in 2022:| Harrold-Oklaunion: | $25,411 |
| State: | $28,166 |
Change in median per capita income between 2000 and 2022:| Harrold-Oklaunion, Texas: | +95.5% |
| Texas: | +77.2% |
Income statistics for other residents
Number of households with income < $10k:| Harrold-Oklaunion: | 5.8% (30) |
| State: | 5.9% (54,162) |
Number of households with income $10k - 20k:| Harrold-Oklaunion: | 7.0% (36) |
| State: | 6.8% (62,891) |
Number of households with income $20k - 30k:| Harrold-Oklaunion: | 10.5% (54) |
| State: | 10.6% (97,294) |
Number of households with income $30k - 40k:| Harrold-Oklaunion: | 10.9% (56) |
| Texas: | 10.8% (99,670) |
Number of households with income $40k - 50k:| Harrold-Oklaunion: | 9.3% (48) |
| State: | 9.3% (85,548) |
Number of households with income $50k - 60k:| Harrold-Oklaunion: | 8.9% (46) |
| State: | 9.0% (82,757) |
Number of households with income $60k - 75k:| Harrold-Oklaunion: | 10.9% (56) |
| State: | 10.9% (100,326) |
Number of households with income $75k - 100k:| Harrold-Oklaunion: | 14.0% (72) |
| Texas: | 14.0% (128,767) |
Number of households with income $100k - 125k:| Harrold-Oklaunion: | 8.2% (42) |
| State: | 8.2% (75,218) |
Number of households with income $125k - 150k:| Harrold-Oklaunion: | 4.9% (25) |
| State: | 4.8% (44,223) |
Number of households with income $150k - 200k:| Harrold-Oklaunion: | 5.6% (29) |
| State: | 5.6% (51,376) |
Number of households with income > $200k:| Harrold-Oklaunion: | 3.9% (20) |
| Texas: | 4.0% (36,393) |
Aggregate household income in Harrold-Oklaunion in 2022: $37,740,156
Median family income in Harrold-Oklaunion in 2022:| Harrold-Oklaunion: | $419,626 |
| Texas: | $60,064 |
Number of families with income > $200k:| Harrold-Oklaunion: | 100.0% (83) |
| State: | 4.5% (31,243) |
Median per capita income in Harrold-Oklaunion in 2022:| Harrold-Oklaunion: | $221,683 |
| State: | $23,899 |
Change in median per capita income between 2000 and 2022:| Harrold-Oklaunion, Texas: | +141.8% |
| State: | +135.2% |