Hartland, Connecticut (CT) income map, earnings map, and wages data
The median household income in Hartland, CT in 2022 was $109,437, which was 19.2% greater than the median annual income of $88,429 across the entire state of Connecticut. Compared to the median income of $64,674 in 2000 this represents an increase of 40.9%. The per capita income in 2022 was $48,426, which means an increase of 45.3% compared to 2000 when it was $26,473.
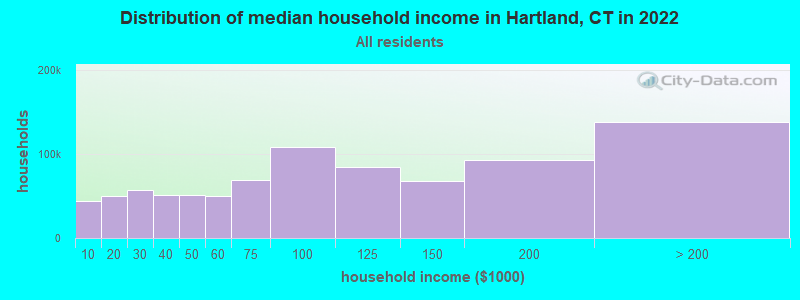
Income statistics for all residents
Median household income in Hartland, CT in 2022:| Hartland: | $109,437 |
| State: | $88,429 |
Change in median household income between 2000 and 2022:| Hartland, Connecticut: | +69.2% |
| Connecticut: | +64.0% |
Number of households with income < $10k:| Hartland: | 5.2% (44,576) |
| Connecticut: | 5.1% (72,746) |
Number of households with income $10k - 20k:| Hartland: | 5.8% (50,266) |
| State: | 5.7% (81,643) |
Number of households with income $20k - 30k:| Hartland: | 6.6% (56,896) |
| State: | 6.5% (92,844) |
Number of households with income $30k - 40k:| Hartland: | 5.9% (51,061) |
| State: | 5.9% (83,934) |
Number of households with income $40k - 50k:| Hartland: | 5.9% (50,733) |
| State: | 5.8% (83,025) |
Number of households with income $50k - 60k:| Hartland: | 5.8% (49,747) |
| State: | 5.7% (81,788) |
Number of households with income $60k - 75k:| Hartland: | 8.1% (69,702) |
| Connecticut: | 8.1% (115,651) |
Number of households with income $75k - 100k:| Hartland: | 12.6% (108,859) |
| State: | 12.6% (180,173) |
Number of households with income $100k - 125k:| Hartland: | 9.8% (84,746) |
| State: | 9.9% (141,231) |
Number of households with income $125k - 150k:| Hartland: | 7.8% (67,677) |
| State: | 7.9% (112,826) |
Number of households with income $150k - 200k:| Hartland: | 10.7% (92,577) |
| State: | 10.8% (154,641) |
Number of households with income > $200k:| Hartland: | 16.0% (138,305) |
| State: | 16.3% (233,133) |
Aggregate household income in Hartland in 2022: $2,278,192,868
Median family income in Hartland in 2022:| Hartland: | $118,168 |
| Connecticut: | $115,183 |
Median non-family income in Hartland in 2022:| Hartland: | $75,496 |
| Connecticut: | $50,964 |
Change in median non-family income between 2000 and 2022:| Hartland, Connecticut: | +71.5% |
| Connecticut: | +65.1% |
Median per capita income in Hartland in 2022:| Hartland: | $48,427 |
| Connecticut: | $51,581 |
Change in median per capita income between 2000 and 2022:| Hartland, Connecticut: | +82.9% |
| State: | +79.3% |
Income statistics for White residents
Median household income in Hartland, CT in 2022:| Hartland: | $109,762 |
| Connecticut: | $96,890 |
Change in median household income between 2000 and 2022:| Hartland, Connecticut: | +69.4% |
| State: | +68.5% |
Number of households with income < $10k:| Hartland: | 4.2% (24,007) |
| Connecticut: | 4.2% (42,265) |
Number of households with income $10k - 20k:| Hartland: | 4.9% (27,601) |
| State: | 4.8% (48,323) |
Number of households with income $20k - 30k:| Hartland: | 5.8% (32,825) |
| State: | 5.7% (57,716) |
Number of households with income $30k - 40k:| Hartland: | 5.4% (30,385) |
| Connecticut: | 5.3% (53,827) |
Number of households with income $40k - 50k:| Hartland: | 5.3% (30,259) |
| State: | 5.3% (53,301) |
Number of households with income $50k - 60k:| Hartland: | 5.6% (31,490) |
| State: | 5.5% (55,690) |
Number of households with income $60k - 75k:| Hartland: | 7.9% (45,001) |
| State: | 8.0% (80,329) |
Number of households with income $75k - 100k:| Hartland: | 12.7% (72,109) |
| Connecticut: | 12.7% (128,070) |
Number of households with income $100k - 125k:| Hartland: | 10.0% (56,622) |
| State: | 10.0% (101,210) |
Number of households with income $125k - 150k:| Hartland: | 8.0% (45,458) |
| Connecticut: | 8.0% (81,250) |
Number of households with income $150k - 200k:| Hartland: | 11.8% (66,842) |
| Connecticut: | 11.8% (119,527) |
Number of households with income > $200k:| Hartland: | 18.4% (104,638) |
| Connecticut: | 18.6% (187,875) |
Aggregate household income in Hartland in 2022: $1,721,153,228
Median family income in Hartland in 2022:| Hartland: | $121,110 |
| State: | $128,955 |
Number of families with income < $10k:| Hartland: | 1.7% (7) |
| Connecticut: | 1.9% (11,537) |
Number of families with income $10k - 20k:| Hartland: | 1.1% (4) |
| Connecticut: | 1.8% (11,289) |
Number of families with income $20k - 30k:| Hartland: | 2.5% (9) |
| State: | 3.0% (18,506) |
Number of families with income $30k - 40k:| Hartland: | 5.7% (22) |
| Connecticut: | 2.9% (18,160) |
Number of families with income $40k - 50k:| Hartland: | 5.3% (20) |
| State: | 3.9% (24,550) |
Number of families with income $50k - 60k:| Hartland: | 7.9% (30) |
| State: | 4.3% (26,723) |
Number of families with income $60k - 75k:| Hartland: | 15.4% (59) |
| State: | 7.1% (44,075) |
Number of families with income $75k - 100k:| Hartland: | 21.1% (80) |
| State: | 12.5% (77,679) |
Number of families with income $100k - 125k:| Hartland: | 14.7% (56) |
| Connecticut: | 11.1% (69,086) |
Number of families with income $125k - 150k:| Hartland: | 10.8% (41) |
| Connecticut: | 9.6% (59,616) |
Number of families with income $150k - 200k:| Hartland: | 8.0% (30) |
| State: | 15.7% (97,890) |
Number of families with income > $200k:| Hartland: | 5.9% (22) |
| State: | 26.3% (163,417) |
Median non-family income in Hartland in 2022:| Hartland: | $76,465 |
| Connecticut: | $54,067 |
Change in median non-family income between 2000 and 2022:| Hartland, Connecticut: | +73.7% |
| Connecticut: | +68.7% |
Median per capita income in Hartland in 2022:| Hartland: | $51,237 |
| State: | $59,916 |
Change in median per capita income between 2000 and 2022:| Hartland, Connecticut: | +92.1% |
| State: | +90.2% |
Income statistics for Black or African American residents
Median household income in Hartland, CT in 2022:| Hartland: | $245,125 |
| State: | $61,803 |
Change in median household income between 2000 and 2022:| Hartland, Connecticut: | +60.9% |
| State: | +76.1% |
Number of households with income < $10k:| Hartland: | 6.8% (41,200) |
| Connecticut: | 6.8% (9,494) |
Number of households with income $10k - 20k:| Hartland: | 7.9% (47,749) |
| State: | 7.9% (11,003) |
Number of households with income $20k - 30k:| Hartland: | 10.8% (65,290) |
| State: | 10.8% (15,045) |
Number of households with income $30k - 40k:| Hartland: | 8.2% (49,910) |
| Connecticut: | 8.2% (11,501) |
Number of households with income $40k - 50k:| Hartland: | 7.4% (45,201) |
| State: | 7.4% (10,416) |
Number of households with income $50k - 60k:| Hartland: | 7.5% (45,714) |
| State: | 7.5% (10,534) |
Number of households with income $60k - 75k:| Hartland: | 8.0% (48,795) |
| Connecticut: | 8.0% (11,244) |
Number of households with income $75k - 100k:| Hartland: | 9.6% (58,021) |
| State: | 9.6% (13,370) |
Number of households with income $100k - 125k:| Hartland: | 10.2% (61,814) |
| State: | 10.2% (14,244) |
Number of households with income $125k - 150k:| Hartland: | 8.0% (48,803) |
| State: | 8.0% (11,246) |
Number of households with income $150k - 200k:| Hartland: | 7.7% (46,551) |
| State: | 7.7% (10,727) |
Number of households with income > $200k:| Hartland: | 7.9% (48,109) |
| State: | 7.9% (11,086) |
Aggregate household income in Hartland in 2022: $1,536,565
Median family income in Hartland in 2022:| Hartland: | $338,491 |
| Connecticut: | $87,228 |
Number of families with income $150k - 200k:| Hartland: | 100.0% (16) |
| State: | 11.4% (9,497) |
Median per capita income in Hartland in 2022:| Hartland: | $164,086 |
| State: | $36,289 |
Change in median per capita income between 2000 and 2022:| Hartland, Connecticut: | +115.2% |
| State: | +117.5% |
Income statistics for Hispanic or Latino residents
Number of households with income < $10k:| Hartland: | 8.7% (70,807) |
| State: | 8.7% (18,584) |
Number of households with income $10k - 20k:| Hartland: | 9.1% (73,287) |
| Connecticut: | 9.1% (19,235) |
Number of households with income $20k - 30k:| Hartland: | 8.9% (72,350) |
| State: | 8.9% (18,989) |
Number of households with income $30k - 40k:| Hartland: | 7.5% (60,836) |
| State: | 7.5% (15,967) |
Number of households with income $40k - 50k:| Hartland: | 8.7% (70,358) |
| Connecticut: | 8.7% (18,466) |
Number of households with income $50k - 60k:| Hartland: | 6.9% (56,031) |
| State: | 6.9% (14,706) |
Number of households with income $60k - 75k:| Hartland: | 8.9% (71,965) |
| Connecticut: | 8.9% (18,888) |
Number of households with income $75k - 100k:| Hartland: | 13.5% (109,232) |
| State: | 13.5% (28,669) |
Number of households with income $100k - 125k:| Hartland: | 8.2% (66,425) |
| State: | 8.2% (17,434) |
Number of households with income $125k - 150k:| Hartland: | 6.5% (52,397) |
| Connecticut: | 6.5% (13,752) |
Number of households with income $150k - 200k:| Hartland: | 6.6% (53,776) |
| Connecticut: | 6.6% (14,114) |
Number of households with income > $200k:| Hartland: | 6.4% (51,932) |
| State: | 6.4% (13,630) |
Median per capita income in Hartland in 2022:| Hartland: | $90,165 |
| State: | $28,507 |
Change in median per capita income between 2000 and 2022:| Hartland, Connecticut: | +80.3% |
| State: | +117.2% |
Income statistics for American Indian and Alaska Native residents
Number of households with income < $10k:| Hartland: | 8.4% (9,644) |
| Connecticut: | 10.2% (340) |
Number of households with income $10k - 20k:| Hartland: | 9.4% (10,762) |
| State: | 8.5% (283) |
Number of households with income $20k - 30k:| Hartland: | 8.5% (9,734) |
| State: | 9.4% (314) |
Number of households with income $30k - 40k:| Hartland: | 9.1% (10,429) |
| State: | 10.1% (337) |
Number of households with income $40k - 50k:| Hartland: | 8.3% (9,566) |
| Connecticut: | 13.4% (447) |
Number of households with income $50k - 60k:| Hartland: | 7.8% (9,020) |
| State: | 3.1% (104) |
Number of households with income $60k - 75k:| Hartland: | 9.8% (11,244) |
| State: | 5.6% (188) |
Number of households with income $75k - 100k:| Hartland: | 12.6% (14,514) |
| Connecticut: | 13.4% (447) |
Number of households with income $100k - 125k:| Hartland: | 9.4% (10,853) |
| State: | 9.5% (317) |
Number of households with income $125k - 150k:| Hartland: | 5.6% (6,498) |
| State: | 3.9% (131) |
Number of households with income $150k - 200k:| Hartland: | 6.0% (6,850) |
| State: | 6.3% (212) |
Number of households with income > $200k:| Hartland: | 5.2% (5,929) |
| State: | 6.8% (228) |
Median per capita income in Hartland in 2022:| Hartland: | $2,085 |
| Connecticut: | $25,355 |
Change in median per capita income between 2000 and 2022:| Hartland, Connecticut: | +45.9% |
| State: | +39.4% |
Income statistics for Multirace residents
Median household income in Hartland, CT in 2022:| Hartland: | $76,805 |
| Connecticut: | $77,277 |
Change in median household income between 2000 and 2022:| Hartland, Connecticut: | +119.4% |
| State: | +113.6% |
Number of households with income < $10k:| Hartland: | 6.0% (7,213) |
| State: | 6.0% (7,457) |
Number of households with income $10k - 20k:| Hartland: | 8.1% (9,807) |
| Connecticut: | 8.1% (10,139) |
Number of households with income $20k - 30k:| Hartland: | 7.0% (8,417) |
| State: | 7.0% (8,702) |
Number of households with income $30k - 40k:| Hartland: | 6.9% (8,266) |
| Connecticut: | 6.9% (8,546) |
Number of households with income $40k - 50k:| Hartland: | 7.0% (8,427) |
| State: | 7.0% (8,712) |
Number of households with income $50k - 60k:| Hartland: | 5.9% (7,091) |
| Connecticut: | 5.9% (7,331) |
Number of households with income $60k - 75k:| Hartland: | 8.5% (10,285) |
| State: | 8.5% (10,634) |
Number of households with income $75k - 100k:| Hartland: | 14.1% (17,023) |
| Connecticut: | 14.1% (17,600) |
Number of households with income $100k - 125k:| Hartland: | 9.9% (11,977) |
| State: | 9.9% (12,383) |
Number of households with income $125k - 150k:| Hartland: | 7.2% (8,629) |
| State: | 7.2% (8,921) |
Number of households with income $150k - 200k:| Hartland: | 8.8% (10,564) |
| State: | 8.8% (10,922) |
Number of households with income > $200k:| Hartland: | 10.6% (12,813) |
| State: | 10.6% (13,247) |
Aggregate household income in Hartland in 2022: $1,966,300
Median non-family income in Hartland in 2022:| Hartland: | $63,358 |
| Connecticut: | $44,462 |
Change in median non-family income between 2000 and 2022:| Hartland, Connecticut: | +81.0% |
| State: | +97.6% |
Median per capita income in Hartland in 2022:| Hartland: | $35,730 |
| Connecticut: | $32,794 |
Change in median per capita income between 2000 and 2022:| Hartland, Connecticut: | +95.5% |
| State: | +117.2% |