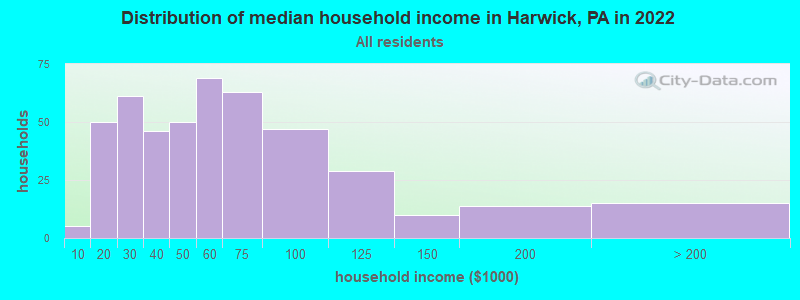
The median household income in Harwick, PA in 2022 was $51,306, which was 39.9% less than the median annual income of $71,798 across the entire state of Pennsylvania. Compared to the median income of $38,329 in 2000 this represents an increase of 25.3%. The per capita income in 2022 was $34,753, which means an increase of 35.3% compared to 2000 when it was $22,491.
Whole page based on the data from 2000 / 2022 when the population of Harwick, Pennsylvania was 899 / 854
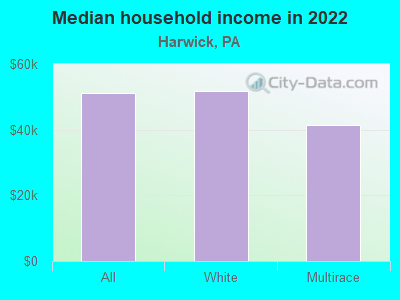
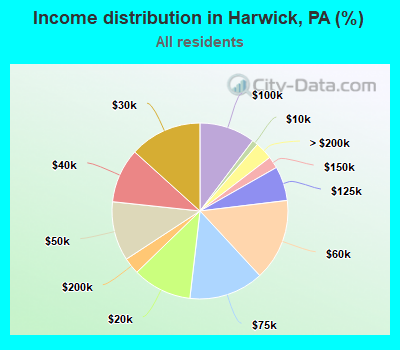
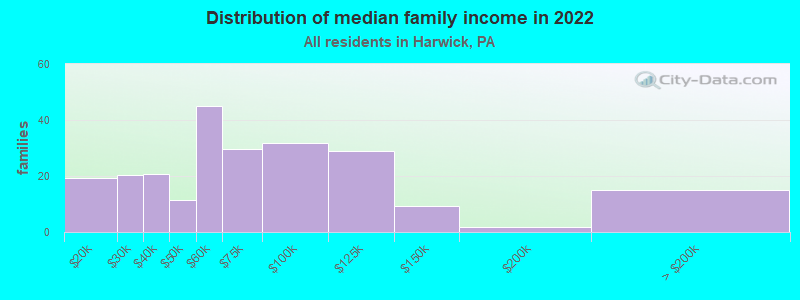
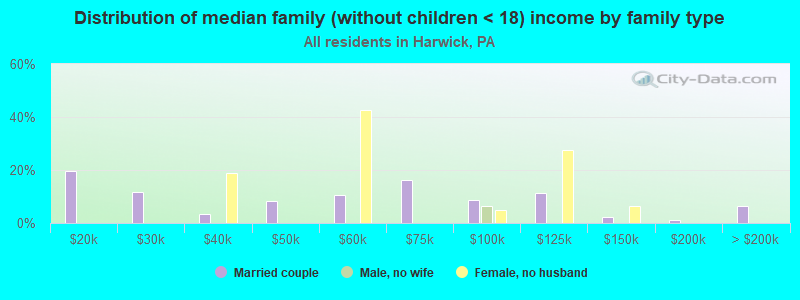
Income statistics for all residents
Median household income in Harwick, PA in 2022:
Harwick:
$51,307
State:
$71,798
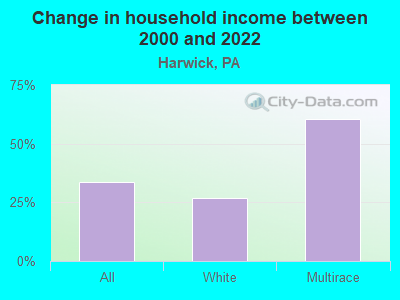
Change in median household income between 2000 and 2022:
Harwick, Pennsylvania:
+33.9%
State:
+79.0%
Number of households with income < $10k:
Harwick:
1.1% (5)
Pennsylvania:
5.5% (291,562)
Number of households with income $10k - 20k:
Harwick:
10.9% (50)
State:
7.3% (384,726)
Number of households with income $20k - 30k:
Harwick:
13.3% (61)
State:
7.4% (389,464)
Number of households with income $30k - 40k:
Harwick:
10.0% (46)
Pennsylvania:
7.6% (402,138)
Number of households with income $40k - 50k:
Harwick:
10.9% (50)
State:
7.3% (387,945)
Number of households with income $50k - 60k:
Harwick:
15.0% (69)
Pennsylvania:
7.0% (372,468)
Number of households with income $60k - 75k:
Harwick:
13.7% (63)
Pennsylvania:
9.9% (524,786)
Number of households with income $75k - 100k:
Harwick:
10.2% (47)
Pennsylvania:
12.6% (666,253)
Number of households with income $100k - 125k:
Harwick:
6.3% (29)
Pennsylvania:
9.9% (526,402)
Number of households with income $125k - 150k:
Harwick:
2.2% (10)
State:
6.9% (362,702)
Number of households with income $150k - 200k:
Harwick:
3.1% (14)
State:
8.3% (440,827)
Number of households with income > $200k:
Harwick:
3.3% (15)
State:
10.3% (544,792)
Aggregate household income in Harwick in 2022: $28,868,651
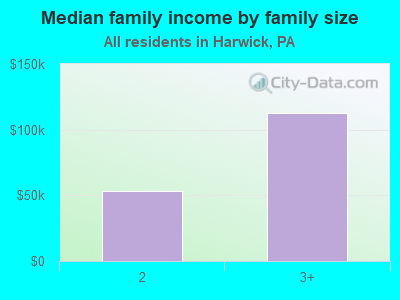
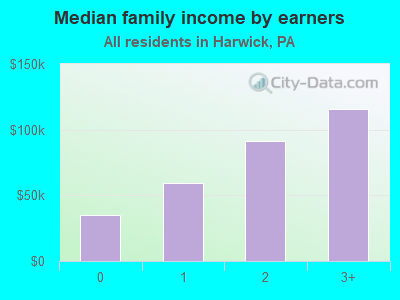
Median family income in Harwick in 2022:
Harwick:
$58,394
State:
$93,029
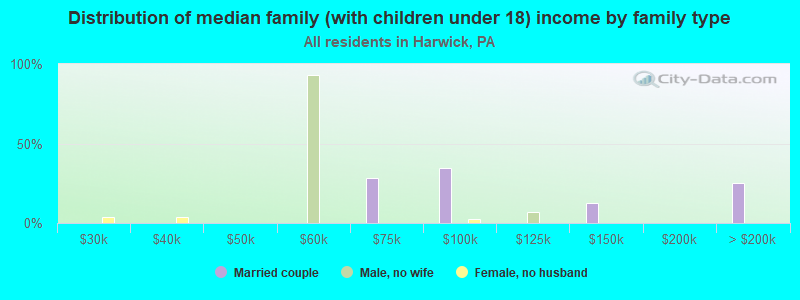
Number of families with income $10k - 20k:
Harwick:
8.3% (19)
Pennsylvania:
3.5% (115,881)
Number of families with income $20k - 30k:
Harwick:
8.7% (20)
Pennsylvania:
4.8% (156,521)
Number of families with income $30k - 40k:
Harwick:
8.9% (21)
Pennsylvania:
5.8% (191,305)
Number of families with income $40k - 50k:
Harwick:
4.9% (12)
State:
6.4% (211,380)
Number of families with income $50k - 60k:
Harwick:
19.2% (45)
State:
6.4% (209,910)
Number of families with income $60k - 75k:
Harwick:
12.8% (30)
State:
9.7% (318,991)
Number of families with income $75k - 100k:
Harwick:
13.6% (32)
State:
14.0% (461,021)
Number of families with income $100k - 125k:
Harwick:
12.3% (29)
Pennsylvania:
12.2% (400,961)
Number of families with income $125k - 150k:
Harwick:
4.0% (9)
Pennsylvania:
8.8% (288,471)
Number of families with income $150k - 200k:
Harwick:
0.8% (2)
State:
11.2% (367,642)
Number of families with income > $200k:
Harwick:
6.4% (15)
State:
14.3% (470,863)
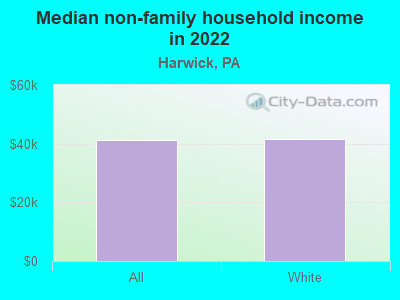
Median non-family income in Harwick in 2022:
Harwick:
$41,237
State:
$42,203
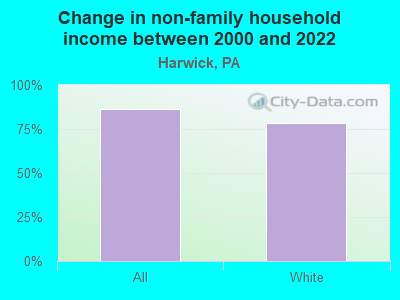
Change in median non-family income between 2000 and 2022:
Harwick, Pennsylvania:
+86.5%
State:
+90.1%
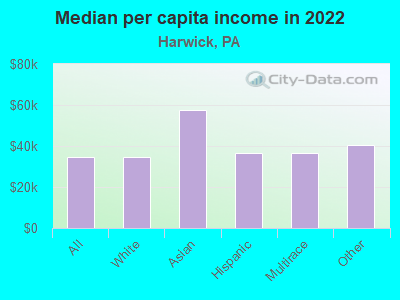
Median per capita income in Harwick in 2022:
Harwick:
$34,754
Pennsylvania:
$41,489
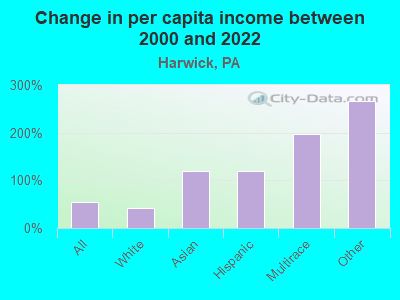
Change in median per capita income between 2000 and 2022:
Harwick, Pennsylvania:
+54.5%
State:
+98.7%
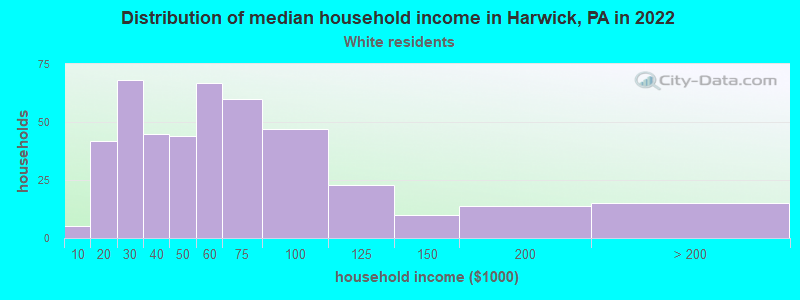
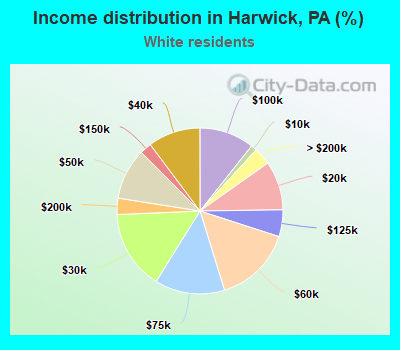
Income statistics for White residents
Median household income in Harwick, PA in 2022:
Harwick:
$51,857
State:
$76,765
Change in median household income between 2000 and 2022:
Harwick, Pennsylvania:
+26.9%
Pennsylvania:
+84.3%
Number of households with income < $10k:
Harwick:
1.1% (5)
State:
4.3% (179,792)
Number of households with income $10k - 20k:
Harwick:
9.5% (42)
Pennsylvania:
6.5% (268,738)
Number of households with income $20k - 30k:
Harwick:
15.5% (68)
State:
7.0% (288,138)
Number of households with income $30k - 40k:
Harwick:
10.2% (45)
State:
7.2% (300,208)
Number of households with income $40k - 50k:
Harwick:
10.0% (44)
State:
7.2% (298,756)
Number of households with income $50k - 60k:
Harwick:
15.2% (67)
State:
6.8% (283,251)
Number of households with income $60k - 75k:
Harwick:
13.6% (60)
Pennsylvania:
9.9% (408,159)
Number of households with income $75k - 100k:
Harwick:
10.7% (47)
State:
13.2% (547,809)
Number of households with income $100k - 125k:
Harwick:
5.2% (23)
State:
10.5% (436,652)
Number of households with income $125k - 150k:
Harwick:
2.3% (10)
Pennsylvania:
7.3% (304,132)
Number of households with income $150k - 200k:
Harwick:
3.2% (14)
State:
9.0% (374,658)
Number of households with income > $200k:
Harwick:
3.4% (15)
Pennsylvania:
10.9% (452,618)
Aggregate household income in Harwick in 2022: $27,190,188
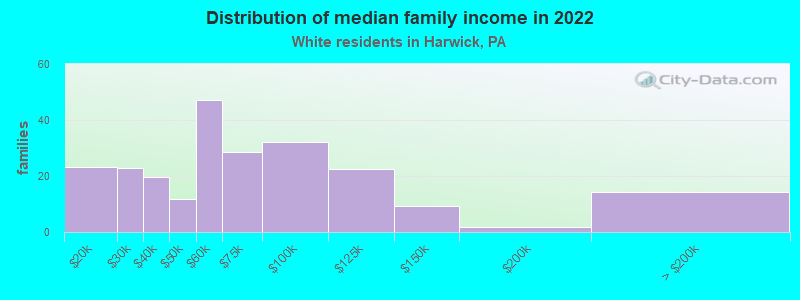
Median family income in Harwick in 2022:
Harwick:
$57,603
Pennsylvania:
$99,396
Number of families with income $10k - 20k:
Harwick:
10.0% (23)
Pennsylvania:
2.7% (69,032)
Number of families with income $20k - 30k:
Harwick:
9.8% (23)
State:
3.9% (100,065)
Number of families with income $30k - 40k:
Harwick:
8.4% (20)
State:
5.2% (134,367)
Number of families with income $40k - 50k:
Harwick:
5.1% (12)
Pennsylvania:
6.0% (154,327)
Number of families with income $50k - 60k:
Harwick:
20.2% (47)
State:
6.1% (157,983)
Number of families with income $60k - 75k:
Harwick:
12.2% (29)
State:
9.6% (249,292)
Number of families with income $75k - 100k:
Harwick:
13.7% (32)
Pennsylvania:
14.7% (379,316)
Number of families with income $100k - 125k:
Harwick:
9.7% (23)
State:
12.9% (333,626)
Number of families with income $125k - 150k:
Harwick:
4.0% (9)
Pennsylvania:
9.4% (243,915)
Number of families with income $150k - 200k:
Harwick:
0.8% (2)
Pennsylvania:
12.2% (314,926)
Number of families with income > $200k:
Harwick:
6.1% (14)
Pennsylvania:
15.1% (390,885)
Median non-family income in Harwick in 2022:
Harwick:
$41,674
State:
$44,251
Change in median non-family income between 2000 and 2022:
Harwick, Pennsylvania:
+78.2%
State:
+94.2%
Median per capita income in Harwick in 2022:
Harwick:
$34,401
State:
$45,306
Change in median per capita income between 2000 and 2022:
Harwick, Pennsylvania:
+43.3%
State:
+105.4%
Income statistics for Asian residents
Aggregate household income in Harwick in 2022: $2,869,680,100
Median per capita income in Harwick in 2022:
Harwick:
$57,417
State:
$48,341
Change in median per capita income between 2000 and 2022:
Harwick, Pennsylvania:
+118.7%
Pennsylvania:
+140.6%
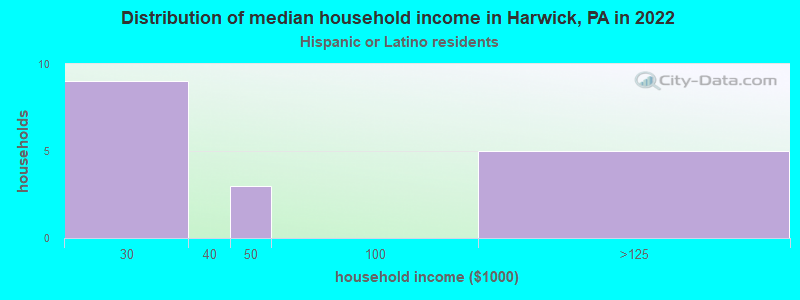
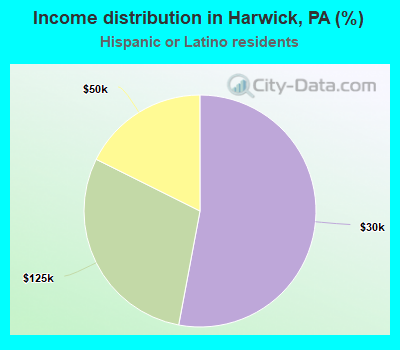
Income statistics for Hispanic or Latino residents
Number of households with income < $10k:
Harwick:
0.0% (0)
Pennsylvania:
8.7% (29,517)
Number of households with income $10k - 20k:
Harwick:
0.0% (0)
State:
10.0% (33,785)
Number of households with income $20k - 30k:
Harwick:
52.9% (9)
State:
9.9% (33,399)
Number of households with income $30k - 40k:
Harwick:
0.0% (0)
Pennsylvania:
8.8% (29,878)
Number of households with income $40k - 50k:
Harwick:
17.6% (3)
Pennsylvania:
8.5% (28,549)
Number of households with income $50k - 60k:
Harwick:
0.0% (0)
State:
7.6% (25,792)
Number of households with income $60k - 75k:
Harwick:
0.0% (0)
State:
10.6% (35,808)
Number of households with income $75k - 100k:
Harwick:
0.0% (0)
State:
11.9% (40,287)
Number of households with income $100k - 125k:
Harwick:
29.4% (5)
Pennsylvania:
8.0% (27,028)
Number of households with income $125k - 150k:
Harwick:
0.0% (0)
State:
5.2% (17,622)
Number of households with income $150k - 200k:
Harwick:
0.0% (0)
State:
5.2% (17,563)
Number of households with income > $200k:
Harwick:
0.0% (0)
State:
5.5% (18,469)
Aggregate household income in Harwick in 2022: $884,561
Median per capita income in Harwick in 2022:
Harwick:
$36,696
State:
$23,829
Change in median per capita income between 2000 and 2022:
Harwick, Pennsylvania:
+118.9%
Pennsylvania:
+116.4%
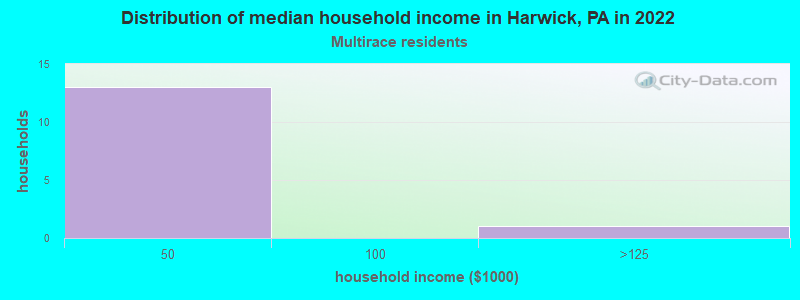
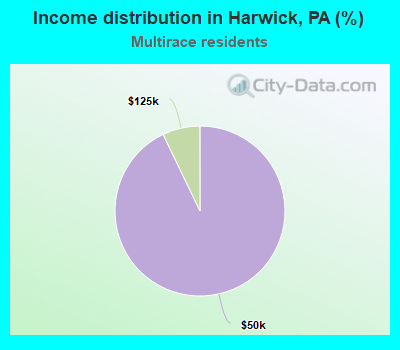
Income statistics for Multirace residents
Median household income in Harwick, PA in 2022:
Harwick:
$41,367
State:
$61,450
Change in median household income between 2000 and 2022:
Harwick, Pennsylvania:
+60.6%
State:
+103.9%
Number of households with income < $10k:
Harwick:
0.0% (0)
Pennsylvania:
7.8% (21,911)
Number of households with income $10k - 20k:
Harwick:
0.0% (0)
State:
8.2% (22,847)
Number of households with income $20k - 30k:
Harwick:
0.0% (0)
State:
8.7% (24,252)
Number of households with income $30k - 40k:
Harwick:
0.0% (0)
State:
7.3% (20,502)
Number of households with income $40k - 50k:
Harwick:
92.9% (13)
State:
7.7% (21,525)
Number of households with income $50k - 60k:
Harwick:
0.0% (0)
State:
8.6% (24,174)
Number of households with income $60k - 75k:
Harwick:
0.0% (0)
State:
11.9% (33,350)
Number of households with income $75k - 100k:
Harwick:
0.0% (0)
State:
11.5% (32,274)
Number of households with income $100k - 125k:
Harwick:
7.1% (1)
State:
8.3% (23,361)
Number of households with income $125k - 150k:
Harwick:
0.0% (0)
State:
5.3% (14,784)
Number of households with income $150k - 200k:
Harwick:
0.0% (0)
State:
6.9% (19,314)
Number of households with income > $200k:
Harwick:
0.0% (0)
State:
7.8% (21,759)
Aggregate household income in Harwick in 2022: $558,214
Median per capita income in Harwick in 2022:
Harwick:
$36,495
State:
$27,581
Income statistics for other residents
Aggregate household income in Harwick in 2022: $354,125,300
Median per capita income in Harwick in 2022:
Harwick:
$40,476
State:
$24,779
Discuss Harwick, Pennsylvania (PA) on our hugely popular Pennsylvania forum.