Harwinton, Connecticut (CT) income map, earnings map, and wages data
The median household income in Harwinton, CT in 2022 was $112,056, which was 21.1% greater than the median annual income of $88,429 across the entire state of Connecticut. Compared to the median income of $66,222 in 2000 this represents an increase of 40.9%. The per capita income in 2022 was $58,788, which means an increase of 45.3% compared to 2000 when it was $32,137.
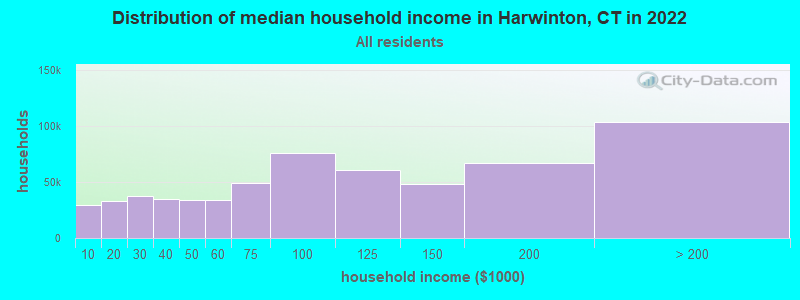
Income statistics for all residents
Median household income in Harwinton, CT in 2022:| Harwinton: | $112,057 |
| State: | $88,429 |
Change in median household income between 2000 and 2022:| Harwinton, Connecticut: | +69.2% |
| State: | +64.0% |
Number of households with income < $10k:| Harwinton: | 5.2% (45,643) |
| State: | 5.1% (72,746) |
Number of households with income $10k - 20k:| Harwinton: | 5.8% (51,468) |
| Connecticut: | 5.7% (81,643) |
Number of households with income $20k - 30k:| Harwinton: | 6.6% (58,258) |
| State: | 6.5% (92,844) |
Number of households with income $30k - 40k:| Harwinton: | 5.9% (52,283) |
| State: | 5.9% (83,934) |
Number of households with income $40k - 50k:| Harwinton: | 5.9% (51,947) |
| State: | 5.8% (83,025) |
Number of households with income $50k - 60k:| Harwinton: | 5.8% (50,938) |
| State: | 5.7% (81,788) |
Number of households with income $60k - 75k:| Harwinton: | 8.1% (71,370) |
| State: | 8.1% (115,651) |
Number of households with income $75k - 100k:| Harwinton: | 12.6% (111,464) |
| State: | 12.6% (180,173) |
Number of households with income $100k - 125k:| Harwinton: | 9.8% (86,774) |
| Connecticut: | 9.9% (141,231) |
Number of households with income $125k - 150k:| Harwinton: | 7.8% (69,297) |
| State: | 7.9% (112,826) |
Number of households with income $150k - 200k:| Harwinton: | 10.7% (94,793) |
| State: | 10.8% (154,641) |
Number of households with income > $200k:| Harwinton: | 16.0% (141,615) |
| State: | 16.3% (233,133) |
Aggregate household income in Harwinton in 2022: $7,261,957,404
Median family income in Harwinton in 2022:| Harwinton: | $135,578 |
| State: | $115,183 |
Median non-family income in Harwinton in 2022:| Harwinton: | $61,546 |
| State: | $50,964 |
Change in median non-family income between 2000 and 2022:| Harwinton, Connecticut: | +71.5% |
| Connecticut: | +65.1% |
Median per capita income in Harwinton in 2022:| Harwinton: | $58,788 |
| State: | $51,581 |
Change in median per capita income between 2000 and 2022:| Harwinton, Connecticut: | +82.9% |
| Connecticut: | +79.3% |
Income statistics for White residents
Median household income in Harwinton, CT in 2022:| Harwinton: | $112,718 |
| Connecticut: | $96,890 |
Change in median household income between 2000 and 2022:| Harwinton, Connecticut: | +69.4% |
| State: | +68.5% |
Number of households with income < $10k:| Harwinton: | 4.2% (24,654) |
| Connecticut: | 4.2% (42,265) |
Number of households with income $10k - 20k:| Harwinton: | 4.9% (28,344) |
| State: | 4.8% (48,323) |
Number of households with income $20k - 30k:| Harwinton: | 5.8% (33,709) |
| State: | 5.7% (57,716) |
Number of households with income $30k - 40k:| Harwinton: | 5.4% (31,203) |
| State: | 5.3% (53,827) |
Number of households with income $40k - 50k:| Harwinton: | 5.3% (31,074) |
| State: | 5.3% (53,301) |
Number of households with income $50k - 60k:| Harwinton: | 5.6% (32,338) |
| State: | 5.5% (55,690) |
Number of households with income $60k - 75k:| Harwinton: | 7.9% (46,213) |
| State: | 8.0% (80,329) |
Number of households with income $75k - 100k:| Harwinton: | 12.7% (74,051) |
| State: | 12.7% (128,070) |
Number of households with income $100k - 125k:| Harwinton: | 10.0% (58,148) |
| State: | 10.0% (101,210) |
Number of households with income $125k - 150k:| Harwinton: | 8.0% (46,683) |
| State: | 8.0% (81,250) |
Number of households with income $150k - 200k:| Harwinton: | 11.8% (68,642) |
| Connecticut: | 11.8% (119,527) |
Number of households with income > $200k:| Harwinton: | 18.4% (107,456) |
| State: | 18.6% (187,875) |
Aggregate household income in Harwinton in 2022: $5,532,612,531
Median family income in Harwinton in 2022:| Harwinton: | $139,134 |
| State: | $128,955 |
Number of families with income < $10k:| Harwinton: | 1.0% (14) |
| State: | 1.9% (11,537) |
Number of families with income $10k - 20k:| Harwinton: | 0.6% (8) |
| State: | 1.8% (11,289) |
Number of families with income $20k - 30k:| Harwinton: | 2.6% (37) |
| State: | 3.0% (18,506) |
Number of families with income $30k - 40k:| Harwinton: | 2.2% (30) |
| State: | 2.9% (18,160) |
Number of families with income $40k - 50k:| Harwinton: | 5.3% (73) |
| State: | 3.9% (24,550) |
Number of families with income $50k - 60k:| Harwinton: | 3.7% (52) |
| State: | 4.3% (26,723) |
Number of families with income $60k - 75k:| Harwinton: | 7.4% (103) |
| State: | 7.1% (44,075) |
Number of families with income $75k - 100k:| Harwinton: | 15.6% (217) |
| State: | 12.5% (77,679) |
Number of families with income $100k - 125k:| Harwinton: | 12.0% (168) |
| State: | 11.1% (69,086) |
Number of families with income $125k - 150k:| Harwinton: | 8.9% (124) |
| State: | 9.6% (59,616) |
Number of families with income $150k - 200k:| Harwinton: | 18.0% (251) |
| State: | 15.7% (97,890) |
Number of families with income > $200k:| Harwinton: | 22.7% (316) |
| State: | 26.3% (163,417) |
Median non-family income in Harwinton in 2022:| Harwinton: | $64,043 |
| Connecticut: | $54,067 |
Change in median non-family income between 2000 and 2022:| Harwinton, Connecticut: | +73.7% |
| State: | +68.7% |
Median per capita income in Harwinton in 2022:| Harwinton: | $62,301 |
| State: | $59,916 |
Change in median per capita income between 2000 and 2022:| Harwinton, Connecticut: | +92.1% |
| State: | +90.2% |
Income statistics for Asian residents
Number of households with income < $10k:| Harwinton: | 7.1% (942) |
| State: | 7.1% (4,245) |
Number of households with income $10k - 20k:| Harwinton: | 3.5% (463) |
| State: | 3.5% (2,087) |
Number of households with income $20k - 30k:| Harwinton: | 4.1% (547) |
| State: | 4.1% (2,464) |
Number of households with income $30k - 40k:| Harwinton: | 4.1% (550) |
| State: | 4.1% (2,478) |
Number of households with income $40k - 50k:| Harwinton: | 3.3% (440) |
| State: | 3.3% (1,983) |
Number of households with income $50k - 60k:| Harwinton: | 3.9% (517) |
| State: | 3.9% (2,328) |
Number of households with income $60k - 75k:| Harwinton: | 7.0% (938) |
| Connecticut: | 7.0% (4,228) |
Number of households with income $75k - 100k:| Harwinton: | 11.5% (1,534) |
| State: | 11.5% (6,911) |
Number of households with income $100k - 125k:| Harwinton: | 10.2% (1,360) |
| State: | 10.2% (6,127) |
Number of households with income $125k - 150k:| Harwinton: | 8.5% (1,127) |
| State: | 8.5% (5,079) |
Number of households with income $150k - 200k:| Harwinton: | 12.4% (1,650) |
| Connecticut: | 12.4% (7,434) |
Number of households with income > $200k:| Harwinton: | 24.4% (3,254) |
| State: | 24.4% (14,661) |
Median per capita income in Harwinton in 2022:| Harwinton: | $12,632 |
| State: | $55,295 |
Change in median per capita income between 2000 and 2022:| Harwinton, Connecticut: | +103.6% |
| State: | +97.8% |
Income statistics for Hispanic or Latino residents
Median household income in Harwinton, CT in 2022:| Harwinton: | $171,593 |
| Connecticut: | $60,275 |
Change in median household income between 2000 and 2022:| Harwinton, Connecticut: | +67.8% |
| State: | +87.9% |
Number of households with income < $10k:| Harwinton: | 8.7% (59,251) |
| Connecticut: | 8.7% (18,584) |
Number of households with income $10k - 20k:| Harwinton: | 9.1% (61,327) |
| State: | 9.1% (19,235) |
Number of households with income $20k - 30k:| Harwinton: | 8.9% (60,542) |
| State: | 8.9% (18,989) |
Number of households with income $30k - 40k:| Harwinton: | 7.5% (50,907) |
| State: | 7.5% (15,967) |
Number of households with income $40k - 50k:| Harwinton: | 8.7% (58,875) |
| State: | 8.7% (18,466) |
Number of households with income $50k - 60k:| Harwinton: | 6.9% (46,887) |
| Connecticut: | 6.9% (14,706) |
Number of households with income $60k - 75k:| Harwinton: | 8.9% (60,220) |
| State: | 8.9% (18,888) |
Number of households with income $75k - 100k:| Harwinton: | 13.5% (91,405) |
| State: | 13.5% (28,669) |
Number of households with income $100k - 125k:| Harwinton: | 8.2% (55,584) |
| Connecticut: | 8.2% (17,434) |
Number of households with income $125k - 150k:| Harwinton: | 6.5% (43,845) |
| Connecticut: | 6.5% (13,752) |
Number of households with income $150k - 200k:| Harwinton: | 6.6% (44,999) |
| Connecticut: | 6.6% (14,114) |
Number of households with income > $200k:| Harwinton: | 6.4% (43,456) |
| State: | 6.4% (13,630) |
Aggregate household income in Harwinton in 2022: $6,721,891
Median family income in Harwinton in 2022:| Harwinton: | $174,954 |
| State: | $68,336 |
Number of families with income < $10k:| Harwinton: | 2.4% (7) |
| Connecticut: | 5.2% (7,456) |
Number of families with income $10k - 20k:| Harwinton: | 1.9% (6) |
| State: | 6.0% (8,616) |
Number of families with income $20k - 30k:| Harwinton: | 10.0% (30) |
| Connecticut: | 8.9% (12,680) |
Number of families with income $30k - 40k:| Harwinton: | 5.9% (18) |
| State: | 8.5% (12,090) |
Number of families with income $40k - 50k:| Harwinton: | 12.8% (38) |
| Connecticut: | 8.8% (12,624) |
Number of families with income $50k - 60k:| Harwinton: | 8.1% (24) |
| State: | 8.4% (11,924) |
Number of families with income $60k - 75k:| Harwinton: | 9.4% (28) |
| State: | 8.9% (12,677) |
Number of families with income $75k - 100k:| Harwinton: | 19.2% (57) |
| State: | 14.3% (20,457) |
Number of families with income $100k - 125k:| Harwinton: | 8.6% (26) |
| State: | 8.2% (11,720) |
Number of families with income $125k - 150k:| Harwinton: | 7.8% (23) |
| State: | 8.2% (11,729) |
Number of families with income $150k - 200k:| Harwinton: | 7.9% (24) |
| State: | 7.1% (10,096) |
Number of families with income > $200k:| Harwinton: | 6.0% (18) |
| State: | 7.4% (10,622) |
Median per capita income in Harwinton in 2022:| Harwinton: | $54,366 |
| Connecticut: | $28,507 |
Change in median per capita income between 2000 and 2022:| Harwinton, Connecticut: | +80.3% |
| State: | +117.2% |
Income statistics for American Indian and Alaska Native residents
Median household income in Harwinton, CT in 2022:| Harwinton: | $2,820 |
| State: | $41,848 |
Change in median household income between 2000 and 2022:| Harwinton, Connecticut: | +12.9% |
| State: | +12.9% |
Number of households with income < $10k:| Harwinton: | 8.4% (7,106) |
| State: | 10.2% (340) |
Number of households with income $10k - 20k:| Harwinton: | 9.4% (7,930) |
| State: | 8.5% (283) |
Number of households with income $20k - 30k:| Harwinton: | 8.5% (7,173) |
| State: | 9.4% (314) |
Number of households with income $30k - 40k:| Harwinton: | 9.1% (7,685) |
| State: | 10.1% (337) |
Number of households with income $40k - 50k:| Harwinton: | 8.3% (7,049) |
| State: | 13.4% (447) |
Number of households with income $50k - 60k:| Harwinton: | 7.8% (6,647) |
| State: | 3.1% (104) |
Number of households with income $60k - 75k:| Harwinton: | 9.8% (8,285) |
| State: | 5.6% (188) |
Number of households with income $75k - 100k:| Harwinton: | 12.6% (10,694) |
| State: | 13.4% (447) |
Number of households with income $100k - 125k:| Harwinton: | 9.4% (7,997) |
| State: | 9.5% (317) |
Number of households with income $125k - 150k:| Harwinton: | 5.6% (4,788) |
| Connecticut: | 3.9% (131) |
Number of households with income $150k - 200k:| Harwinton: | 6.0% (5,047) |
| Connecticut: | 6.3% (212) |
Number of households with income > $200k:| Harwinton: | 5.2% (4,369) |
| State: | 6.8% (228) |
Median non-family income in Harwinton in 2022:| Harwinton: | $5,625 |
| Connecticut: | $40,310 |
Change in median non-family income between 2000 and 2022:| Harwinton, Connecticut: | +125.1% |
| State: | +125.1% |
Income statistics for Multirace residents
Number of households with income < $10k:| Harwinton: | 6.0% (5,213) |
| Connecticut: | 6.0% (7,457) |
Number of households with income $10k - 20k:| Harwinton: | 8.1% (7,089) |
| State: | 8.1% (10,139) |
Number of households with income $20k - 30k:| Harwinton: | 7.0% (6,084) |
| State: | 7.0% (8,702) |
Number of households with income $30k - 40k:| Harwinton: | 6.9% (5,975) |
| State: | 6.9% (8,546) |
Number of households with income $40k - 50k:| Harwinton: | 7.0% (6,091) |
| State: | 7.0% (8,712) |
Number of households with income $50k - 60k:| Harwinton: | 5.9% (5,125) |
| State: | 5.9% (7,331) |
Number of households with income $60k - 75k:| Harwinton: | 8.5% (7,434) |
| State: | 8.5% (10,634) |
Number of households with income $75k - 100k:| Harwinton: | 14.1% (12,304) |
| State: | 14.1% (17,600) |
Number of households with income $100k - 125k:| Harwinton: | 9.9% (8,657) |
| Connecticut: | 9.9% (12,383) |
Number of households with income $125k - 150k:| Harwinton: | 7.2% (6,237) |
| State: | 7.2% (8,921) |
Number of households with income $150k - 200k:| Harwinton: | 8.8% (7,636) |
| State: | 8.8% (10,922) |
Number of households with income > $200k:| Harwinton: | 10.6% (9,261) |
| State: | 10.6% (13,247) |
Median per capita income in Harwinton in 2022:| Harwinton: | $20,633 |
| State: | $32,794 |
Change in median per capita income between 2000 and 2022:| Harwinton, Connecticut: | +95.5% |
| State: | +117.2% |