The median household income in Hayfield, VA in 2022 was $176,123, which was 51.2% greater than the median annual income of $85,873 across the entire state of Virginia. Compared to the median income of $81,050 in 2000 this represents an increase of 54.0%. The per capita income in 2022 was $80,938, which means an increase of 54.4% compared to 2000 when it was $36,888.
Whole page based on the data from 2000 / 2022 when the population of Hayfield, Virginia was 3,909 / 4,363
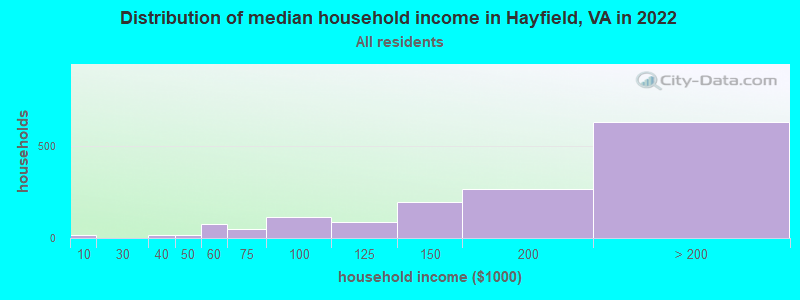
Income statistics for all residents
Median household income in Hayfield, VA in 2022:
Hayfield:
$176,124
Virginia:
$85,873
Change in median household income between 2000 and 2022:
Hayfield, Virginia:
+117.3%
State:
+84.0%
Number of households with income < $10k:
Hayfield:
1.3% (19)
Virginia:
4.9% (165,315)
Number of households with income $10k - 20k:
Hayfield:
0.0% (0)
State:
5.9% (199,380)
Number of households with income $20k - 30k:
Hayfield:
0.0% (0)
State:
6.0% (202,243)
Number of households with income $30k - 40k:
Hayfield:
1.1% (16)
State:
6.1% (205,967)
Number of households with income $40k - 50k:
Hayfield:
1.3% (19)
Virginia:
6.4% (215,648)
Number of households with income $50k - 60k:
Hayfield:
5.1% (76)
State:
6.2% (210,516)
Number of households with income $60k - 75k:
Hayfield:
3.4% (50)
State:
8.6% (292,112)
Number of households with income $75k - 100k:
Hayfield:
7.8% (116)
Virginia:
12.2% (412,198)
Number of households with income $100k - 125k:
Hayfield:
5.8% (85)
State:
10.3% (348,998)
Number of households with income $125k - 150k:
Hayfield:
13.4% (198)
State:
7.7% (261,236)
Number of households with income $150k - 200k:
Hayfield:
18.0% (266)
Virginia:
10.3% (347,282)
Number of households with income > $200k:
Hayfield:
42.8% (633)
Virginia:
15.4% (519,712)
Aggregate household income in Hayfield in 2022: $345,707,478
Median family income in Hayfield in 2022:
Hayfield:
$195,039
State:
$107,101
Number of families with income < $10k:
Hayfield:
0.3% (4)
State:
2.8% (61,637)
Number of families with income $40k - 50k:
Hayfield:
0.5% (6)
State:
5.4% (118,579)
Number of families with income $50k - 60k:
Hayfield:
3.8% (45)
State:
5.5% (120,924)
Number of families with income $60k - 75k:
Hayfield:
2.0% (24)
State:
8.2% (180,564)
Number of families with income $75k - 100k:
Hayfield:
5.0% (60)
Virginia:
12.6% (277,221)
Number of families with income $100k - 125k:
Hayfield:
6.6% (79)
Virginia:
11.3% (248,485)
Number of families with income $125k - 150k:
Hayfield:
10.7% (128)
State:
9.0% (197,999)
Number of families with income $150k - 200k:
Hayfield:
22.1% (265)
Virginia:
12.7% (278,323)
Number of families with income > $200k:
Hayfield:
49.1% (589)
Virginia:
20.3% (445,515)
Median non-family income in Hayfield in 2022:
Hayfield:
$80,848
State:
$51,436
Change in median non-family income between 2000 and 2022:
Hayfield, Virginia:
+45.0%
Virginia:
+73.5%
Median per capita income in Hayfield in 2022:
Hayfield:
$80,939
State:
$47,199
Change in median per capita income between 2000 and 2022:
Hayfield, Virginia:
+119.4%
State:
+96.9%
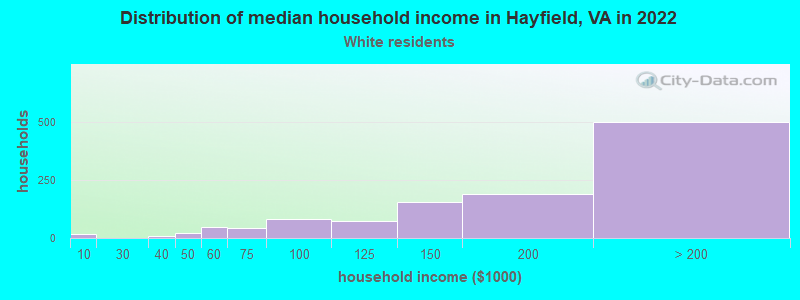
Income statistics for White residents
Median household income in Hayfield, VA in 2022:
Hayfield:
$174,093
Virginia:
$91,924
Change in median household income between 2000 and 2022:
Hayfield, Virginia:
+98.2%
Virginia:
+81.9%
Number of households with income < $10k:
Hayfield:
1.7% (19)
State:
4.1% (90,549)
Number of households with income $10k - 20k:
Hayfield:
0.0% (0)
State:
5.2% (114,324)
Number of households with income $20k - 30k:
Hayfield:
0.0% (0)
State:
5.7% (125,676)
Number of households with income $30k - 40k:
Hayfield:
0.7% (8)
Virginia:
5.5% (121,220)
Number of households with income $40k - 50k:
Hayfield:
1.9% (21)
State:
6.0% (133,011)
Number of households with income $50k - 60k:
Hayfield:
4.1% (46)
Virginia:
6.2% (136,856)
Number of households with income $60k - 75k:
Hayfield:
3.7% (42)
State:
8.4% (186,094)
Number of households with income $75k - 100k:
Hayfield:
7.1% (80)
State:
12.5% (277,077)
Number of households with income $100k - 125k:
Hayfield:
6.4% (72)
State:
10.8% (237,562)
Number of households with income $125k - 150k:
Hayfield:
13.8% (156)
State:
8.0% (177,532)
Number of households with income $150k - 200k:
Hayfield:
16.8% (190)
State:
11.0% (242,106)
Number of households with income > $200k:
Hayfield:
44.0% (498)
State:
16.6% (366,064)
Aggregate household income in Hayfield in 2022: $276,180,497
Median family income in Hayfield in 2022:
Hayfield:
$209,740
Virginia:
$114,708
Number of families with income < $10k:
Hayfield:
0.4% (4)
State:
1.9% (27,415)
Number of families with income $50k - 60k:
Hayfield:
1.7% (15)
State:
5.2% (74,438)
Number of families with income $60k - 75k:
Hayfield:
2.1% (19)
State:
8.2% (116,265)
Number of families with income $75k - 100k:
Hayfield:
5.2% (46)
State:
12.9% (183,581)
Number of families with income $100k - 125k:
Hayfield:
6.4% (56)
Virginia:
11.9% (168,950)
Number of families with income $125k - 150k:
Hayfield:
10.8% (95)
State:
9.5% (134,452)
Number of families with income $150k - 200k:
Hayfield:
20.5% (182)
State:
13.8% (195,800)
Number of families with income > $200k:
Hayfield:
53.0% (470)
Virginia:
22.1% (313,072)
Median non-family income in Hayfield in 2022:
Hayfield:
$87,605
State:
$53,785
Change in median non-family income between 2000 and 2022:
Hayfield, Virginia:
+51.3%
State:
+70.5%
Median per capita income in Hayfield in 2022:
Hayfield:
$91,204
Virginia:
$53,456
Change in median per capita income between 2000 and 2022:
Hayfield, Virginia:
+112.9%
State:
+99.2%
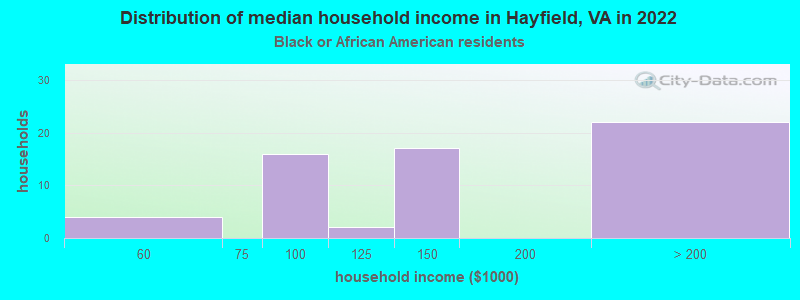
Income statistics for Black or African American residents
Median household income in Hayfield, VA in 2022:
Hayfield:
$136,854
Virginia:
$60,526
Change in median household income between 2000 and 2022:
Hayfield, Virginia:
+138.3%
State:
+87.6%
Number of households with income < $10k:
Hayfield:
0.0% (0)
Virginia:
8.3% (52,649)
Number of households with income $10k - 20k:
Hayfield:
0.0% (0)
State:
9.6% (60,583)
Number of households with income $20k - 30k:
Hayfield:
0.0% (0)
Virginia:
8.1% (51,220)
Number of households with income $30k - 40k:
Hayfield:
0.0% (0)
State:
8.6% (54,185)
Number of households with income $40k - 50k:
Hayfield:
0.0% (0)
State:
8.1% (51,156)
Number of households with income $50k - 60k:
Hayfield:
6.6% (4)
Virginia:
7.0% (44,637)
Number of households with income $60k - 75k:
Hayfield:
0.0% (0)
State:
9.8% (62,332)
Number of households with income $75k - 100k:
Hayfield:
26.2% (16)
State:
11.4% (72,479)
Number of households with income $100k - 125k:
Hayfield:
3.3% (2)
Virginia:
8.5% (53,997)
Number of households with income $125k - 150k:
Hayfield:
27.9% (17)
Virginia:
6.3% (40,032)
Number of households with income $150k - 200k:
Hayfield:
0.0% (0)
State:
6.9% (43,513)
Number of households with income > $200k:
Hayfield:
36.1% (22)
State:
7.4% (46,851)
Aggregate household income in Hayfield in 2022: $8,893,257
Median family income in Hayfield in 2022:
Hayfield:
$128,085
Virginia:
$74,125
Number of families with income $50k - 60k:
Hayfield:
8.3% (3)
Virginia:
6.9% (26,158)
Number of families with income $75k - 100k:
Hayfield:
13.4% (5)
State:
13.0% (49,024)
Number of families with income $100k - 125k:
Hayfield:
24.8% (10)
State:
9.9% (37,339)
Number of families with income $125k - 150k:
Hayfield:
30.5% (12)
State:
7.8% (29,249)
Number of families with income > $200k:
Hayfield:
22.9% (9)
Virginia:
10.2% (38,646)
Median per capita income in Hayfield in 2022:
Hayfield:
$55,260
State:
$34,599
Change in median per capita income between 2000 and 2022:
Hayfield, Virginia:
+112.5%
State:
+119.8%
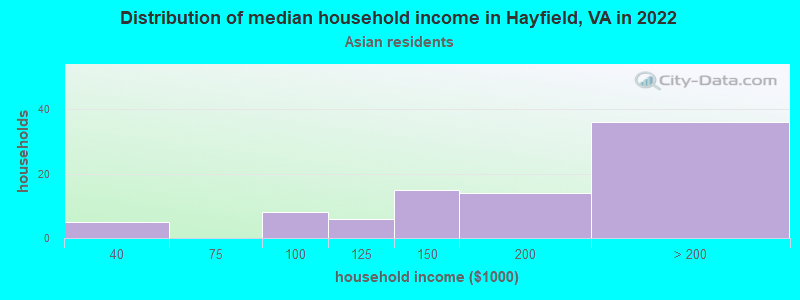
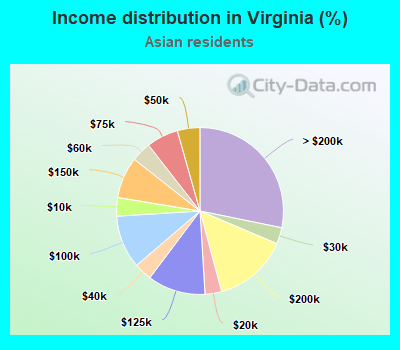
Income statistics for Asian residents
Median household income in Hayfield, VA in 2022:
Hayfield:
$179,985
Virginia:
$126,277
Number of households with income < $10k:
Hayfield:
0.0% (0)
State:
3.6% (7,279)
Number of households with income $10k - 20k:
Hayfield:
0.0% (0)
State:
3.2% (6,565)
Number of households with income $20k - 30k:
Hayfield:
0.0% (0)
State:
3.2% (6,439)
Number of households with income $30k - 40k:
Hayfield:
6.0% (5)
State:
3.5% (7,097)
Number of households with income $40k - 50k:
Hayfield:
0.0% (0)
Virginia:
4.4% (8,868)
Number of households with income $50k - 60k:
Hayfield:
0.0% (0)
Virginia:
3.8% (7,796)
Number of households with income $60k - 75k:
Hayfield:
0.0% (0)
State:
6.2% (12,561)
Number of households with income $75k - 100k:
Hayfield:
9.5% (8)
State:
10.3% (20,876)
Number of households with income $100k - 125k:
Hayfield:
7.1% (6)
State:
11.2% (22,753)
Number of households with income $125k - 150k:
Hayfield:
17.9% (15)
State:
8.0% (16,320)
Number of households with income $150k - 200k:
Hayfield:
16.7% (14)
Virginia:
14.4% (29,314)
Number of households with income > $200k:
Hayfield:
42.9% (36)
Virginia:
28.2% (57,395)
Aggregate household income in Hayfield in 2022: $15,746,036
Median family income in Hayfield in 2022:
Hayfield:
$193,938
State:
$149,837
Number of families with income $75k - 100k:
Hayfield:
9.6% (8)
Virginia:
9.1% (14,105)
Number of families with income $100k - 125k:
Hayfield:
6.5% (5)
State:
10.3% (16,001)
Number of families with income $125k - 150k:
Hayfield:
18.7% (15)
Virginia:
8.3% (12,819)
Number of families with income $150k - 200k:
Hayfield:
18.1% (14)
Virginia:
16.0% (24,747)
Number of families with income > $200k:
Hayfield:
47.1% (37)
State:
33.9% (52,616)
Median per capita income in Hayfield in 2022:
Hayfield:
$63,900
Virginia:
$56,055
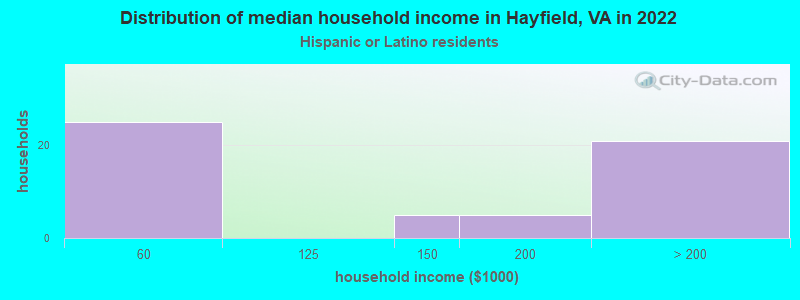
Income statistics for Hispanic or Latino residents
Number of households with income < $10k:
Hayfield:
0.0% (0)
Virginia:
4.6% (11,664)
Number of households with income $10k - 20k:
Hayfield:
0.0% (0)
Virginia:
4.9% (12,443)
Number of households with income $20k - 30k:
Hayfield:
0.0% (0)
Virginia:
5.9% (14,859)
Number of households with income $30k - 40k:
Hayfield:
0.0% (0)
Virginia:
6.8% (17,059)
Number of households with income $40k - 50k:
Hayfield:
0.0% (0)
Virginia:
6.4% (16,261)
Number of households with income $50k - 60k:
Hayfield:
44.6% (25)
State:
6.9% (17,468)
Number of households with income $60k - 75k:
Hayfield:
0.0% (0)
State:
9.6% (24,193)
Number of households with income $75k - 100k:
Hayfield:
0.0% (0)
State:
13.2% (33,405)
Number of households with income $100k - 125k:
Hayfield:
0.0% (0)
State:
10.5% (26,356)
Number of households with income $125k - 150k:
Hayfield:
8.9% (5)
State:
8.1% (20,494)
Number of households with income $150k - 200k:
Hayfield:
8.9% (5)
State:
9.5% (23,943)
Number of households with income > $200k:
Hayfield:
37.5% (21)
State:
13.5% (33,987)
Aggregate household income in Hayfield in 2022: $7,295,625
Median per capita income in Hayfield in 2022:
Hayfield:
$37,812
Virginia:
$32,277
Change in median per capita income between 2000 and 2022:
Hayfield, Virginia:
+113.3%
State:
+104.6%
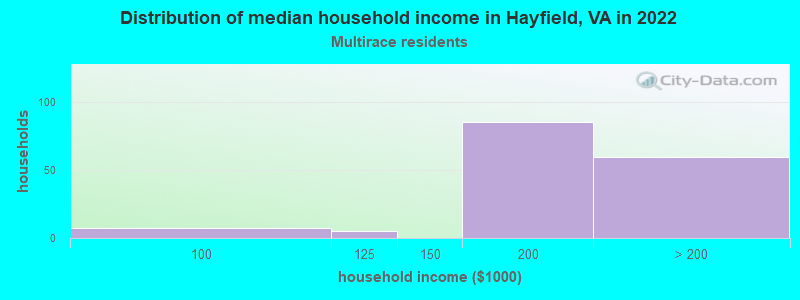
Income statistics for Multirace residents
Median household income in Hayfield, VA in 2022:
Hayfield:
$187,925
State:
$90,841
Number of households with income < $10k:
Hayfield:
0.0% (0)
State:
4.1% (9,125)
Number of households with income $10k - 20k:
Hayfield:
0.0% (0)
State:
5.9% (12,969)
Number of households with income $20k - 30k:
Hayfield:
0.0% (0)
State:
4.8% (10,563)
Number of households with income $30k - 40k:
Hayfield:
0.0% (0)
State:
6.6% (14,553)
Number of households with income $40k - 50k:
Hayfield:
0.0% (0)
State:
5.2% (11,391)
Number of households with income $50k - 60k:
Hayfield:
0.0% (0)
State:
6.8% (14,994)
Number of households with income $60k - 75k:
Hayfield:
0.0% (0)
Virginia:
8.8% (19,323)
Number of households with income $75k - 100k:
Hayfield:
4.5% (7)
State:
12.1% (26,729)
Number of households with income $100k - 125k:
Hayfield:
3.2% (5)
State:
10.4% (22,807)
Number of households with income $125k - 150k:
Hayfield:
0.0% (0)
Virginia:
8.1% (17,881)
Number of households with income $150k - 200k:
Hayfield:
54.5% (85)
State:
10.4% (22,979)
Number of households with income > $200k:
Hayfield:
37.8% (59)
Virginia:
16.7% (36,748)
Aggregate household income in Hayfield in 2022: $37,097,103
Median family income in Hayfield in 2022:
Hayfield:
$188,473
State:
$103,849
Number of families with income $40k - 50k:
Hayfield:
3.8% (6)
Virginia:
4.9% (7,426)
Number of families with income $100k - 125k:
Hayfield:
3.4% (5)
State:
10.6% (16,045)
Number of families with income $150k - 200k:
Hayfield:
57.5% (93)
State:
11.7% (17,769)
Number of families with income > $200k:
Hayfield:
35.2% (57)
State:
20.4% (30,866)
Median per capita income in Hayfield in 2022:
Hayfield:
$58,926
Virginia:
$34,385
Income statistics for other residents
Number of households with income < $10k:
Hayfield:
0.0% (0)
State:
5.1% (5,333)
Number of households with income $10k - 20k:
Hayfield:
0.0% (0)
State:
4.3% (4,478)
Number of households with income $20k - 30k:
Hayfield:
0.0% (0)
State:
7.3% (7,629)
Number of households with income $30k - 40k:
Hayfield:
0.0% (0)
Virginia:
7.8% (8,201)
Number of households with income $40k - 50k:
Hayfield:
0.0% (0)
State:
10.1% (10,533)
Number of households with income $50k - 60k:
Hayfield:
100.0% (26)
State:
5.4% (5,653)
Number of households with income $60k - 75k:
Hayfield:
0.0% (0)
State:
10.2% (10,650)
Number of households with income $75k - 100k:
Hayfield:
0.0% (0)
Virginia:
12.9% (13,493)
Number of households with income $100k - 125k:
Hayfield:
0.0% (0)
State:
9.7% (10,131)
Number of households with income $125k - 150k:
Hayfield:
0.0% (0)
State:
8.2% (8,624)
Number of households with income $150k - 200k:
Hayfield:
0.0% (0)
State:
8.2% (8,609)
Number of households with income > $200k:
Hayfield:
0.0% (0)
Virginia:
10.8% (11,336)
Aggregate household income in Hayfield in 2022: $6,328,835
Median per capita income in Hayfield in 2022:
Hayfield:
$24,107
State:
$29,023
Change in median per capita income between 2000 and 2022:
Hayfield, Virginia:
+64.8%
State:
+110.3%
Discuss Hayfield, Virginia (VA) on our hugely popular Virginia forum.