The median household income in Hinesburg, VT in 2022 was $91,500, which was 19.1% greater than the median annual income of $73,991 across the entire state of Vermont. Compared to the median income of $49,788 in 2000 this represents an increase of 45.6%. The per capita income in 2022 was $43,517, which means an increase of 48.9% compared to 2000 when it was $22,230.
Income statistics for all residents
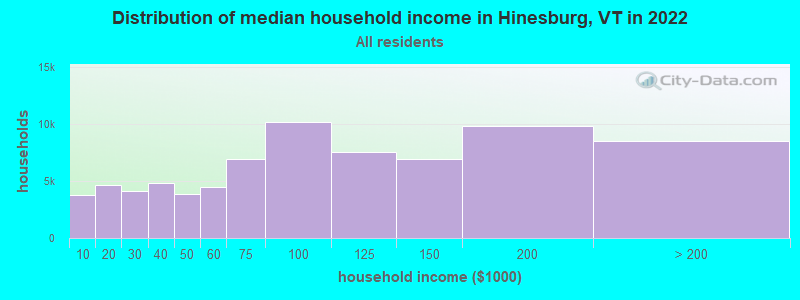
Median household income in Hinesburg, VT in 2022:
Hinesburg:
$91,501
State:
$73,991
Change in median household income between 2000 and 2022:
Hinesburg, Vermont:
+83.8%
Vermont:
+81.1%
Number of households with income < $10k:
Hinesburg:
5.0% (3,732)
State:
4.0% (11,050)
Number of households with income $10k - 20k:
Hinesburg:
6.1% (4,619)
State:
6.8% (18,853)
Number of households with income $20k - 30k:
Hinesburg:
5.5% (4,144)
State:
7.5% (20,673)
Number of households with income $30k - 40k:
Hinesburg:
6.4% (4,784)
State:
7.8% (21,750)
Number of households with income $40k - 50k:
Hinesburg:
5.1% (3,872)
State:
7.4% (20,642)
Number of households with income $50k - 60k:
Hinesburg:
5.9% (4,480)
State:
7.2% (19,901)
Number of households with income $60k - 75k:
Hinesburg:
9.2% (6,935)
Vermont:
9.9% (27,351)
Number of households with income $75k - 100k:
Hinesburg:
13.5% (10,149)
State:
13.8% (38,275)
Number of households with income $100k - 125k:
Hinesburg:
10.0% (7,495)
State:
9.6% (26,632)
Number of households with income $125k - 150k:
Hinesburg:
9.1% (6,873)
State:
7.5% (20,857)
Number of households with income $150k - 200k:
Hinesburg:
13.0% (9,759)
State:
9.9% (27,469)
Number of households with income > $200k:
Hinesburg:
11.2% (8,464)
State:
8.5% (23,637)
Aggregate household income in Hinesburg in 2022: $354,724,654
Median family income in Hinesburg in 2022:
Hinesburg:
$111,984
Vermont:
$96,345
Median non-family income in Hinesburg in 2022:
Hinesburg:
$61,784
State:
$46,022
Change in median non-family income between 2000 and 2022:
Hinesburg, Vermont:
+77.9%
Vermont:
+87.4%
Median per capita income in Hinesburg in 2022:
Hinesburg:
$43,518
Vermont:
$42,251
Change in median per capita income between 2000 and 2022:
Hinesburg, Vermont:
+95.8%
State:
+104.9%
Income statistics for White residents
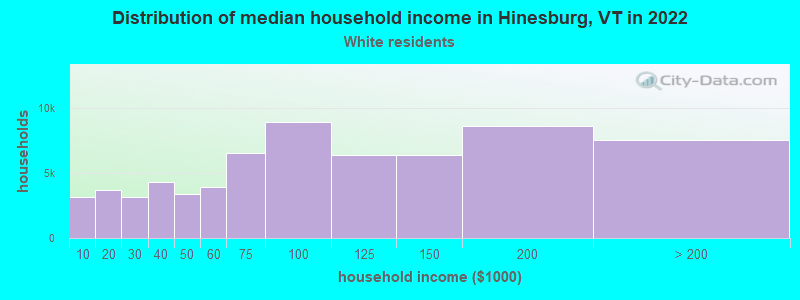
Median household income in Hinesburg, VT in 2022:
Hinesburg:
$90,887
Vermont:
$73,591
Change in median household income between 2000 and 2022:
Hinesburg, Vermont:
+82.8%
State:
+79.2%
Number of households with income < $10k:
Hinesburg:
4.8% (3,193)
State:
3.7% (9,508)
Number of households with income $10k - 20k:
Hinesburg:
5.6% (3,675)
State:
6.7% (17,064)
Number of households with income $20k - 30k:
Hinesburg:
4.8% (3,174)
State:
7.2% (18,552)
Number of households with income $30k - 40k:
Hinesburg:
6.5% (4,320)
State:
8.2% (20,886)
Number of households with income $40k - 50k:
Hinesburg:
5.1% (3,372)
State:
7.5% (19,216)
Number of households with income $50k - 60k:
Hinesburg:
5.9% (3,902)
State:
7.4% (18,898)
Number of households with income $60k - 75k:
Hinesburg:
9.9% (6,539)
State:
10.1% (25,944)
Number of households with income $75k - 100k:
Hinesburg:
13.5% (8,927)
State:
13.7% (34,991)
Number of households with income $100k - 125k:
Hinesburg:
9.7% (6,392)
Vermont:
9.5% (24,409)
Number of households with income $125k - 150k:
Hinesburg:
9.7% (6,377)
State:
7.7% (19,710)
Number of households with income $150k - 200k:
Hinesburg:
13.1% (8,624)
State:
9.7% (24,802)
Number of households with income > $200k:
Hinesburg:
11.5% (7,570)
State:
8.6% (21,983)
Aggregate household income in Hinesburg in 2022: $308,423,142
Median family income in Hinesburg in 2022:
Hinesburg:
$110,904
State:
$96,147
Number of families with income < $10k:
Hinesburg:
1.2% (11)
State:
1.8% (2,669)
Number of families with income $10k - 20k:
Hinesburg:
0.6% (6)
State:
3.1% (4,686)
Number of families with income $20k - 30k:
Hinesburg:
5.8% (54)
State:
4.1% (6,266)
Number of families with income $30k - 40k:
Hinesburg:
3.8% (35)
State:
6.1% (9,273)
Number of families with income $40k - 50k:
Hinesburg:
8.3% (78)
State:
6.4% (9,714)
Number of families with income $50k - 60k:
Hinesburg:
4.6% (43)
State:
6.1% (9,310)
Number of families with income $60k - 75k:
Hinesburg:
7.2% (67)
State:
9.3% (14,175)
Number of families with income $75k - 100k:
Hinesburg:
22.0% (206)
State:
15.5% (23,673)
Number of families with income $100k - 125k:
Hinesburg:
12.0% (112)
State:
12.7% (19,323)
Number of families with income $125k - 150k:
Hinesburg:
4.4% (41)
State:
9.7% (14,805)
Number of families with income $150k - 200k:
Hinesburg:
14.5% (135)
Vermont:
13.1% (20,018)
Number of families with income > $200k:
Hinesburg:
15.7% (147)
State:
12.1% (18,463)
Median non-family income in Hinesburg in 2022:
Hinesburg:
$61,991
State:
$45,952
Change in median non-family income between 2000 and 2022:
Hinesburg, Vermont:
+82.7%
State:
+86.1%
Median per capita income in Hinesburg in 2022:
Hinesburg:
$44,529
State:
$43,031
Change in median per capita income between 2000 and 2022:
Hinesburg, Vermont:
+99.8%
State:
+106.0%
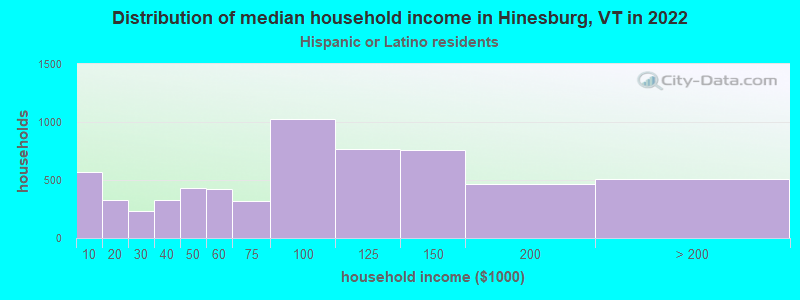
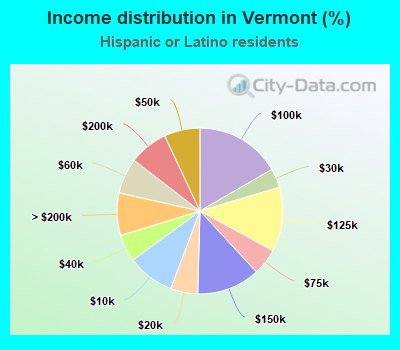
Income statistics for Hispanic or Latino residents
Median household income in Hinesburg, VT in 2022:
Hinesburg:
$123,897
State:
$90,490
Number of households with income < $10k:
Hinesburg:
9.2% (565)
State:
9.2% (500)
Number of households with income $10k - 20k:
Hinesburg:
5.3% (325)
State:
5.3% (288)
Number of households with income $20k - 30k:
Hinesburg:
3.7% (229)
State:
3.7% (203)
Number of households with income $30k - 40k:
Hinesburg:
5.3% (325)
Vermont:
5.3% (288)
Number of households with income $40k - 50k:
Hinesburg:
7.0% (428)
State:
7.0% (379)
Number of households with income $50k - 60k:
Hinesburg:
6.9% (425)
State:
6.9% (376)
Number of households with income $60k - 75k:
Hinesburg:
5.2% (319)
State:
5.2% (282)
Number of households with income $75k - 100k:
Hinesburg:
16.7% (1,022)
Vermont:
16.7% (905)
Number of households with income $100k - 125k:
Hinesburg:
12.5% (770)
State:
12.6% (682)
Number of households with income $125k - 150k:
Hinesburg:
12.3% (756)
State:
12.3% (669)
Number of households with income $150k - 200k:
Hinesburg:
7.6% (465)
State:
7.6% (412)
Number of households with income > $200k:
Hinesburg:
8.3% (508)
Vermont:
8.3% (450)
Aggregate household income in Hinesburg in 2022: $2,206,935
Median family income in Hinesburg in 2022:
Hinesburg:
$102,088
State:
$116,955
Number of families with income < $10k:
Hinesburg:
6.7% (2)
Vermont:
12.9% (469)
Number of families with income $10k - 20k:
Hinesburg:
2.4% (1)
State:
6.0% (219)
Number of families with income $20k - 30k:
Hinesburg:
0.6% (0)
State:
0.7% (26)
Number of families with income $30k - 40k:
Hinesburg:
3.5% (1)
State:
4.8% (176)
Number of families with income $40k - 50k:
Hinesburg:
4.9% (1)
State:
3.3% (119)
Number of families with income $50k - 60k:
Hinesburg:
1.0% (0)
Vermont:
0.8% (29)
Number of families with income $60k - 75k:
Hinesburg:
5.5% (1)
State:
6.5% (236)
Number of families with income $75k - 100k:
Hinesburg:
17.4% (4)
State:
9.0% (326)
Number of families with income $100k - 125k:
Hinesburg:
22.6% (6)
Vermont:
16.6% (604)
Number of families with income $125k - 150k:
Hinesburg:
8.0% (2)
Vermont:
15.7% (572)
Number of families with income $150k - 200k:
Hinesburg:
13.6% (3)
Vermont:
11.3% (412)
Number of families with income > $200k:
Hinesburg:
13.8% (3)
State:
12.4% (450)
Median per capita income in Hinesburg in 2022:
Hinesburg:
$21,426
State:
$36,311
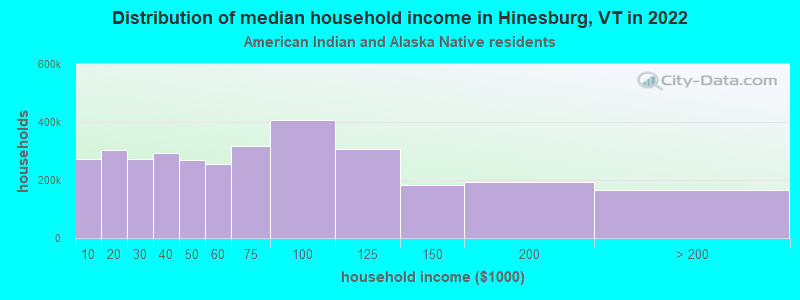
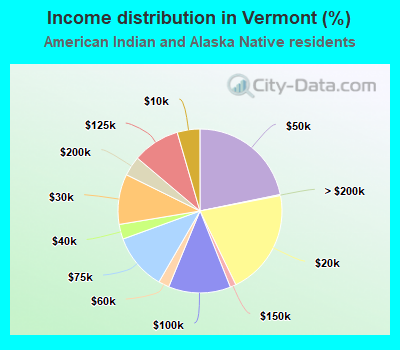
Income statistics for American Indian and Alaska Native residents
Number of households with income < $10k:
Hinesburg:
8.4% (113)
Vermont:
4.5% (23)
Number of households with income $10k - 20k:
Hinesburg:
9.4% (126)
State:
20.8% (107)
Number of households with income $20k - 30k:
Hinesburg:
8.5% (114)
Vermont:
9.9% (51)
Number of households with income $30k - 40k:
Hinesburg:
9.1% (122)
State:
2.9% (15)
Number of households with income $40k - 50k:
Hinesburg:
8.3% (112)
Vermont:
21.8% (112)
Number of households with income $50k - 60k:
Hinesburg:
7.9% (106)
State:
2.1% (11)
Number of households with income $60k - 75k:
Hinesburg:
9.8% (132)
State:
11.1% (57)
Number of households with income $75k - 100k:
Hinesburg:
12.6% (170)
State:
12.3% (63)
Number of households with income $100k - 125k:
Hinesburg:
9.4% (127)
State:
9.3% (48)
Number of households with income $125k - 150k:
Hinesburg:
5.6% (76)
State:
1.2% (6)
Number of households with income $150k - 200k:
Hinesburg:
5.9% (80)
State:
3.9% (20)
Number of households with income > $200k:
Hinesburg:
5.1% (69)
State:
0.2% (1)
Aggregate household income in Hinesburg in 2022: $1,760,298
Median per capita income in Hinesburg in 2022:
Hinesburg:
$46,627
Vermont:
$19,747
Change in median per capita income between 2000 and 2022:
Hinesburg, Vermont:
+13.8%
State:
+41.4%
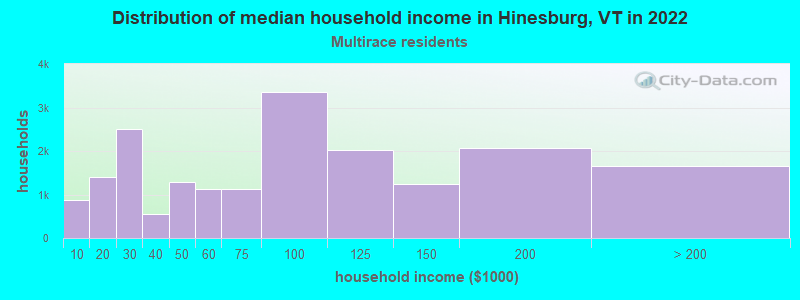
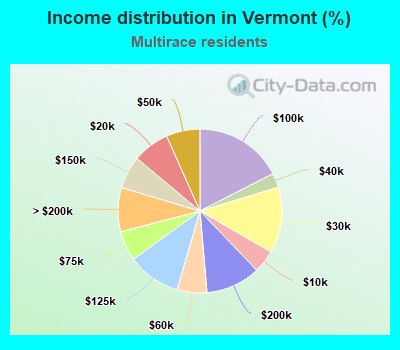
Income statistics for Multirace residents
Median household income in Hinesburg, VT in 2022:
Hinesburg:
$103,904
State:
$81,819
Change in median household income between 2000 and 2022:
Hinesburg, Vermont:
+137.5%
State:
+164.1%
Number of households with income < $10k:
Hinesburg:
4.5% (866)
State:
4.5% (613)
Number of households with income $10k - 20k:
Hinesburg:
7.3% (1,396)
State:
7.3% (988)
Number of households with income $20k - 30k:
Hinesburg:
13.0% (2,499)
State:
13.0% (1,770)
Number of households with income $30k - 40k:
Hinesburg:
2.8% (545)
State:
2.8% (386)
Number of households with income $40k - 50k:
Hinesburg:
6.7% (1,276)
State:
6.7% (904)
Number of households with income $50k - 60k:
Hinesburg:
5.9% (1,125)
State:
5.9% (797)
Number of households with income $60k - 75k:
Hinesburg:
5.9% (1,135)
State:
5.9% (804)
Number of households with income $75k - 100k:
Hinesburg:
17.5% (3,355)
State:
17.5% (2,376)
Number of households with income $100k - 125k:
Hinesburg:
10.5% (2,015)
State:
10.5% (1,427)
Number of households with income $125k - 150k:
Hinesburg:
6.5% (1,238)
Vermont:
6.5% (877)
Number of households with income $150k - 200k:
Hinesburg:
10.8% (2,071)
Vermont:
10.8% (1,467)
Number of households with income > $200k:
Hinesburg:
8.7% (1,666)
State:
8.7% (1,180)
Aggregate household income in Hinesburg in 2022: $4,925,845
Median family income in Hinesburg in 2022:
Hinesburg:
$102,926
Vermont:
$98,198
Median per capita income in Hinesburg in 2022:
Hinesburg:
$21,167
State:
$34,567
Change in median per capita income between 2000 and 2022:
Hinesburg, Vermont:
+118.1%
Vermont:
+177.8%
Income statistics for other residents
Number of households with income < $10k:
Hinesburg:
6.2% (484,952)
State:
4.4% (48)
Number of households with income $10k - 20k:
Hinesburg:
7.3% (572,116)
State:
6.4% (69)
Number of households with income $20k - 30k:
Hinesburg:
8.2% (646,731)
State:
2.7% (29)
Number of households with income $30k - 40k:
Hinesburg:
9.1% (713,403)
State:
13.6% (147)
Number of households with income $40k - 50k:
Hinesburg:
8.6% (678,224)
State:
13.4% (145)
Number of households with income $50k - 60k:
Hinesburg:
8.0% (631,229)
State:
7.8% (84)
Number of households with income $60k - 75k:
Hinesburg:
10.8% (848,218)
State:
13.7% (148)
Number of households with income $75k - 100k:
Hinesburg:
14.0% (1,103,193)
Vermont:
8.1% (87)
Number of households with income $100k - 125k:
Hinesburg:
9.4% (739,062)
State:
8.4% (91)
Number of households with income $125k - 150k:
Hinesburg:
6.1% (477,051)
State:
6.1% (66)
Number of households with income $150k - 200k:
Hinesburg:
6.9% (541,180)
State:
10.7% (116)
Number of households with income > $200k:
Hinesburg:
5.6% (444,835)
State:
4.6% (50)
Median per capita income in Hinesburg in 2022:
Hinesburg:
$36,752
State:
$36,770
Discuss Hinesburg, Vermont (VT) on our hugely popular Vermont forum.