Hyden, Kentucky (KY) income map, earnings map, and wages data

Data:
The per capita income in 2022 was $29,626, which means an increase of 52.9% compared to 2000 when it was $13,966.
Whole page based on the data from 2000 / 2022 when the population of Hyden, Kentucky was 204 / 548
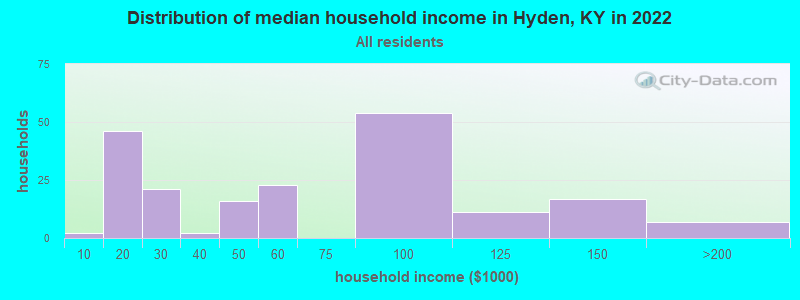
Income statistics for all residents
Number of households with income < $10k:| Hyden: | 1.0% (2) |
| Kentucky: | 6.8% (123,697) |
Number of households with income $10k - 20k:| Hyden: | 23.1% (46) |
| State: | 10.0% (182,645) |
Number of households with income $20k - 30k:| Hyden: | 10.6% (21) |
| State: | 9.0% (164,092) |
Number of households with income $30k - 40k:| Hyden: | 1.0% (2) |
| State: | 9.1% (165,607) |
Number of households with income $40k - 50k:| Hyden: | 8.0% (16) |
| State: | 8.0% (146,315) |
Number of households with income $50k - 60k:| Hyden: | 11.6% (23) |
| Kentucky: | 7.7% (140,671) |
Number of households with income $60k - 75k:| Hyden: | 0.0% (0) |
| Kentucky: | 9.8% (180,002) |
Number of households with income $75k - 100k:| Hyden: | 27.1% (54) |
| State: | 12.6% (230,239) |
Number of households with income $100k - 125k:| Hyden: | 5.5% (11) |
| Kentucky: | 9.0% (164,398) |
Number of households with income $125k - 150k:| Hyden: | 8.5% (17) |
| State: | 5.9% (108,602) |
Number of households with income $150k - 200k:| Hyden: | 3.5% (7) |
| Kentucky: | 6.2% (112,813) |
Number of households with income > $200k:| Hyden: | 0.0% (0) |
| Kentucky: | 6.0% (109,599) |
Aggregate household income in Hyden in 2022: $12,820,758
Median family income in Hyden in 2022:| Hyden: | $52,020 |
| State: | $76,119 |
Number of families with income $10k - 20k:| Hyden: | 4.4% (4) |
| Kentucky: | 5.4% (62,899) |
Number of families with income $20k - 30k:| Hyden: | 17.8% (16) |
| Kentucky: | 6.5% (76,765) |
Number of families with income $40k - 50k:| Hyden: | 17.1% (16) |
| Kentucky: | 7.1% (83,575) |
Number of families with income $50k - 60k:| Hyden: | 19.9% (18) |
| Kentucky: | 7.4% (86,258) |
Number of families with income $60k - 75k:| Hyden: | 6.8% (6) |
| Kentucky: | 10.3% (121,229) |
Number of families with income $75k - 100k:| Hyden: | 11.3% (10) |
| Kentucky: | 14.7% (172,722) |
Number of families with income $100k - 125k:| Hyden: | 2.3% (2) |
| State: | 11.5% (134,935) |
Number of families with income $125k - 150k:| Hyden: | 12.6% (11) |
| State: | 7.9% (93,107) |
Number of families with income $150k - 200k:| Hyden: | 7.8% (7) |
| State: | 8.4% (98,984) |
Median income for 2 person families:| Hyden: | $69,970 |
| State: | $67,141 |
Median per capita income in Hyden in 2022:| Hyden: | $29,626 |
| State: | $33,980 |
Change in median per capita income between 2000 and 2022:| Hyden, Kentucky: | +112.1% |
| State: | +87.8% |
Income statistics for White residents
Number of households with income < $10k:| Hyden: | 1.1% (2) |
| State: | 6.2% (96,690) |
Number of households with income $10k - 20k:| Hyden: | 24.1% (45) |
| Kentucky: | 9.7% (151,125) |
Number of households with income $20k - 30k:| Hyden: | 11.2% (21) |
| State: | 8.9% (139,532) |
Number of households with income $30k - 40k:| Hyden: | 1.1% (2) |
| State: | 9.1% (142,284) |
Number of households with income $40k - 50k:| Hyden: | 8.0% (15) |
| State: | 7.7% (121,151) |
Number of households with income $50k - 60k:| Hyden: | 12.3% (23) |
| State: | 7.7% (119,790) |
Number of households with income $60k - 75k:| Hyden: | 0.0% (0) |
| State: | 9.9% (154,174) |
Number of households with income $75k - 100k:| Hyden: | 27.3% (51) |
| State: | 12.8% (199,740) |
Number of households with income $100k - 125k:| Hyden: | 5.9% (11) |
| State: | 9.4% (146,284) |
Number of households with income $125k - 150k:| Hyden: | 9.1% (17) |
| State: | 6.0% (94,180) |
Number of households with income $150k - 200k:| Hyden: | 0.0% (0) |
| Kentucky: | 6.4% (100,702) |
Number of households with income > $200k:| Hyden: | 0.0% (0) |
| State: | 6.3% (98,502) |
Aggregate household income in Hyden in 2022: $11,300,277
Median family income in Hyden in 2022:| Hyden: | $51,101 |
| State: | $78,353 |
Number of families with income $10k - 20k:| Hyden: | 4.7% (4) |
| Kentucky: | 4.9% (49,864) |
Number of families with income $20k - 30k:| Hyden: | 20.1% (17) |
| State: | 6.4% (64,043) |
Number of families with income $40k - 50k:| Hyden: | 18.6% (15) |
| Kentucky: | 6.9% (69,099) |
Number of families with income $50k - 60k:| Hyden: | 21.3% (18) |
| State: | 7.2% (72,955) |
Number of families with income $60k - 75k:| Hyden: | 7.3% (6) |
| Kentucky: | 10.4% (104,587) |
Number of families with income $75k - 100k:| Hyden: | 12.3% (10) |
| State: | 15.0% (151,545) |
Number of families with income $100k - 125k:| Hyden: | 2.5% (2) |
| State: | 11.9% (120,340) |
Number of families with income $125k - 150k:| Hyden: | 13.4% (11) |
| State: | 8.1% (81,620) |
Median per capita income in Hyden in 2022:| Hyden: | $29,918 |
| Kentucky: | $35,352 |
Change in median per capita income between 2000 and 2022:| Hyden, Kentucky: | +122.0% |
| State: | +90.2% |
Income statistics for Asian residents
Aggregate household income in Hyden in 2022: $5,619,933
Median per capita income in Hyden in 2022:| Hyden: | $73,804 |
| State: | $42,939 |
Income statistics for Multirace residents
Median per capita income in Hyden in 2022:| Hyden: | $38,635 |
| State: | $25,670 |
Change in median per capita income between 2000 and 2022:| Hyden, Kentucky: | +131.8% |
| Kentucky: | +132.3% |