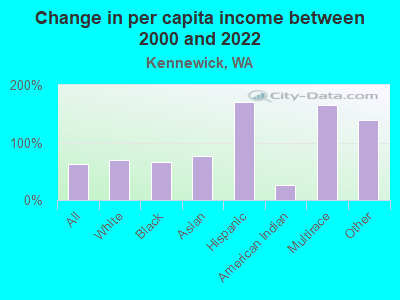
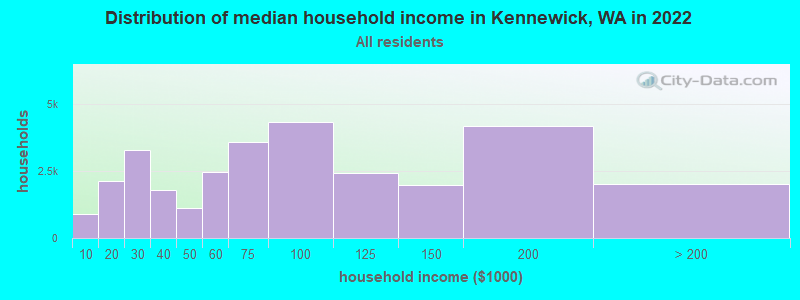
The median household income in Kennewick, WA in 2022 was $73,800, which was 23.7% less than the median annual income of $91,306 across the entire state of Washington. Compared to the median income of $41,213 in 2000 this represents an increase of 44.2%. The per capita income in 2022 was $32,864, which means an increase of 38.7% compared to 2000 when it was $20,152.
Whole page based on the data from 2000 / 2022 when the population of Kennewick, Washington was 54,693 / 84,757
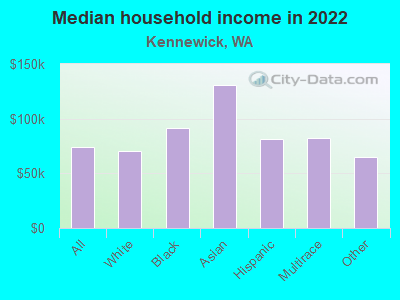
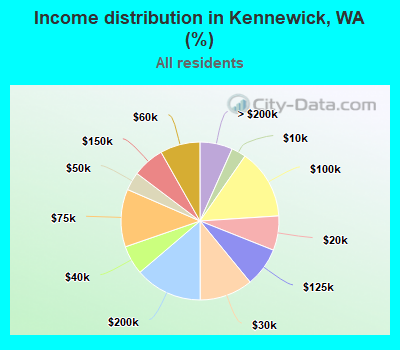
Income statistics for all residents
Median household income in Kennewick, WA in 2022:
Kennewick:
$73,800
State:
$91,306
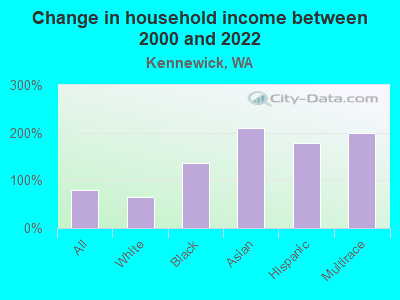
Change in median household income between 2000 and 2022:
Kennewick, Washington:
+79.1%
State:
+99.5%
Number of households with income < $10k:
Kennewick:
3.0% (900)
State:
4.5% (139,331)
Number of households with income $10k - 20k:
Kennewick:
7.0% (2,128)
State:
5.0% (154,508)
Number of households with income $20k - 30k:
Kennewick:
10.9% (3,296)
State:
5.4% (166,555)
Number of households with income $30k - 40k:
Kennewick:
5.9% (1,797)
State:
5.5% (170,324)
Number of households with income $40k - 50k:
Kennewick:
3.8% (1,135)
State:
6.0% (183,941)
Number of households with income $50k - 60k:
Kennewick:
8.2% (2,471)
State:
6.1% (187,395)
Number of households with income $60k - 75k:
Kennewick:
11.8% (3,571)
State:
8.7% (266,771)
Number of households with income $75k - 100k:
Kennewick:
14.3% (4,328)
Washington:
13.1% (404,672)
Number of households with income $100k - 125k:
Kennewick:
8.0% (2,428)
State:
11.0% (337,911)
Number of households with income $125k - 150k:
Kennewick:
6.5% (1,975)
State:
8.0% (244,934)
Number of households with income $150k - 200k:
Kennewick:
13.8% (4,163)
State:
10.5% (323,812)
Number of households with income > $200k:
Kennewick:
6.7% (2,018)
State:
16.2% (499,799)
Aggregate household income in Kennewick in 2022: $2,715,210,000
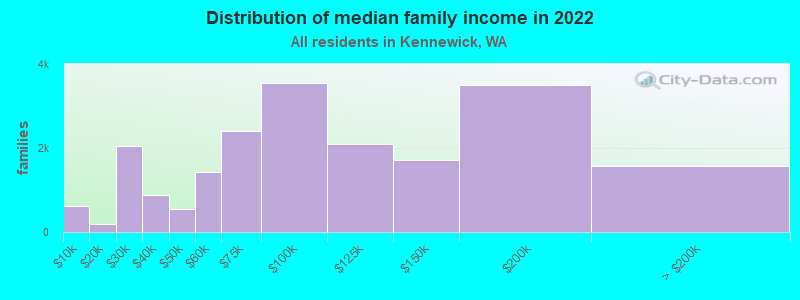
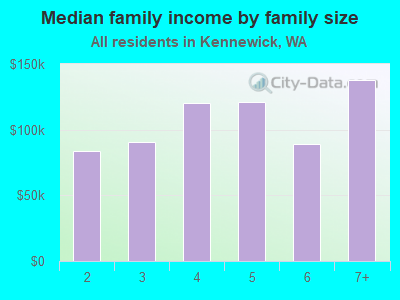
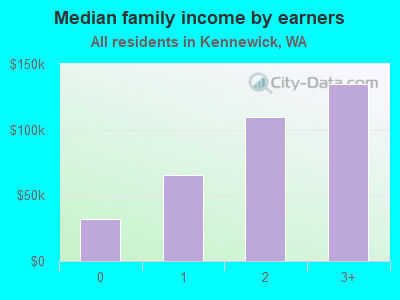
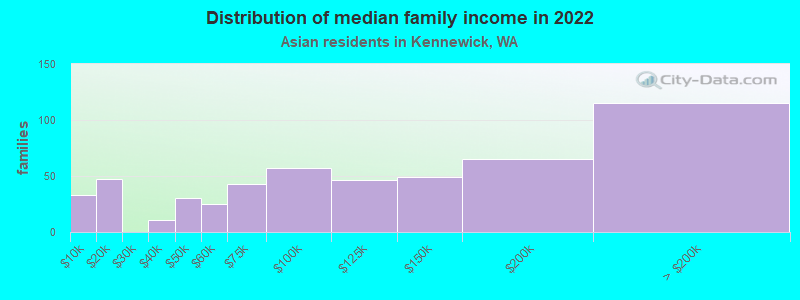
Median family income in Kennewick in 2022:
Kennewick:
$91,611
Washington:
$109,192
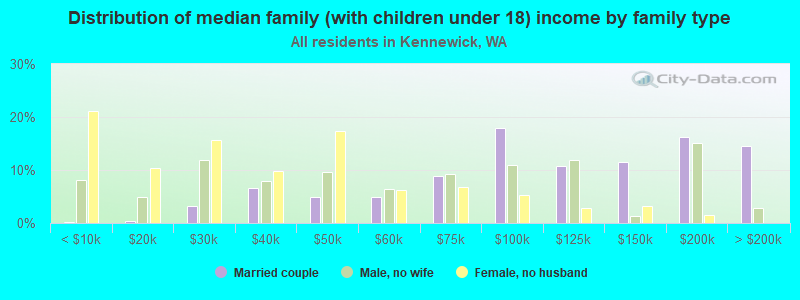
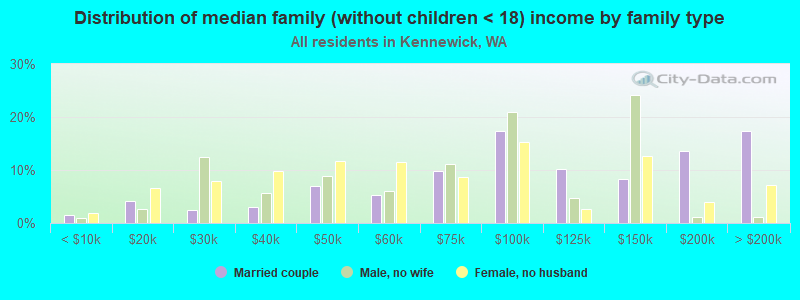
Number of families with income < $10k:
Kennewick:
3.0% (612)
State:
2.9% (55,953)
Number of families with income $10k - 20k:
Kennewick:
0.9% (195)
State:
2.6% (50,138)
Number of families with income $20k - 30k:
Kennewick:
10.0% (2,054)
State:
3.2% (61,974)
Number of families with income $30k - 40k:
Kennewick:
4.3% (882)
State:
4.1% (80,240)
Number of families with income $40k - 50k:
Kennewick:
2.7% (558)
Washington:
4.9% (94,310)
Number of families with income $50k - 60k:
Kennewick:
7.0% (1,434)
State:
5.3% (101,674)
Number of families with income $60k - 75k:
Kennewick:
11.6% (2,395)
State:
8.2% (158,348)
Number of families with income $75k - 100k:
Kennewick:
17.3% (3,555)
State:
13.8% (267,812)
Number of families with income $100k - 125k:
Kennewick:
10.2% (2,102)
State:
12.4% (240,213)
Number of families with income $125k - 150k:
Kennewick:
8.4% (1,722)
Washington:
9.3% (180,011)
Number of families with income $150k - 200k:
Kennewick:
17.0% (3,507)
Washington:
13.0% (250,874)
Number of families with income > $200k:
Kennewick:
7.6% (1,568)
State:
20.4% (393,898)
Median non-family income in Kennewick in 2022:
Kennewick:
$40,326
State:
$57,299
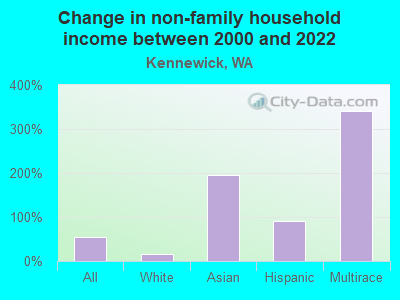
Change in median non-family income between 2000 and 2022:
Kennewick, Washington:
+53.8%
State:
+94.9%
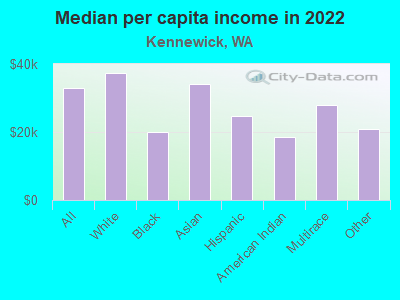
Median per capita income in Kennewick in 2022:
Kennewick:
$32,864
State:
$50,764
Change in median per capita income between 2000 and 2022:
Kennewick, Washington:
+63.1%
Washington:
+121.0%
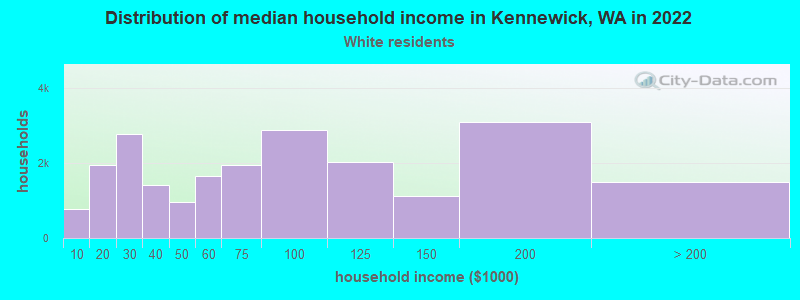
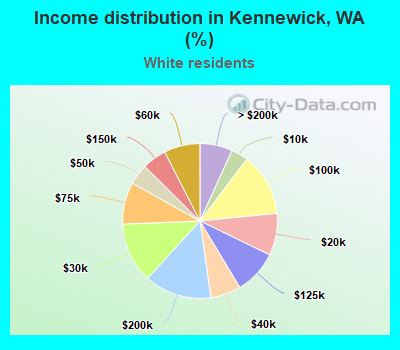
Income statistics for White residents
Median household income in Kennewick, WA in 2022:
Kennewick:
$70,307
State:
$91,916
Change in median household income between 2000 and 2022:
Kennewick, Washington:
+63.8%
Washington:
+95.4%
Number of households with income < $10k:
Kennewick:
3.5% (782)
State:
4.3% (95,850)
Number of households with income $10k - 20k:
Kennewick:
8.8% (1,934)
State:
4.8% (106,421)
Number of households with income $20k - 30k:
Kennewick:
12.6% (2,771)
State:
5.5% (122,860)
Number of households with income $30k - 40k:
Kennewick:
6.3% (1,400)
State:
5.4% (119,627)
Number of households with income $40k - 50k:
Kennewick:
4.3% (948)
State:
5.9% (132,276)
Number of households with income $50k - 60k:
Kennewick:
7.5% (1,655)
Washington:
6.1% (136,212)
Number of households with income $60k - 75k:
Kennewick:
8.8% (1,935)
State:
8.8% (196,086)
Number of households with income $75k - 100k:
Kennewick:
13.1% (2,891)
State:
13.4% (299,192)
Number of households with income $100k - 125k:
Kennewick:
9.2% (2,026)
State:
11.3% (252,209)
Number of households with income $125k - 150k:
Kennewick:
5.1% (1,118)
Washington:
7.9% (175,962)
Number of households with income $150k - 200k:
Kennewick:
14.0% (3,092)
Washington:
10.7% (239,156)
Number of households with income > $200k:
Kennewick:
6.8% (1,496)
Washington:
16.1% (359,917)
Aggregate household income in Kennewick in 2022: $1,944,247,800
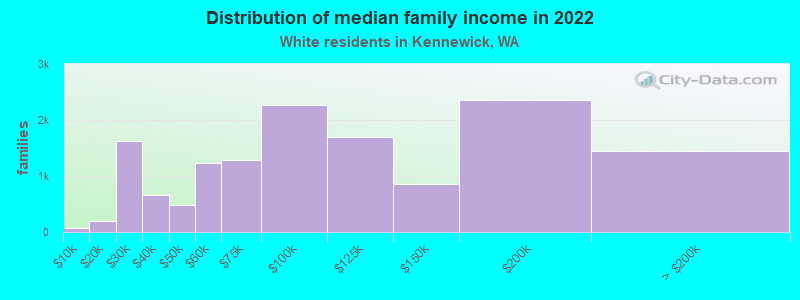
Median family income in Kennewick in 2022:
Kennewick:
$92,231
State:
$112,511
Number of families with income < $10k:
Kennewick:
0.5% (74)
Washington:
2.4% (33,676)
Number of families with income $10k - 20k:
Kennewick:
1.4% (195)
State:
2.0% (28,228)
Number of families with income $20k - 30k:
Kennewick:
11.4% (1,623)
State:
2.9% (39,288)
Number of families with income $30k - 40k:
Kennewick:
4.7% (668)
State:
3.6% (50,190)
Number of families with income $40k - 50k:
Kennewick:
3.5% (491)
State:
4.6% (63,009)
Number of families with income $50k - 60k:
Kennewick:
8.7% (1,238)
Washington:
5.0% (69,270)
Number of families with income $60k - 75k:
Kennewick:
9.0% (1,282)
Washington:
8.2% (112,369)
Number of families with income $75k - 100k:
Kennewick:
16.0% (2,269)
State:
14.1% (194,214)
Number of families with income $100k - 125k:
Kennewick:
12.0% (1,705)
State:
13.2% (182,184)
Number of families with income $125k - 150k:
Kennewick:
6.0% (852)
State:
9.5% (130,928)
Number of families with income $150k - 200k:
Kennewick:
16.6% (2,362)
Washington:
13.7% (188,621)
Number of families with income > $200k:
Kennewick:
10.1% (1,439)
State:
20.8% (285,982)
Median non-family income in Kennewick in 2022:
Kennewick:
$31,234
State:
$56,103
Change in median non-family income between 2000 and 2022:
Kennewick, Washington:
+15.2%
State:
+87.7%
Median per capita income in Kennewick in 2022:
Kennewick:
$37,449
Washington:
$55,212
Change in median per capita income between 2000 and 2022:
Kennewick, Washington:
+69.8%
Washington:
+123.8%
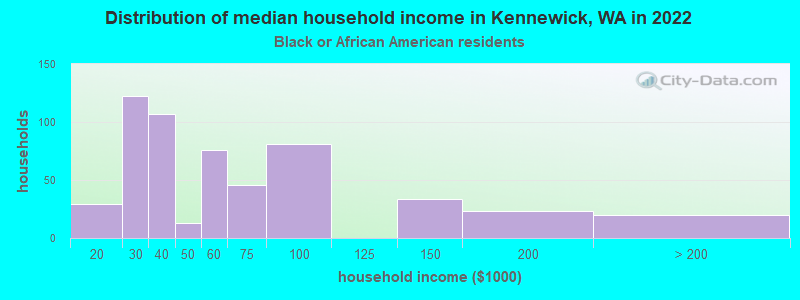
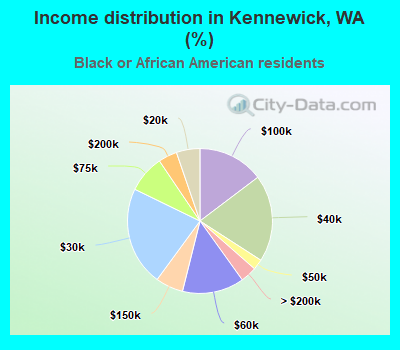
Income statistics for Black or African American residents
Median household income in Kennewick, WA in 2022:
Kennewick:
$91,110
State:
$68,202
Change in median household income between 2000 and 2022:
Kennewick, Washington:
+136.1%
State:
+89.9%
Number of households with income < $10k:
Kennewick:
0.0% (0)
State:
7.2% (8,014)
Number of households with income $10k - 20k:
Kennewick:
5.3% (29)
State:
8.0% (8,904)
Number of households with income $20k - 30k:
Kennewick:
22.1% (122)
Washington:
7.4% (8,207)
Number of households with income $30k - 40k:
Kennewick:
19.4% (107)
Washington:
5.6% (6,220)
Number of households with income $40k - 50k:
Kennewick:
2.4% (13)
State:
9.5% (10,585)
Number of households with income $50k - 60k:
Kennewick:
13.8% (76)
Washington:
7.3% (8,078)
Number of households with income $60k - 75k:
Kennewick:
8.3% (46)
State:
8.7% (9,704)
Number of households with income $75k - 100k:
Kennewick:
14.7% (81)
Washington:
12.9% (14,315)
Number of households with income $100k - 125k:
Kennewick:
0.0% (0)
State:
7.7% (8,592)
Number of households with income $125k - 150k:
Kennewick:
6.2% (34)
Washington:
8.9% (9,840)
Number of households with income $150k - 200k:
Kennewick:
4.2% (23)
Washington:
7.6% (8,434)
Number of households with income > $200k:
Kennewick:
3.6% (20)
Washington:
9.1% (10,075)
Aggregate household income in Kennewick in 2022: $43,744,300
Median per capita income in Kennewick in 2022:
Kennewick:
$20,051
State:
$38,209
Change in median per capita income between 2000 and 2022:
Kennewick, Washington:
+66.0%
State:
+115.3%
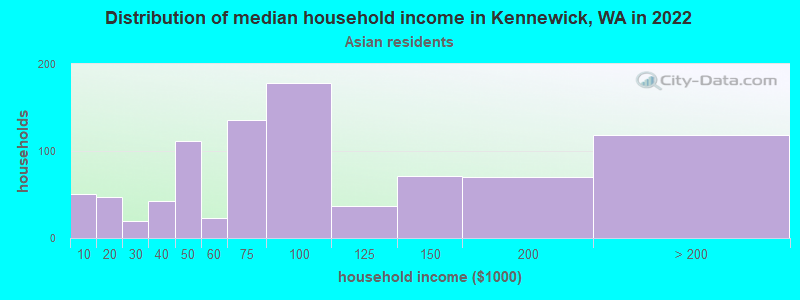
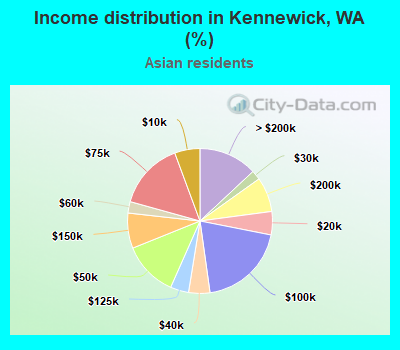
Income statistics for Asian residents
Median household income in Kennewick, WA in 2022:
Kennewick:
$130,545
State:
$125,692
Number of households with income < $10k:
Kennewick:
5.6% (51)
Washington:
4.9% (14,099)
Number of households with income $10k - 20k:
Kennewick:
5.2% (47)
State:
3.5% (9,873)
Number of households with income $20k - 30k:
Kennewick:
2.1% (19)
State:
2.9% (8,352)
Number of households with income $30k - 40k:
Kennewick:
4.8% (43)
Washington:
4.0% (11,415)
Number of households with income $40k - 50k:
Kennewick:
12.3% (111)
Washington:
4.0% (11,421)
Number of households with income $50k - 60k:
Kennewick:
2.5% (23)
State:
4.2% (12,100)
Number of households with income $60k - 75k:
Kennewick:
15.0% (136)
Washington:
6.3% (17,903)
Number of households with income $75k - 100k:
Kennewick:
19.7% (178)
State:
10.4% (29,663)
Number of households with income $100k - 125k:
Kennewick:
4.1% (37)
State:
9.4% (26,839)
Number of households with income $125k - 150k:
Kennewick:
7.9% (71)
Washington:
8.5% (24,200)
Number of households with income $150k - 200k:
Kennewick:
7.7% (70)
State:
12.6% (35,976)
Number of households with income > $200k:
Kennewick:
13.1% (118)
State:
29.2% (83,109)
Aggregate household income in Kennewick in 2022: $104,473,900
Median family income in Kennewick in 2022:
Kennewick:
$133,602
State:
$143,595
Number of families with income < $10k:
Kennewick:
6.4% (33)
Washington:
2.9% (5,479)
Number of families with income $10k - 20k:
Kennewick:
8.9% (47)
Washington:
2.2% (4,150)
Number of families with income $30k - 40k:
Kennewick:
2.1% (11)
Washington:
3.1% (5,734)
Number of families with income $40k - 50k:
Kennewick:
5.7% (30)
Washington:
3.6% (6,707)
Number of families with income $50k - 60k:
Kennewick:
4.8% (25)
State:
4.1% (7,663)
Number of families with income $60k - 75k:
Kennewick:
8.2% (43)
State:
5.1% (9,490)
Number of families with income $75k - 100k:
Kennewick:
10.9% (57)
Washington:
11.7% (21,919)
Number of families with income $100k - 125k:
Kennewick:
8.8% (46)
Washington:
9.3% (17,280)
Number of families with income $125k - 150k:
Kennewick:
9.5% (49)
State:
8.4% (15,602)
Number of families with income $150k - 200k:
Kennewick:
12.5% (65)
State:
13.3% (24,789)
Number of families with income > $200k:
Kennewick:
22.1% (115)
State:
34.4% (64,250)
Median non-family income in Kennewick in 2022:
Kennewick:
$68,097
State:
$84,971
Median per capita income in Kennewick in 2022:
Kennewick:
$34,088
State:
$67,666
Change in median per capita income between 2000 and 2022:
Kennewick, Washington:
+76.1%
Washington:
+236.0%
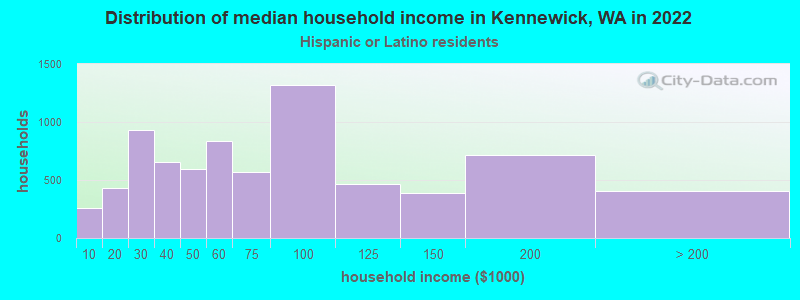
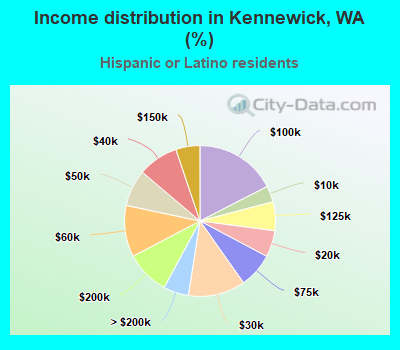
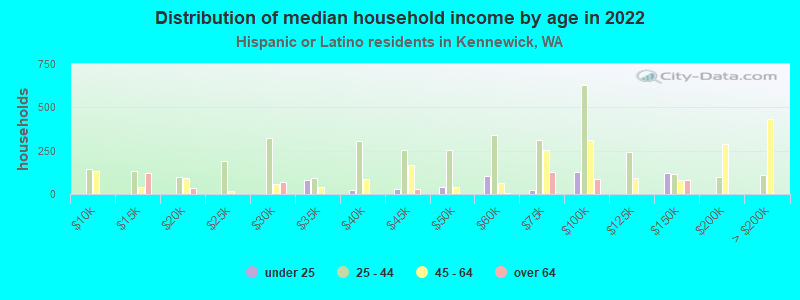
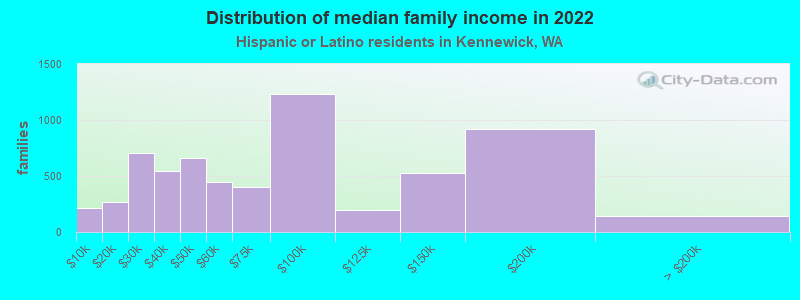
Income statistics for Hispanic or Latino residents
Median household income in Kennewick, WA in 2022:
Kennewick:
$81,000
Washington:
$74,770
Number of households with income < $10k:
Kennewick:
3.4% (261)
Washington:
4.9% (14,456)
Number of households with income $10k - 20k:
Kennewick:
5.7% (430)
State:
5.3% (15,449)
Number of households with income $20k - 30k:
Kennewick:
12.2% (928)
State:
6.8% (20,016)
Number of households with income $30k - 40k:
Kennewick:
8.6% (655)
State:
7.7% (22,548)
Number of households with income $40k - 50k:
Kennewick:
7.9% (595)
State:
7.3% (21,450)
Number of households with income $50k - 60k:
Kennewick:
11.0% (836)
State:
7.7% (22,744)
Number of households with income $60k - 75k:
Kennewick:
7.5% (566)
State:
10.5% (30,737)
Number of households with income $75k - 100k:
Kennewick:
17.5% (1,323)
Washington:
14.9% (43,843)
Number of households with income $100k - 125k:
Kennewick:
6.2% (468)
State:
11.1% (32,554)
Number of households with income $125k - 150k:
Kennewick:
5.2% (391)
Washington:
7.4% (21,624)
Number of households with income $150k - 200k:
Kennewick:
9.4% (714)
State:
7.3% (21,360)
Number of households with income > $200k:
Kennewick:
5.4% (409)
State:
9.2% (27,055)
Aggregate household income in Kennewick in 2022: $608,557,300
Median family income in Kennewick in 2022:
Kennewick:
$81,551
Washington:
$76,866
Number of families with income < $10k:
Kennewick:
3.4% (211)
Washington:
4.4% (9,443)
Number of families with income $10k - 20k:
Kennewick:
4.3% (268)
State:
3.5% (7,524)
Number of families with income $20k - 30k:
Kennewick:
11.3% (705)
State:
5.6% (12,052)
Number of families with income $30k - 40k:
Kennewick:
8.7% (546)
Washington:
8.3% (17,803)
Number of families with income $40k - 50k:
Kennewick:
10.6% (661)
State:
7.7% (16,361)
Number of families with income $50k - 60k:
Kennewick:
7.1% (444)
Washington:
7.9% (16,852)
Number of families with income $60k - 75k:
Kennewick:
6.5% (405)
State:
11.4% (24,342)
Number of families with income $75k - 100k:
Kennewick:
19.6% (1,228)
State:
14.4% (30,698)
Number of families with income $100k - 125k:
Kennewick:
3.1% (193)
State:
11.4% (24,331)
Number of families with income $125k - 150k:
Kennewick:
8.5% (531)
State:
7.5% (16,099)
Number of families with income $150k - 200k:
Kennewick:
14.8% (924)
Washington:
8.2% (17,551)
Number of families with income > $200k:
Kennewick:
2.3% (141)
Washington:
9.7% (20,653)
Median non-family income in Kennewick in 2022:
Kennewick:
$59,120
State:
$54,173
Change in median non-family income between 2000 and 2022:
Kennewick, Washington:
+90.5%
Washington:
+105.8%
Median per capita income in Kennewick in 2022:
Kennewick:
$24,697
State:
$28,252
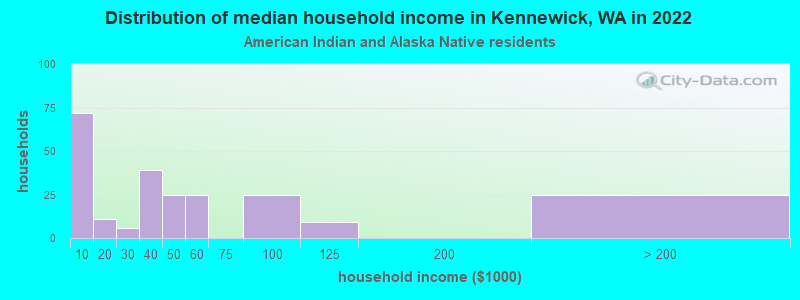
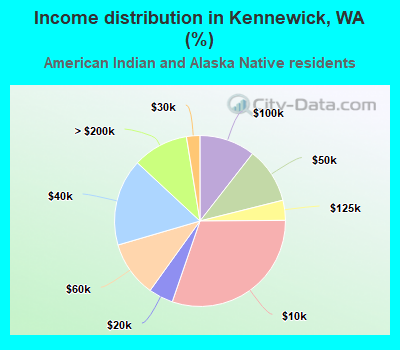
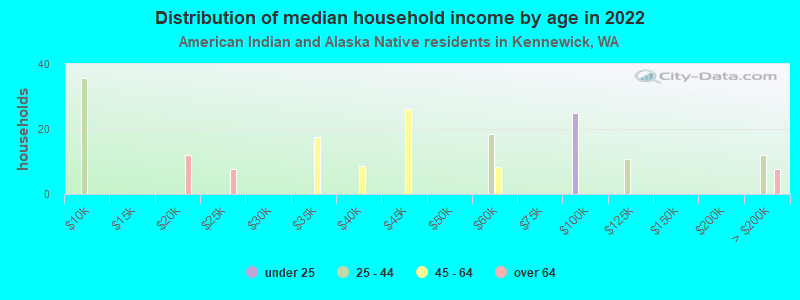
Income statistics for American Indian and Alaska Native residents
Number of households with income < $10k:
Kennewick:
30.4% (72)
State:
5.9% (1,768)
Number of households with income $10k - 20k:
Kennewick:
4.6% (11)
State:
8.9% (2,694)
Number of households with income $20k - 30k:
Kennewick:
2.5% (6)
Washington:
8.0% (2,412)
Number of households with income $30k - 40k:
Kennewick:
16.5% (39)
State:
7.7% (2,327)
Number of households with income $40k - 50k:
Kennewick:
10.5% (25)
Washington:
5.8% (1,755)
Number of households with income $50k - 60k:
Kennewick:
10.5% (25)
State:
7.5% (2,259)
Number of households with income $60k - 75k:
Kennewick:
0.0% (0)
Washington:
8.8% (2,669)
Number of households with income $75k - 100k:
Kennewick:
10.5% (25)
Washington:
12.8% (3,861)
Number of households with income $100k - 125k:
Kennewick:
3.8% (9)
State:
12.0% (3,618)
Number of households with income $125k - 150k:
Kennewick:
0.0% (0)
State:
8.6% (2,580)
Number of households with income $150k - 200k:
Kennewick:
0.0% (0)
State:
5.9% (1,774)
Number of households with income > $200k:
Kennewick:
10.5% (25)
State:
8.1% (2,447)
Aggregate household income in Kennewick in 2022: $14,703,334
Median per capita income in Kennewick in 2022:
Kennewick:
$18,390
State:
$27,053
Change in median per capita income between 2000 and 2022:
Kennewick, Washington:
+25.9%
Washington:
+98.6%
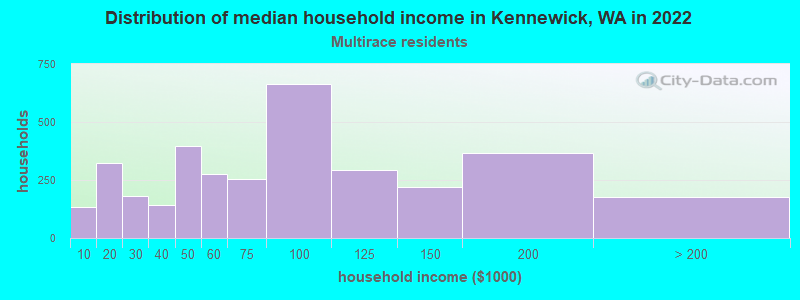
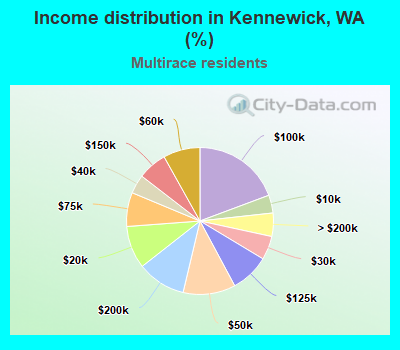
Income statistics for Multirace residents
Median household income in Kennewick, WA in 2022:
Kennewick:
$82,101
State:
$84,303
Number of households with income < $10k:
Kennewick:
3.9% (135)
Washington:
4.3% (12,040)
Number of households with income $10k - 20k:
Kennewick:
9.4% (322)
Washington:
6.6% (18,437)
Number of households with income $20k - 30k:
Kennewick:
5.2% (179)
State:
5.2% (14,559)
Number of households with income $30k - 40k:
Kennewick:
4.2% (143)
State:
6.7% (18,491)
Number of households with income $40k - 50k:
Kennewick:
11.5% (395)
Washington:
6.3% (17,459)
Number of households with income $50k - 60k:
Kennewick:
8.1% (278)
State:
6.9% (19,086)
Number of households with income $60k - 75k:
Kennewick:
7.5% (256)
Washington:
9.1% (25,310)
Number of households with income $75k - 100k:
Kennewick:
19.3% (662)
State:
13.5% (37,493)
Number of households with income $100k - 125k:
Kennewick:
8.6% (293)
Washington:
10.7% (29,626)
Number of households with income $125k - 150k:
Kennewick:
6.4% (220)
State:
8.6% (23,899)
Number of households with income $150k - 200k:
Kennewick:
10.7% (367)
Washington:
10.2% (28,214)
Number of households with income > $200k:
Kennewick:
5.1% (176)
Washington:
11.9% (32,947)
Aggregate household income in Kennewick in 2022: $307,544,500
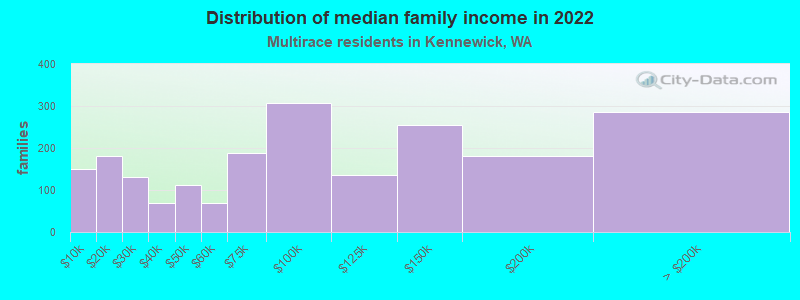
Median family income in Kennewick in 2022:
Kennewick:
$83,472
State:
$95,629
Number of families with income < $10k:
Kennewick:
7.2% (149)
State:
3.5% (6,121)
Number of families with income $10k - 20k:
Kennewick:
8.7% (180)
State:
4.3% (7,519)
Number of families with income $20k - 30k:
Kennewick:
6.4% (132)
State:
4.4% (7,775)
Number of families with income $30k - 40k:
Kennewick:
3.4% (70)
Washington:
5.8% (10,186)
Number of families with income $40k - 50k:
Kennewick:
5.4% (112)
State:
5.9% (10,412)
Number of families with income $50k - 60k:
Kennewick:
3.3% (68)
State:
5.6% (9,922)
Number of families with income $60k - 75k:
Kennewick:
9.1% (189)
Washington:
9.7% (17,113)
Number of families with income $75k - 100k:
Kennewick:
14.9% (307)
State:
13.6% (23,984)
Number of families with income $100k - 125k:
Kennewick:
6.6% (136)
Washington:
10.4% (18,288)
Number of families with income $125k - 150k:
Kennewick:
12.4% (255)
Washington:
10.5% (18,481)
Number of families with income $150k - 200k:
Kennewick:
8.8% (182)
State:
11.9% (20,852)
Number of families with income > $200k:
Kennewick:
13.8% (285)
State:
14.4% (25,289)
Median non-family income in Kennewick in 2022:
Kennewick:
$59,859
State:
$56,573
Median per capita income in Kennewick in 2022:
Kennewick:
$27,981
State:
$32,496
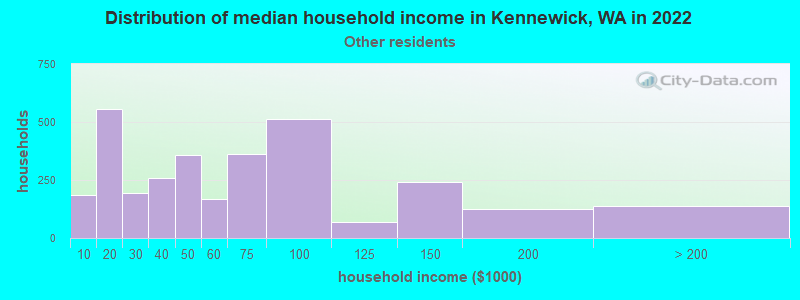
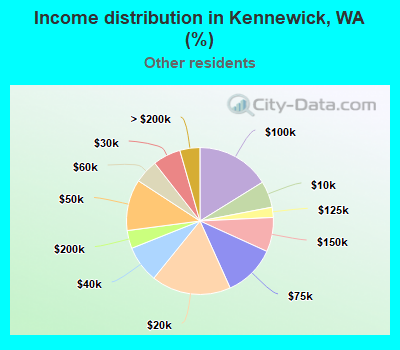
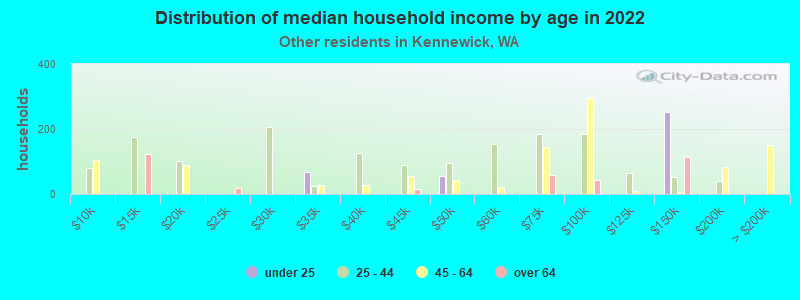
Income statistics for other residents
Median household income in Kennewick, WA in 2022:
Kennewick:
$64,924
State:
$69,545
Number of households with income < $10k:
Kennewick:
5.8% (185)
State:
5.3% (6,540)
Number of households with income $10k - 20k:
Kennewick:
17.6% (557)
State:
6.0% (7,385)
Number of households with income $20k - 30k:
Kennewick:
6.1% (195)
Washington:
7.5% (9,289)
Number of households with income $30k - 40k:
Kennewick:
8.1% (258)
Washington:
8.9% (11,015)
Number of households with income $40k - 50k:
Kennewick:
11.3% (358)
State:
7.6% (9,399)
Number of households with income $50k - 60k:
Kennewick:
5.2% (166)
State:
7.2% (8,867)
Number of households with income $60k - 75k:
Kennewick:
11.5% (364)
State:
10.5% (13,032)
Number of households with income $75k - 100k:
Kennewick:
16.2% (513)
State:
14.6% (18,007)
Number of households with income $100k - 125k:
Kennewick:
2.2% (71)
Washington:
12.2% (15,128)
Number of households with income $125k - 150k:
Kennewick:
7.6% (240)
State:
5.6% (6,950)
Number of households with income $150k - 200k:
Kennewick:
4.0% (126)
Washington:
7.1% (8,749)
Number of households with income > $200k:
Kennewick:
4.4% (140)
Washington:
7.5% (9,208)
Aggregate household income in Kennewick in 2022: $307,910,800
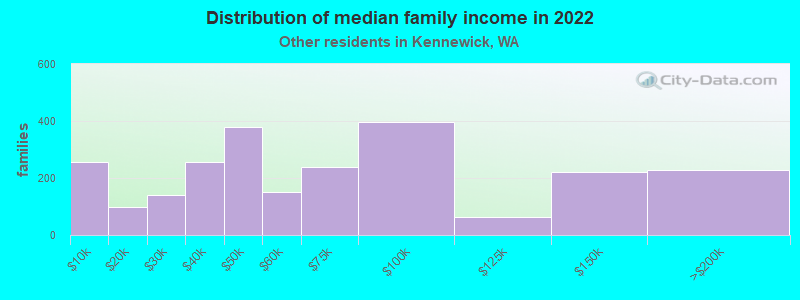
Median family income in Kennewick in 2022:
Kennewick:
$81,066
State:
$72,588
Number of families with income < $10k:
Kennewick:
10.5% (256)
Washington:
5.5% (5,287)
Number of families with income $10k - 20k:
Kennewick:
4.1% (99)
Washington:
4.0% (3,814)
Number of families with income $20k - 30k:
Kennewick:
5.7% (139)
Washington:
6.6% (6,293)
Number of families with income $30k - 40k:
Kennewick:
10.6% (257)
State:
9.2% (8,827)
Number of families with income $40k - 50k:
Kennewick:
15.6% (379)
State:
8.0% (7,634)
Number of families with income $50k - 60k:
Kennewick:
6.2% (151)
State:
7.7% (7,357)
Number of families with income $60k - 75k:
Kennewick:
9.9% (240)
Washington:
10.3% (9,864)
Number of families with income $75k - 100k:
Kennewick:
16.4% (398)
State:
14.5% (13,800)
Number of families with income $100k - 125k:
Kennewick:
2.6% (62)
Washington:
12.9% (12,298)
Number of families with income $125k - 150k:
Kennewick:
9.1% (221)
State:
6.0% (5,679)
Number of families with income $150k - 200k:
Kennewick:
9.4% (228)
State:
8.2% (7,822)
Median per capita income in Kennewick in 2022:
Kennewick:
$20,976
State:
$27,542
Change in median per capita income between 2000 and 2022:
Kennewick, Washington:
+139.4%
State:
+167.8%
Discuss Kennewick, Washington (WA) on our hugely popular Washington forum.