Killingworth, Connecticut (CT) income map, earnings map, and wages data
The median household income in Killingworth, CT in 2022 was $136,733, which was 35.3% greater than the median annual income of $88,429 across the entire state of Connecticut. Compared to the median income of $80,805 in 2000 this represents an increase of 40.9%. The per capita income in 2022 was $58,407, which means an increase of 45.3% compared to 2000 when it was $31,929.
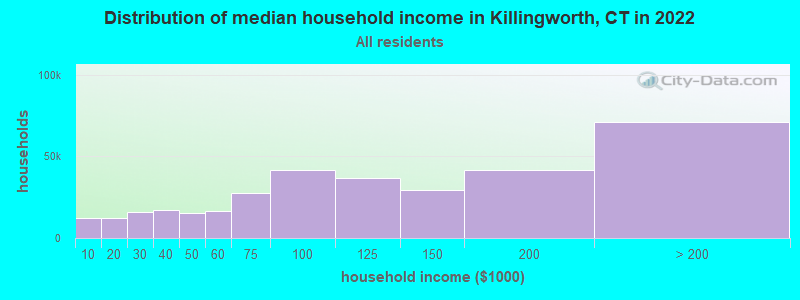
Income statistics for all residents
Median household income in Killingworth, CT in 2022:| Killingworth: | $136,733 |
| State: | $88,429 |
Change in median household income between 2000 and 2022:| Killingworth, Connecticut: | +69.2% |
| Connecticut: | +64.0% |
Number of households with income < $10k:| Killingworth: | 5.2% (55,694) |
| State: | 5.1% (72,746) |
Number of households with income $10k - 20k:| Killingworth: | 5.8% (62,803) |
| State: | 5.7% (81,643) |
Number of households with income $20k - 30k:| Killingworth: | 6.6% (71,088) |
| State: | 6.5% (92,844) |
Number of households with income $30k - 40k:| Killingworth: | 5.9% (63,796) |
| State: | 5.9% (83,934) |
Number of households with income $40k - 50k:| Killingworth: | 5.9% (63,387) |
| State: | 5.8% (83,025) |
Number of households with income $50k - 60k:| Killingworth: | 5.8% (62,155) |
| State: | 5.7% (81,788) |
Number of households with income $60k - 75k:| Killingworth: | 8.1% (87,087) |
| Connecticut: | 8.1% (115,651) |
Number of households with income $75k - 100k:| Killingworth: | 12.6% (136,010) |
| State: | 12.6% (180,173) |
Number of households with income $100k - 125k:| Killingworth: | 9.8% (105,883) |
| State: | 9.9% (141,231) |
Number of households with income $125k - 150k:| Killingworth: | 7.8% (84,558) |
| State: | 7.9% (112,826) |
Number of households with income $150k - 200k:| Killingworth: | 10.7% (115,668) |
| State: | 10.8% (154,641) |
Number of households with income > $200k:| Killingworth: | 16.0% (172,801) |
| State: | 16.3% (233,133) |
Aggregate household income in Killingworth in 2022: $8,134,284,319
Median family income in Killingworth in 2022:| Killingworth: | $156,942 |
| State: | $115,183 |
Median non-family income in Killingworth in 2022:| Killingworth: | $60,211 |
| Connecticut: | $50,964 |
Change in median non-family income between 2000 and 2022:| Killingworth, Connecticut: | +71.5% |
| Connecticut: | +65.1% |
Median per capita income in Killingworth in 2022:| Killingworth: | $58,408 |
| State: | $51,581 |
Change in median per capita income between 2000 and 2022:| Killingworth, Connecticut: | +82.9% |
| Connecticut: | +79.3% |
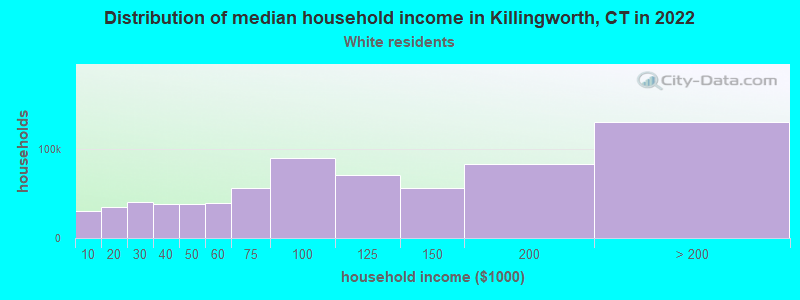
Income statistics for White residents
Median household income in Killingworth, CT in 2022:| Killingworth: | $136,028 |
| State: | $96,890 |
Change in median household income between 2000 and 2022:| Killingworth, Connecticut: | +69.4% |
| State: | +68.5% |
Number of households with income < $10k:| Killingworth: | 4.2% (29,752) |
| State: | 4.2% (42,265) |
Number of households with income $10k - 20k:| Killingworth: | 4.9% (34,206) |
| State: | 4.8% (48,323) |
Number of households with income $20k - 30k:| Killingworth: | 5.8% (40,680) |
| State: | 5.7% (57,716) |
Number of households with income $30k - 40k:| Killingworth: | 5.4% (37,656) |
| Connecticut: | 5.3% (53,827) |
Number of households with income $40k - 50k:| Killingworth: | 5.3% (37,500) |
| State: | 5.3% (53,301) |
Number of households with income $50k - 60k:| Killingworth: | 5.6% (39,026) |
| State: | 5.5% (55,690) |
Number of households with income $60k - 75k:| Killingworth: | 7.9% (55,770) |
| State: | 8.0% (80,329) |
Number of households with income $75k - 100k:| Killingworth: | 12.7% (89,365) |
| State: | 12.7% (128,070) |
Number of households with income $100k - 125k:| Killingworth: | 10.0% (70,173) |
| State: | 10.0% (101,210) |
Number of households with income $125k - 150k:| Killingworth: | 8.0% (56,337) |
| State: | 8.0% (81,250) |
Number of households with income $150k - 200k:| Killingworth: | 11.8% (82,837) |
| State: | 11.8% (119,527) |
Number of households with income > $200k:| Killingworth: | 18.4% (129,678) |
| Connecticut: | 18.6% (187,875) |
Aggregate household income in Killingworth in 2022: $5,973,913,564
Median family income in Killingworth in 2022:| Killingworth: | $159,549 |
| State: | $128,955 |
Number of families with income $10k - 20k:| Killingworth: | 0.6% (9) |
| State: | 1.8% (11,289) |
Number of families with income $20k - 30k:| Killingworth: | 2.4% (38) |
| State: | 3.0% (18,506) |
Number of families with income $30k - 40k:| Killingworth: | 2.5% (38) |
| State: | 2.9% (18,160) |
Number of families with income $40k - 50k:| Killingworth: | 3.5% (55) |
| State: | 3.9% (24,550) |
Number of families with income $50k - 60k:| Killingworth: | 3.3% (52) |
| State: | 4.3% (26,723) |
Number of families with income $60k - 75k:| Killingworth: | 4.6% (72) |
| Connecticut: | 7.1% (44,075) |
Number of families with income $75k - 100k:| Killingworth: | 15.1% (235) |
| State: | 12.5% (77,679) |
Number of families with income $100k - 125k:| Killingworth: | 20.2% (315) |
| State: | 11.1% (69,086) |
Number of families with income $125k - 150k:| Killingworth: | 21.3% (333) |
| State: | 9.6% (59,616) |
Number of families with income $150k - 200k:| Killingworth: | 15.2% (237) |
| State: | 15.7% (97,890) |
Number of families with income > $200k:| Killingworth: | 11.2% (175) |
| State: | 26.3% (163,417) |
Median non-family income in Killingworth in 2022:| Killingworth: | $60,984 |
| Connecticut: | $54,067 |
Change in median non-family income between 2000 and 2022:| Killingworth, Connecticut: | +73.7% |
| State: | +68.7% |
Median per capita income in Killingworth in 2022:| Killingworth: | $61,016 |
| Connecticut: | $59,916 |
Change in median per capita income between 2000 and 2022:| Killingworth, Connecticut: | +92.1% |
| Connecticut: | +90.2% |
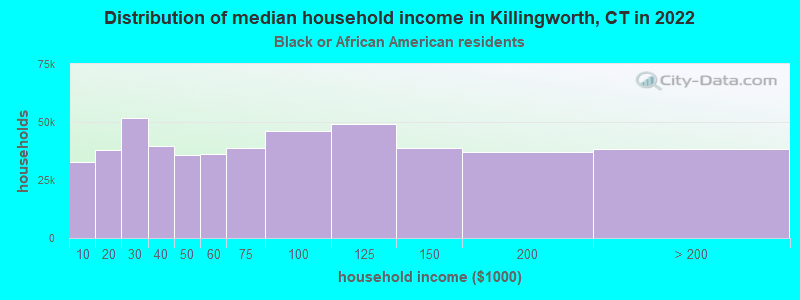
Income statistics for Black or African American residents
Median household income in Killingworth, CT in 2022:| Killingworth: | $194,722 |
| State: | $61,803 |
Change in median household income between 2000 and 2022:| Killingworth, Connecticut: | +60.9% |
| Connecticut: | +76.1% |
Number of households with income < $10k:| Killingworth: | 6.8% (32,729) |
| State: | 6.8% (9,494) |
Number of households with income $10k - 20k:| Killingworth: | 7.9% (37,931) |
| State: | 7.9% (11,003) |
Number of households with income $20k - 30k:| Killingworth: | 10.8% (51,864) |
| State: | 10.8% (15,045) |
Number of households with income $30k - 40k:| Killingworth: | 8.2% (39,647) |
| State: | 8.2% (11,501) |
Number of households with income $40k - 50k:| Killingworth: | 7.4% (35,907) |
| State: | 7.4% (10,416) |
Number of households with income $50k - 60k:| Killingworth: | 7.5% (36,314) |
| State: | 7.5% (10,534) |
Number of households with income $60k - 75k:| Killingworth: | 8.0% (38,761) |
| State: | 8.0% (11,244) |
Number of households with income $75k - 100k:| Killingworth: | 9.6% (46,090) |
| State: | 9.6% (13,370) |
Number of households with income $100k - 125k:| Killingworth: | 10.2% (49,103) |
| State: | 10.2% (14,244) |
Number of households with income $125k - 150k:| Killingworth: | 8.0% (38,768) |
| Connecticut: | 8.0% (11,246) |
Number of households with income $150k - 200k:| Killingworth: | 7.7% (36,979) |
| State: | 7.7% (10,727) |
Number of households with income > $200k:| Killingworth: | 7.9% (38,217) |
| State: | 7.9% (11,086) |
Aggregate household income in Killingworth in 2022: $5,871,188
Median family income in Killingworth in 2022:| Killingworth: | $268,890 |
| State: | $87,228 |
Number of families with income $100k - 125k:| Killingworth: | 35.8% (13) |
| State: | 11.4% (9,482) |
Number of families with income $125k - 150k:| Killingworth: | 64.2% (24) |
| State: | 11.2% (9,356) |
Median per capita income in Killingworth in 2022:| Killingworth: | $64,584 |
| State: | $36,289 |
Change in median per capita income between 2000 and 2022:| Killingworth, Connecticut: | +115.2% |
| State: | +117.5% |
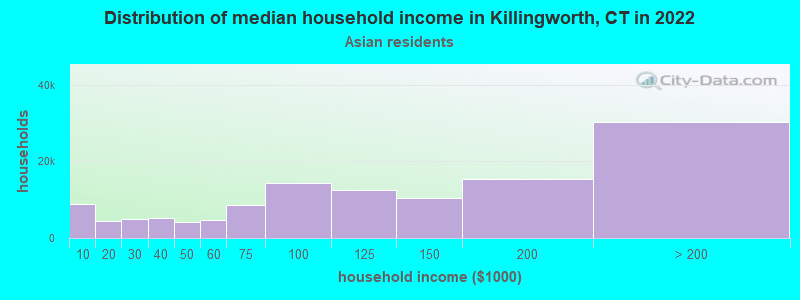
Income statistics for Asian residents
Median household income in Killingworth, CT in 2022:| Killingworth: | $267,458 |
| State: | $110,568 |
Change in median household income between 2000 and 2022:| Killingworth, Connecticut: | +110.1% |
| State: | +79.5% |
Number of households with income < $10k:| Killingworth: | 7.1% (8,775) |
| State: | 7.1% (4,245) |
Number of households with income $10k - 20k:| Killingworth: | 3.5% (4,314) |
| State: | 3.5% (2,087) |
Number of households with income $20k - 30k:| Killingworth: | 4.1% (5,093) |
| State: | 4.1% (2,464) |
Number of households with income $30k - 40k:| Killingworth: | 4.1% (5,122) |
| State: | 4.1% (2,478) |
Number of households with income $40k - 50k:| Killingworth: | 3.3% (4,099) |
| State: | 3.3% (1,983) |
Number of households with income $50k - 60k:| Killingworth: | 3.9% (4,812) |
| Connecticut: | 3.9% (2,328) |
Number of households with income $60k - 75k:| Killingworth: | 7.0% (8,740) |
| State: | 7.0% (4,228) |
Number of households with income $75k - 100k:| Killingworth: | 11.5% (14,286) |
| State: | 11.5% (6,911) |
Number of households with income $100k - 125k:| Killingworth: | 10.2% (12,665) |
| State: | 10.2% (6,127) |
Number of households with income $125k - 150k:| Killingworth: | 8.5% (10,499) |
| State: | 8.5% (5,079) |
Number of households with income $150k - 200k:| Killingworth: | 12.4% (15,367) |
| State: | 12.4% (7,434) |
Number of households with income > $200k:| Killingworth: | 24.4% (30,306) |
| State: | 24.4% (14,661) |
Aggregate household income in Killingworth in 2022: $2,822,253
Median family income in Killingworth in 2022:| Killingworth: | $264,560 |
| State: | $134,548 |
Number of families with income $125k - 150k:| Killingworth: | 100.0% (13) |
| State: | 8.2% (3,588) |
Median per capita income in Killingworth in 2022:| Killingworth: | $60,202 |
| State: | $55,295 |
Change in median per capita income between 2000 and 2022:| Killingworth, Connecticut: | +103.6% |
| Connecticut: | +97.8% |
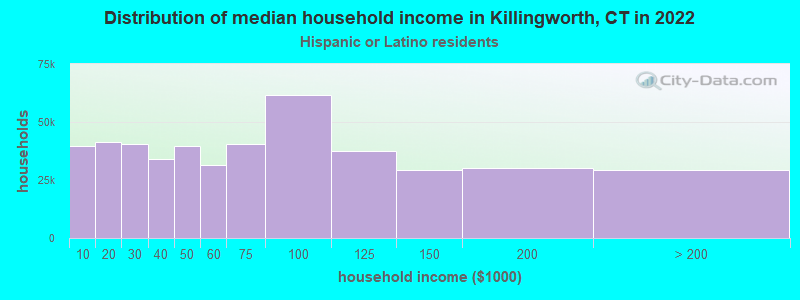
Income statistics for Hispanic or Latino residents
Median household income in Killingworth, CT in 2022:| Killingworth: | $115,359 |
| State: | $60,275 |
Change in median household income between 2000 and 2022:| Killingworth, Connecticut: | +67.8% |
| State: | +87.9% |
Number of households with income < $10k:| Killingworth: | 8.7% (39,833) |
| State: | 8.7% (18,584) |
Number of households with income $10k - 20k:| Killingworth: | 9.1% (41,229) |
| Connecticut: | 9.1% (19,235) |
Number of households with income $20k - 30k:| Killingworth: | 8.9% (40,701) |
| State: | 8.9% (18,989) |
Number of households with income $30k - 40k:| Killingworth: | 7.5% (34,224) |
| State: | 7.5% (15,967) |
Number of households with income $40k - 50k:| Killingworth: | 8.7% (39,580) |
| State: | 8.7% (18,466) |
Number of households with income $50k - 60k:| Killingworth: | 6.9% (31,521) |
| Connecticut: | 6.9% (14,706) |
Number of households with income $60k - 75k:| Killingworth: | 8.9% (40,485) |
| State: | 8.9% (18,888) |
Number of households with income $75k - 100k:| Killingworth: | 13.5% (61,450) |
| Connecticut: | 13.5% (28,669) |
Number of households with income $100k - 125k:| Killingworth: | 8.2% (37,368) |
| State: | 8.2% (17,434) |
Number of households with income $125k - 150k:| Killingworth: | 6.5% (29,476) |
| State: | 6.5% (13,752) |
Number of households with income $150k - 200k:| Killingworth: | 6.6% (30,252) |
| State: | 6.6% (14,114) |
Number of households with income > $200k:| Killingworth: | 6.4% (29,215) |
| State: | 6.4% (13,630) |
Aggregate household income in Killingworth in 2022: $30,380,544
Median family income in Killingworth in 2022:| Killingworth: | $117,618 |
| Connecticut: | $68,336 |
Number of families with income $10k - 20k:| Killingworth: | 2.0% (7) |
| State: | 6.0% (8,616) |
Number of families with income $20k - 30k:| Killingworth: | 8.5% (28) |
| State: | 8.9% (12,680) |
Number of families with income $30k - 40k:| Killingworth: | 6.3% (21) |
| Connecticut: | 8.5% (12,090) |
Number of families with income $40k - 50k:| Killingworth: | 8.7% (29) |
| Connecticut: | 8.8% (12,624) |
Number of families with income $50k - 60k:| Killingworth: | 7.0% (23) |
| Connecticut: | 8.4% (11,924) |
Number of families with income $60k - 75k:| Killingworth: | 5.7% (19) |
| State: | 8.9% (12,677) |
Number of families with income $75k - 100k:| Killingworth: | 18.6% (62) |
| State: | 14.3% (20,457) |
Number of families with income $100k - 125k:| Killingworth: | 15.1% (50) |
| Connecticut: | 8.2% (11,720) |
Number of families with income $125k - 150k:| Killingworth: | 18.9% (63) |
| State: | 8.2% (11,729) |
Number of families with income $150k - 200k:| Killingworth: | 6.7% (22) |
| Connecticut: | 7.1% (10,096) |
Number of families with income > $200k:| Killingworth: | 2.6% (9) |
| State: | 7.4% (10,622) |
Median per capita income in Killingworth in 2022:| Killingworth: | $132,049 |
| Connecticut: | $28,507 |
Change in median per capita income between 2000 and 2022:| Killingworth, Connecticut: | +80.3% |
| State: | +117.2% |
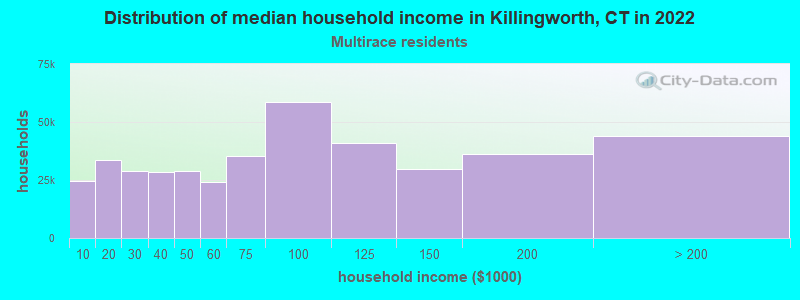
Income statistics for Multirace residents
Median household income in Killingworth, CT in 2022:| Killingworth: | $263,527 |
| State: | $77,277 |
Change in median household income between 2000 and 2022:| Killingworth, Connecticut: | +119.4% |
| State: | +113.6% |
Number of households with income < $10k:| Killingworth: | 6.0% (24,747) |
| State: | 6.0% (7,457) |
Number of households with income $10k - 20k:| Killingworth: | 8.1% (33,648) |
| State: | 8.1% (10,139) |
Number of households with income $20k - 30k:| Killingworth: | 7.0% (28,879) |
| State: | 7.0% (8,702) |
Number of households with income $30k - 40k:| Killingworth: | 6.9% (28,361) |
| State: | 6.9% (8,546) |
Number of households with income $40k - 50k:| Killingworth: | 7.0% (28,912) |
| Connecticut: | 7.0% (8,712) |
Number of households with income $50k - 60k:| Killingworth: | 5.9% (24,329) |
| State: | 5.9% (7,331) |
Number of households with income $60k - 75k:| Killingworth: | 8.5% (35,291) |
| State: | 8.5% (10,634) |
Number of households with income $75k - 100k:| Killingworth: | 14.1% (58,408) |
| State: | 14.1% (17,600) |
Number of households with income $100k - 125k:| Killingworth: | 9.9% (41,095) |
| State: | 9.9% (12,383) |
Number of households with income $125k - 150k:| Killingworth: | 7.2% (29,606) |
| State: | 7.2% (8,921) |
Number of households with income $150k - 200k:| Killingworth: | 8.8% (36,246) |
| State: | 8.8% (10,922) |
Number of households with income > $200k:| Killingworth: | 10.6% (43,962) |
| State: | 10.6% (13,247) |
Aggregate household income in Killingworth in 2022: $71,776,951
Median family income in Killingworth in 2022:| Killingworth: | $258,251 |
| State: | $84,255 |
Number of families with income $60k - 75k:| Killingworth: | 3.6% (19) |
| State: | 7.8% (6,550) |
Number of families with income $100k - 125k:| Killingworth: | 15.8% (83) |
| State: | 9.2% (7,787) |
Number of families with income > $200k:| Killingworth: | 80.6% (422) |
| State: | 13.7% (11,603) |
Median per capita income in Killingworth in 2022:| Killingworth: | $89,129 |
| State: | $32,794 |
Change in median per capita income between 2000 and 2022:| Killingworth, Connecticut: | +95.5% |
| Connecticut: | +117.2% |