The median household income in Kylertown, PA in 2022 was $66,853, which was 7.4% less than the median annual income of $71,798 across the entire state of Pennsylvania. Compared to the median income of $31,357 in 2000 this represents an increase of 53.1%. The per capita income in 2022 was $90,952, which means an increase of 82.4% compared to 2000 when it was $16,010.
Whole page based on the data from 2000 / 2022 when the population of Kylertown, Pennsylvania was 340 / 389
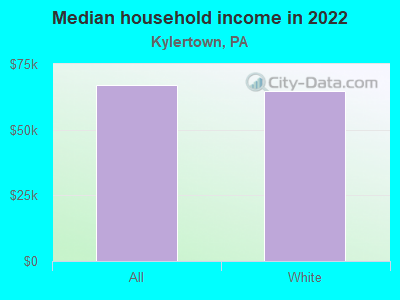
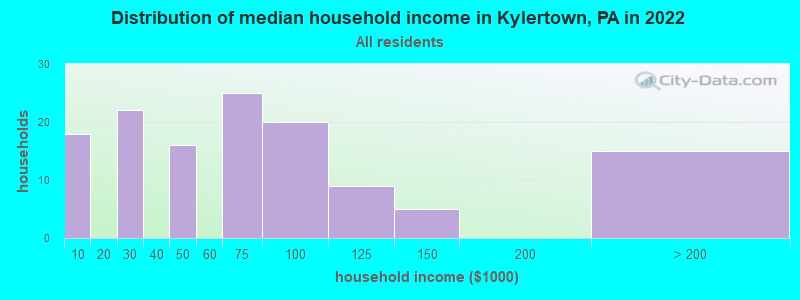
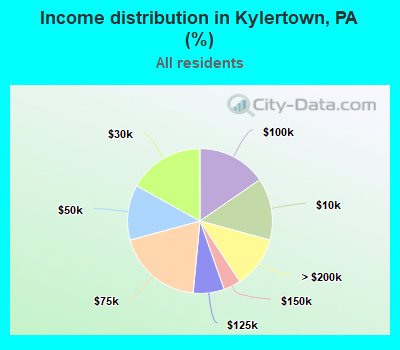
Income statistics for all residents
Median household income in Kylertown, PA in 2022:
Kylertown:
$66,853
State:
$71,798
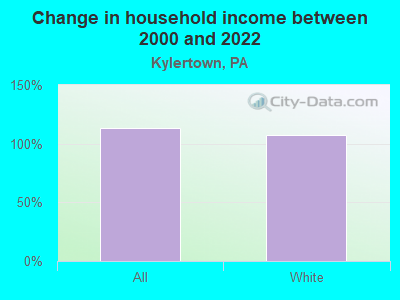
Change in median household income between 2000 and 2022:
Kylertown, Pennsylvania:
+113.2%
State:
+79.0%
Number of households with income < $10k:
Kylertown:
13.8% (18)
State:
5.5% (291,562)
Number of households with income $10k - 20k:
Kylertown:
0.0% (0)
State:
7.3% (384,726)
Number of households with income $20k - 30k:
Kylertown:
16.9% (22)
State:
7.4% (389,464)
Number of households with income $30k - 40k:
Kylertown:
0.0% (0)
State:
7.6% (402,138)
Number of households with income $40k - 50k:
Kylertown:
12.3% (16)
State:
7.3% (387,945)
Number of households with income $50k - 60k:
Kylertown:
0.0% (0)
Pennsylvania:
7.0% (372,468)
Number of households with income $60k - 75k:
Kylertown:
19.2% (25)
State:
9.9% (524,786)
Number of households with income $75k - 100k:
Kylertown:
15.4% (20)
State:
12.6% (666,253)
Number of households with income $100k - 125k:
Kylertown:
6.9% (9)
Pennsylvania:
9.9% (526,402)
Number of households with income $125k - 150k:
Kylertown:
3.8% (5)
State:
6.9% (362,702)
Number of households with income $150k - 200k:
Kylertown:
0.0% (0)
State:
8.3% (440,827)
Number of households with income > $200k:
Kylertown:
11.5% (15)
State:
10.3% (544,792)
Aggregate household income in Kylertown in 2022: $35,736,404
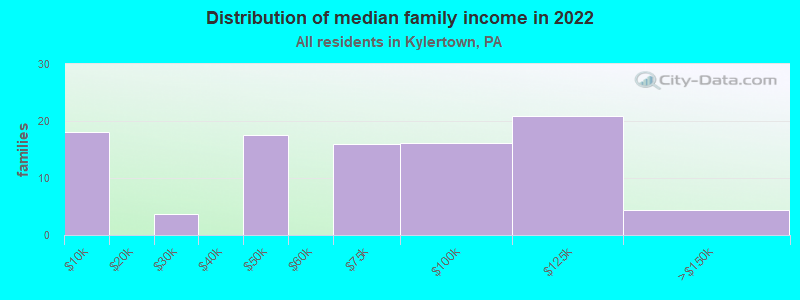
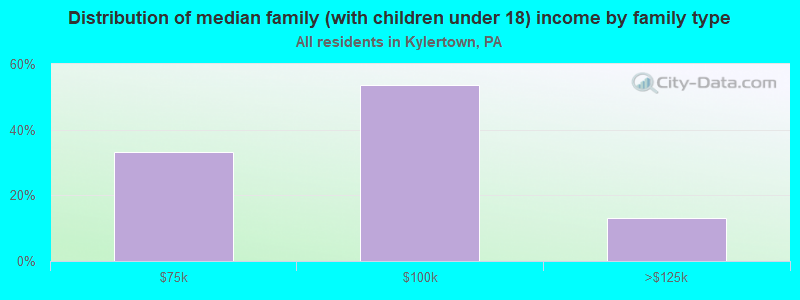
Median family income in Kylertown in 2022:
Kylertown:
$65,287
Pennsylvania:
$93,029
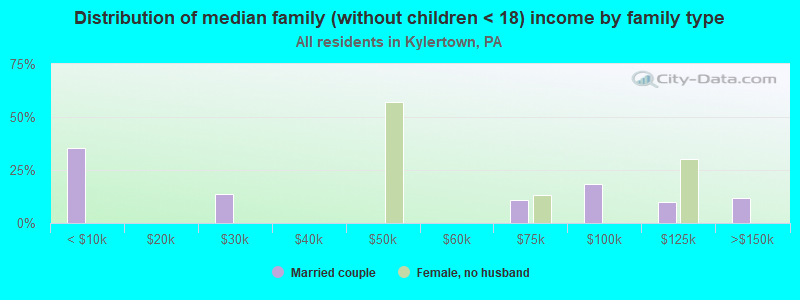
Number of families with income < $10k:
Kylertown:
18.7% (18)
State:
3.1% (101,868)
Number of families with income $20k - 30k:
Kylertown:
3.8% (4)
State:
4.8% (156,521)
Number of families with income $40k - 50k:
Kylertown:
18.0% (17)
State:
6.4% (211,380)
Number of families with income $60k - 75k:
Kylertown:
16.6% (16)
Pennsylvania:
9.7% (318,991)
Number of families with income $75k - 100k:
Kylertown:
16.7% (16)
Pennsylvania:
14.0% (461,021)
Number of families with income $100k - 125k:
Kylertown:
21.6% (21)
State:
12.2% (400,961)
Number of families with income $125k - 150k:
Kylertown:
4.5% (4)
Pennsylvania:
8.8% (288,471)
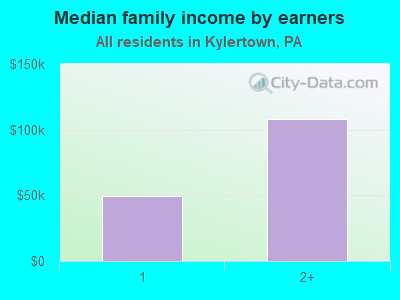
Median income for 3 person families:
Kylertown:
$74,596
State:
$99,093
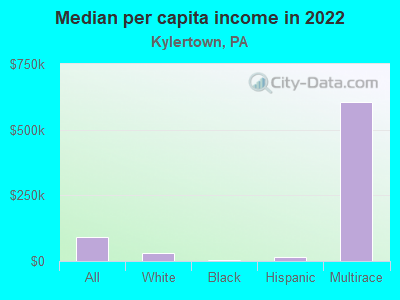
Median per capita income in Kylertown in 2022:
Kylertown:
$90,953
State:
$41,489
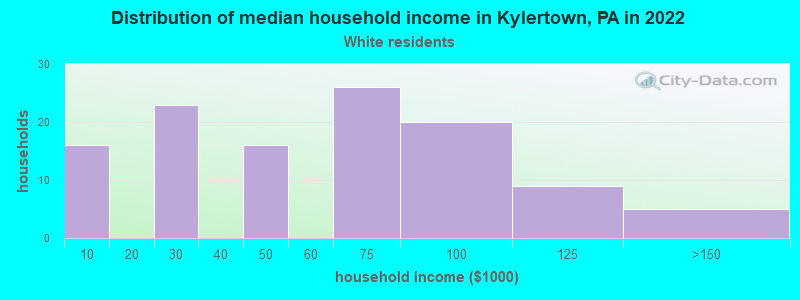
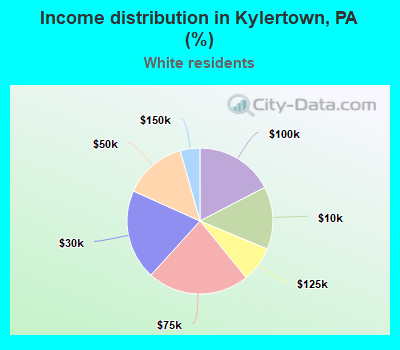
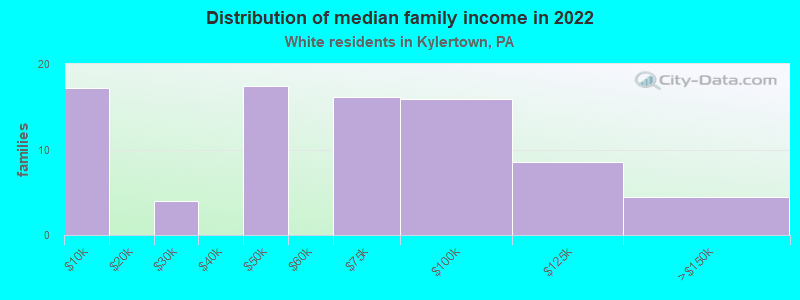
Income statistics for White residents
Median household income in Kylertown, PA in 2022:
Kylertown:
$64,701
State:
$76,765
Change in median household income between 2000 and 2022:
Kylertown, Pennsylvania:
+106.9%
State:
+84.3%
Number of households with income < $10k:
Kylertown:
13.9% (16)
State:
4.3% (179,792)
Number of households with income $10k - 20k:
Kylertown:
0.0% (0)
Pennsylvania:
6.5% (268,738)
Number of households with income $20k - 30k:
Kylertown:
20.0% (23)
State:
7.0% (288,138)
Number of households with income $30k - 40k:
Kylertown:
0.0% (0)
State:
7.2% (300,208)
Number of households with income $40k - 50k:
Kylertown:
13.9% (16)
Pennsylvania:
7.2% (298,756)
Number of households with income $50k - 60k:
Kylertown:
0.0% (0)
Pennsylvania:
6.8% (283,251)
Number of households with income $60k - 75k:
Kylertown:
22.6% (26)
State:
9.9% (408,159)
Number of households with income $75k - 100k:
Kylertown:
17.4% (20)
State:
13.2% (547,809)
Number of households with income $100k - 125k:
Kylertown:
7.8% (9)
Pennsylvania:
10.5% (436,652)
Number of households with income $125k - 150k:
Kylertown:
4.3% (5)
State:
7.3% (304,132)
Number of households with income $150k - 200k:
Kylertown:
0.0% (0)
State:
9.0% (374,658)
Number of households with income > $200k:
Kylertown:
0.0% (0)
State:
10.9% (452,618)
Aggregate household income in Kylertown in 2022: $7,610,470
Median family income in Kylertown in 2022:
Kylertown:
$62,612
State:
$99,396
Number of families with income < $10k:
Kylertown:
20.5% (17)
State:
2.2% (56,136)
Number of families with income $20k - 30k:
Kylertown:
4.7% (4)
Pennsylvania:
3.9% (100,065)
Number of families with income $40k - 50k:
Kylertown:
20.8% (17)
State:
6.0% (154,327)
Number of families with income $60k - 75k:
Kylertown:
19.3% (16)
Pennsylvania:
9.6% (249,292)
Number of families with income $75k - 100k:
Kylertown:
19.0% (16)
State:
14.7% (379,316)
Number of families with income $100k - 125k:
Kylertown:
10.2% (9)
Pennsylvania:
12.9% (333,626)
Number of families with income $125k - 150k:
Kylertown:
5.4% (4)
State:
9.4% (243,915)
Median per capita income in Kylertown in 2022:
Kylertown:
$29,396
State:
$45,306
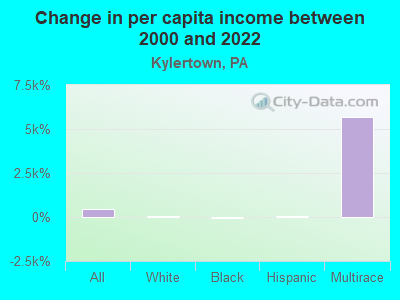
Change in median per capita income between 2000 and 2022:
Kylertown, Pennsylvania:
+84.0%
State:
+105.4%
Income statistics for Black or African American residents
Median per capita income in Kylertown in 2022:
Kylertown:
$4,241
State:
$28,010
Change in median per capita income between 2000 and 2022:: -62.6%
Kylertown, Pennsylvania:
-62.6%
State:
+101.5%
Income statistics for Hispanic or Latino residents
Median per capita income in Kylertown in 2022:
Kylertown:
$15,945
Pennsylvania:
$23,829
Change in median per capita income between 2000 and 2022:
Kylertown, Pennsylvania:
+69.2%
State:
+116.4%
Income statistics for Multirace residents
Number of households with income < $10k:
Kylertown:
0.0% (0)
State:
7.8% (21,911)
Number of households with income $10k - 20k:
Kylertown:
0.0% (0)
Pennsylvania:
8.2% (22,847)
Number of households with income $20k - 30k:
Kylertown:
0.0% (0)
State:
8.7% (24,252)
Number of households with income $30k - 40k:
Kylertown:
0.0% (0)
Pennsylvania:
7.3% (20,502)
Number of households with income $40k - 50k:
Kylertown:
0.0% (0)
State:
7.7% (21,525)
Number of households with income $50k - 60k:
Kylertown:
0.0% (0)
State:
8.6% (24,174)
Number of households with income $60k - 75k:
Kylertown:
0.0% (0)
State:
11.9% (33,350)
Number of households with income $75k - 100k:
Kylertown:
0.0% (0)
State:
11.5% (32,274)
Number of households with income $100k - 125k:
Kylertown:
0.0% (0)
Pennsylvania:
8.3% (23,361)
Number of households with income $125k - 150k:
Kylertown:
0.0% (0)
State:
5.3% (14,784)
Number of households with income $150k - 200k:
Kylertown:
0.0% (0)
State:
6.9% (19,314)
Number of households with income > $200k:
Kylertown:
100.0% (14)
State:
7.8% (21,759)
Aggregate household income in Kylertown in 2022: $55,160,800
Median per capita income in Kylertown in 2022:
Kylertown:
$604,246
State:
$27,581
Discuss Kylertown, Pennsylvania (PA) on our hugely popular Pennsylvania forum.