The median household income in La Esperanza, TX in 2022 was $17,729, which was 307.7% less than the median annual income of $72,284 across the entire state of Texas. Compared to the median income of $16,504 in 2000 this represents an increase of 6.9%. The per capita income in 2022 was $5,848, which means a decrease of 20.9% compared to 2000 when it was $7,069.
Whole page based on the data from 2000 / 2022 when the population of La Esperanza, Texas was 229 / 255
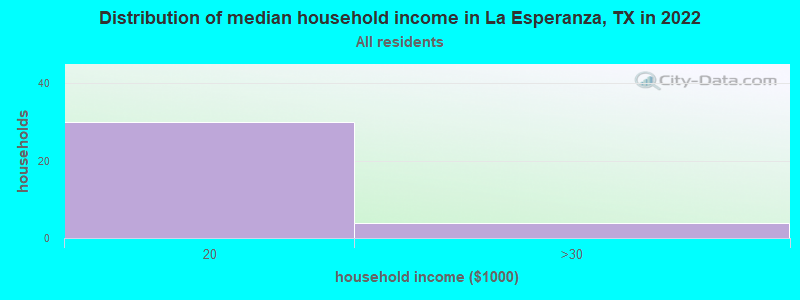
Income statistics for all residents
Median household income in La Esperanza, TX in 2022:
La Esperanza:
$17,730
Texas:
$72,284
Change in median household income between 2000 and 2022:
La Esperanza, Texas:
+7.4%
State:
+81.0%
Number of households with income < $10k:
La Esperanza:
0.0% (0)
State:
5.5% (611,011)
Number of households with income $10k - 20k:
La Esperanza:
88.2% (30)
State:
6.7% (743,157)
Number of households with income $20k - 30k:
La Esperanza:
11.8% (4)
State:
7.2% (803,381)
Number of households with income $30k - 40k:
La Esperanza:
0.0% (0)
State:
7.8% (866,080)
Number of households with income $40k - 50k:
La Esperanza:
0.0% (0)
State:
7.3% (810,440)
Number of households with income $50k - 60k:
La Esperanza:
0.0% (0)
State:
7.2% (799,783)
Number of households with income $60k - 75k:
La Esperanza:
0.0% (0)
State:
9.9% (1,095,384)
Number of households with income $75k - 100k:
La Esperanza:
0.0% (0)
Texas:
12.8% (1,419,057)
Number of households with income $100k - 125k:
La Esperanza:
0.0% (0)
Texas:
9.5% (1,054,577)
Number of households with income $125k - 150k:
La Esperanza:
0.0% (0)
Texas:
6.7% (741,518)
Number of households with income $150k - 200k:
La Esperanza:
0.0% (0)
State:
8.7% (961,776)
Number of households with income > $200k:
La Esperanza:
0.0% (0)
State:
10.7% (1,181,544)
Aggregate household income in La Esperanza in 2022: $1,008,615
Median family income in La Esperanza in 2022:
La Esperanza:
$18,113
State:
$86,267
Number of families with income $10k - 20k:
La Esperanza:
88.4% (35)
State:
4.3% (324,514)
Number of families with income $20k - 30k:
La Esperanza:
11.6% (5)
Texas:
5.8% (430,949)
Median per capita income in La Esperanza in 2022:
La Esperanza:
$5,848
State:
$38,123
Change in median per capita income between 2000 and 2022:: -17.3%
La Esperanza, Texas:
-17.3%
State:
+94.3%
Income statistics for White residents
Aggregate household income in La Esperanza in 2022: $1,592,296
Median per capita income in La Esperanza in 2022:
La Esperanza:
$6,280
Texas:
$47,740
Change in median per capita income between 2000 and 2022:: -8.8%
La Esperanza, Texas:
-8.8%
State:
+114.3%
Income statistics for Hispanic or Latino residents
Median household income in La Esperanza, TX in 2022:
La Esperanza:
$17,959
State:
$60,504
Change in median household income between 2000 and 2022:
La Esperanza, Texas:
+10.6%
Texas:
+102.5%
Number of households with income < $10k:
La Esperanza:
0.0% (0)
Texas:
5.8% (213,953)
Number of households with income $10k - 20k:
La Esperanza:
88.2% (30)
State:
8.0% (297,456)
Number of households with income $20k - 30k:
La Esperanza:
11.8% (4)
Texas:
9.2% (340,166)
Number of households with income $30k - 40k:
La Esperanza:
0.0% (0)
State:
9.5% (354,336)
Number of households with income $40k - 50k:
La Esperanza:
0.0% (0)
Texas:
8.8% (327,013)
Number of households with income $50k - 60k:
La Esperanza:
0.0% (0)
Texas:
8.3% (308,818)
Number of households with income $60k - 75k:
La Esperanza:
0.0% (0)
Texas:
10.9% (405,109)
Number of households with income $75k - 100k:
La Esperanza:
0.0% (0)
State:
13.8% (511,639)
Number of households with income $100k - 125k:
La Esperanza:
0.0% (0)
State:
8.6% (319,728)
Number of households with income $125k - 150k:
La Esperanza:
0.0% (0)
State:
5.7% (210,932)
Number of households with income $150k - 200k:
La Esperanza:
0.0% (0)
Texas:
6.4% (236,055)
Number of households with income > $200k:
La Esperanza:
0.0% (0)
State:
5.1% (189,259)
Aggregate household income in La Esperanza in 2022: $1,041,978
Median family income in La Esperanza in 2022:
La Esperanza:
$18,289
Texas:
$65,080
Number of families with income $10k - 20k:
La Esperanza:
88.6% (36)
State:
6.3% (174,531)
Number of families with income $20k - 30k:
La Esperanza:
11.4% (5)
Texas:
8.6% (238,528)
Median per capita income in La Esperanza in 2022:
La Esperanza:
$6,113
Texas:
$24,862
Change in median per capita income between 2000 and 2022:: -11.6%
La Esperanza, Texas:
-11.6%
State:
+130.8%
Income statistics for Multirace residents
Number of households with income < $10k:
La Esperanza:
0.0% (0)
State:
5.5% (122,324)
Number of households with income $10k - 20k:
La Esperanza:
100.0% (28)
Texas:
8.2% (182,232)
Number of households with income $20k - 30k:
La Esperanza:
0.0% (0)
Texas:
8.5% (189,456)
Number of households with income $30k - 40k:
La Esperanza:
0.0% (0)
Texas:
8.9% (197,499)
Number of households with income $40k - 50k:
La Esperanza:
0.0% (0)
State:
8.7% (191,735)
Number of households with income $50k - 60k:
La Esperanza:
0.0% (0)
State:
8.0% (177,535)
Number of households with income $60k - 75k:
La Esperanza:
0.0% (0)
State:
10.5% (232,479)
Number of households with income $75k - 100k:
La Esperanza:
0.0% (0)
State:
13.1% (290,448)
Number of households with income $100k - 125k:
La Esperanza:
0.0% (0)
Texas:
8.6% (191,595)
Number of households with income $125k - 150k:
La Esperanza:
0.0% (0)
Texas:
6.0% (133,361)
Number of households with income $150k - 200k:
La Esperanza:
0.0% (0)
State:
7.2% (159,195)
Number of households with income > $200k:
La Esperanza:
0.0% (0)
State:
6.7% (148,064)
Aggregate household income in La Esperanza in 2022: $685,492,300
Median per capita income in La Esperanza in 2022:
La Esperanza:
$6,217
Texas:
$26,785
Change in median per capita income between 2000 and 2022:: -33.7%
La Esperanza, Texas:
-33.7%
State:
+110.9%
Discuss La Esperanza, Texas (TX) on our hugely popular Texas forum.