The median household income in La Paloma-Lost Creek, TX in 2022 was $2,355, which was 2968.2% less than the median annual income of $72,284 across the entire state of Texas. Compared to the median income of $37,708 in 2000 this represents a decrease of 1500.6%. The per capita income in 2022 was $22,810, which means an increase of 56.4% compared to 2000 when it was $9,955.
Whole page based on the data from 2000 / 2022 when the population of La Paloma-Lost Creek, Texas was 323 / 618
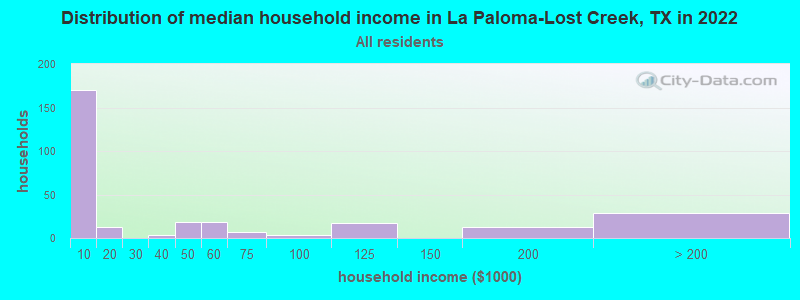
Income statistics for all residents
Median household income in La Paloma-Lost Creek, TX in 2022:
La Paloma-Lost Creek:
$2,356
State:
$72,284
Change in median household income between 2000 and 2022:: -93.8%
La Paloma-Lost Creek, Texas:
-93.8%
State:
+81.0%
Number of households with income < $10k:
La Paloma-Lost Creek:
58.2% (170)
State:
5.5% (611,011)
Number of households with income $10k - 20k:
La Paloma-Lost Creek:
4.5% (13)
State:
6.7% (743,157)
Number of households with income $20k - 30k:
La Paloma-Lost Creek:
0.0% (0)
Texas:
7.2% (803,381)
Number of households with income $30k - 40k:
La Paloma-Lost Creek:
1.0% (3)
Texas:
7.8% (866,080)
Number of households with income $40k - 50k:
La Paloma-Lost Creek:
6.2% (18)
State:
7.3% (810,440)
Number of households with income $50k - 60k:
La Paloma-Lost Creek:
6.2% (18)
Texas:
7.2% (799,783)
Number of households with income $60k - 75k:
La Paloma-Lost Creek:
2.4% (7)
Texas:
9.9% (1,095,384)
Number of households with income $75k - 100k:
La Paloma-Lost Creek:
1.4% (4)
Texas:
12.8% (1,419,057)
Number of households with income $100k - 125k:
La Paloma-Lost Creek:
5.8% (17)
State:
9.5% (1,054,577)
Number of households with income $125k - 150k:
La Paloma-Lost Creek:
0.0% (0)
Texas:
6.7% (741,518)
Number of households with income $150k - 200k:
La Paloma-Lost Creek:
4.5% (13)
State:
8.7% (961,776)
Number of households with income > $200k:
La Paloma-Lost Creek:
9.9% (29)
Texas:
10.7% (1,181,544)
Aggregate household income in La Paloma-Lost Creek in 2022: $13,228,215
Median non-family income in La Paloma-Lost Creek in 2022:
La Paloma-Lost Creek:
$2,549
Texas:
$45,999
Change in median non-family income between 2000 and 2022:: -88.3%
La Paloma-Lost Creek, Texas:
-88.3%
State:
+79.5%
Median per capita income in La Paloma-Lost Creek in 2022:
La Paloma-Lost Creek:
$22,810
Texas:
$38,123
Change in median per capita income between 2000 and 2022:
La Paloma-Lost Creek, Texas:
+129.1%
State:
+94.3%
Income statistics for White residents
Number of households with income < $10k:
La Paloma-Lost Creek:
0.0% (0)
State:
4.7% (273,716)
Number of households with income $10k - 20k:
La Paloma-Lost Creek:
0.0% (0)
State:
5.5% (322,702)
Number of households with income $20k - 30k:
La Paloma-Lost Creek:
0.0% (0)
Texas:
6.2% (363,947)
Number of households with income $30k - 40k:
La Paloma-Lost Creek:
1.9% (1)
State:
6.8% (399,275)
Number of households with income $40k - 50k:
La Paloma-Lost Creek:
15.4% (8)
State:
6.5% (383,417)
Number of households with income $50k - 60k:
La Paloma-Lost Creek:
19.2% (10)
State:
6.6% (388,535)
Number of households with income $60k - 75k:
La Paloma-Lost Creek:
0.0% (0)
State:
9.7% (566,295)
Number of households with income $75k - 100k:
La Paloma-Lost Creek:
5.8% (3)
State:
13.0% (760,276)
Number of households with income $100k - 125k:
La Paloma-Lost Creek:
3.8% (2)
Texas:
10.2% (597,596)
Number of households with income $125k - 150k:
La Paloma-Lost Creek:
0.0% (0)
State:
7.4% (436,830)
Number of households with income $150k - 200k:
La Paloma-Lost Creek:
0.0% (0)
Texas:
9.9% (583,067)
Number of households with income > $200k:
La Paloma-Lost Creek:
53.8% (28)
Texas:
13.5% (792,647)
Aggregate household income in La Paloma-Lost Creek in 2022: $6,688,605
Median per capita income in La Paloma-Lost Creek in 2022:
La Paloma-Lost Creek:
$33,676
State:
$47,740
Income statistics for Hispanic or Latino residents
Median household income in La Paloma-Lost Creek, TX in 2022:
La Paloma-Lost Creek:
$2,302
Texas:
$60,504
Change in median household income between 2000 and 2022:: -92.2%
La Paloma-Lost Creek, Texas:
-92.2%
State:
+102.5%
Number of households with income < $10k:
La Paloma-Lost Creek:
60.3% (173)
State:
5.8% (213,953)
Number of households with income $10k - 20k:
La Paloma-Lost Creek:
4.9% (14)
State:
8.0% (297,456)
Number of households with income $20k - 30k:
La Paloma-Lost Creek:
0.0% (0)
Texas:
9.2% (340,166)
Number of households with income $30k - 40k:
La Paloma-Lost Creek:
0.0% (0)
Texas:
9.5% (354,336)
Number of households with income $40k - 50k:
La Paloma-Lost Creek:
6.3% (18)
State:
8.8% (327,013)
Number of households with income $50k - 60k:
La Paloma-Lost Creek:
6.6% (19)
Texas:
8.3% (308,818)
Number of households with income $60k - 75k:
La Paloma-Lost Creek:
2.4% (7)
Texas:
10.9% (405,109)
Number of households with income $75k - 100k:
La Paloma-Lost Creek:
1.0% (3)
State:
13.8% (511,639)
Number of households with income $100k - 125k:
La Paloma-Lost Creek:
5.2% (15)
State:
8.6% (319,728)
Number of households with income $125k - 150k:
La Paloma-Lost Creek:
0.0% (0)
State:
5.7% (210,932)
Number of households with income $150k - 200k:
La Paloma-Lost Creek:
5.2% (15)
State:
6.4% (236,055)
Number of households with income > $200k:
La Paloma-Lost Creek:
8.0% (23)
Texas:
5.1% (189,259)
Aggregate household income in La Paloma-Lost Creek in 2022: $12,199,342
Median non-family income in La Paloma-Lost Creek in 2022:
La Paloma-Lost Creek:
$2,532
State:
$39,934
Change in median non-family income between 2000 and 2022:: -88.4%
La Paloma-Lost Creek, Texas:
-88.4%
State:
+109.1%
Median per capita income in La Paloma-Lost Creek in 2022:
La Paloma-Lost Creek:
$21,944
State:
$24,862
Change in median per capita income between 2000 and 2022:
La Paloma-Lost Creek, Texas:
+145.5%
State:
+130.8%
Income statistics for Multirace residents
Median household income in La Paloma-Lost Creek, TX in 2022:
La Paloma-Lost Creek:
$2,392
State:
$62,748
Change in median household income between 2000 and 2022:: -85.3%
La Paloma-Lost Creek, Texas:
-85.3%
State:
+92.3%
Number of households with income < $10k:
La Paloma-Lost Creek:
76.7% (227)
Texas:
5.5% (122,324)
Number of households with income $10k - 20k:
La Paloma-Lost Creek:
6.1% (18)
State:
8.2% (182,232)
Number of households with income $20k - 30k:
La Paloma-Lost Creek:
0.0% (0)
State:
8.5% (189,456)
Number of households with income $30k - 40k:
La Paloma-Lost Creek:
0.0% (0)
State:
8.9% (197,499)
Number of households with income $40k - 50k:
La Paloma-Lost Creek:
4.4% (13)
Texas:
8.7% (191,735)
Number of households with income $50k - 60k:
La Paloma-Lost Creek:
0.0% (0)
Texas:
8.0% (177,535)
Number of households with income $60k - 75k:
La Paloma-Lost Creek:
3.4% (10)
State:
10.5% (232,479)
Number of households with income $75k - 100k:
La Paloma-Lost Creek:
0.0% (0)
State:
13.1% (290,448)
Number of households with income $100k - 125k:
La Paloma-Lost Creek:
0.0% (0)
State:
8.6% (191,595)
Number of households with income $125k - 150k:
La Paloma-Lost Creek:
0.0% (0)
Texas:
6.0% (133,361)
Number of households with income $150k - 200k:
La Paloma-Lost Creek:
9.5% (28)
State:
7.2% (159,195)
Number of households with income > $200k:
La Paloma-Lost Creek:
0.0% (0)
State:
6.7% (148,064)
Aggregate household income in La Paloma-Lost Creek in 2022: $5,531,853
Median per capita income in La Paloma-Lost Creek in 2022:
La Paloma-Lost Creek:
$11,802
State:
$26,785
Change in median per capita income between 2000 and 2022:
La Paloma-Lost Creek, Texas:
+41.5%
State:
+110.9%
Income statistics for other residents
Aggregate household income in La Paloma-Lost Creek in 2022: $764,926
Median per capita income in La Paloma-Lost Creek in 2022:
La Paloma-Lost Creek:
$25,688
State:
$23,899
Change in median per capita income between 2000 and 2022:
La Paloma-Lost Creek, Texas:
+121.6%
State:
+135.2%
Discuss La Paloma-Lost Creek, Texas (TX) on our hugely popular Texas forum.