The median household income in Lake Morton-Berrydale, WA in 2022 was $121,183, which was 24.7% greater than the median annual income of $91,306 across the entire state of Washington. Compared to the median income of $75,337 in 2000 this represents an increase of 37.8%. The per capita income in 2022 was $56,761, which means an increase of 48.9% compared to 2000 when it was $28,980.
Whole page based on the data from 2000 / 2022 when the population of Lake Morton-Berrydale, Washington was 9,659 / 10,515
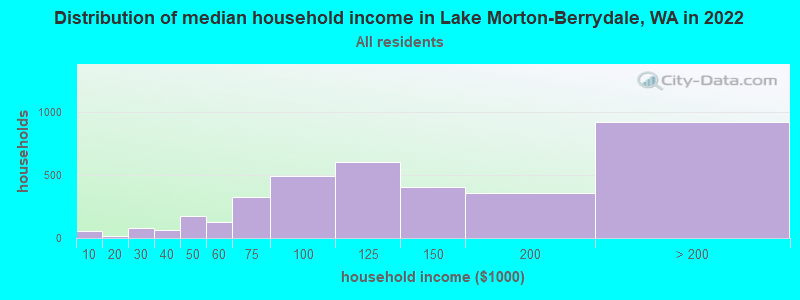
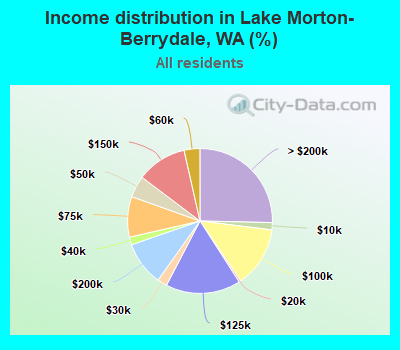
Income statistics for all residents
Median household income in Lake Morton-Berrydale, WA in 2022:
Lake Morton-Berrydale:
$121,183
State:
$91,306
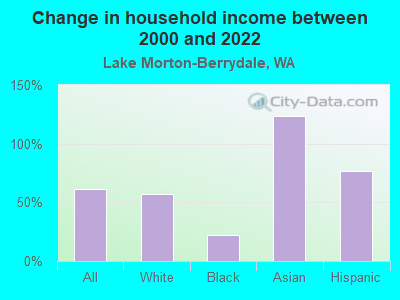
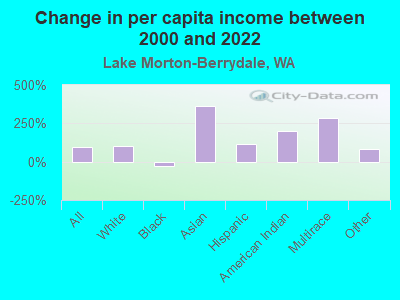
Change in median household income between 2000 and 2022:
Lake Morton-Berrydale, Washington:
+60.9%
State:
+99.5%
Number of households with income < $10k:
Lake Morton-Berrydale:
1.6% (58)
State:
4.5% (139,331)
Number of households with income $10k - 20k:
Lake Morton-Berrydale:
0.4% (16)
State:
5.0% (154,508)
Number of households with income $20k - 30k:
Lake Morton-Berrydale:
2.2% (79)
State:
5.4% (166,555)
Number of households with income $30k - 40k:
Lake Morton-Berrydale:
1.7% (62)
Washington:
5.5% (170,324)
Number of households with income $40k - 50k:
Lake Morton-Berrydale:
4.8% (175)
Washington:
6.0% (183,941)
Number of households with income $50k - 60k:
Lake Morton-Berrydale:
3.5% (128)
State:
6.1% (187,395)
Number of households with income $60k - 75k:
Lake Morton-Berrydale:
9.1% (329)
Washington:
8.7% (266,771)
Number of households with income $75k - 100k:
Lake Morton-Berrydale:
13.5% (491)
State:
13.1% (404,672)
Number of households with income $100k - 125k:
Lake Morton-Berrydale:
16.7% (607)
Washington:
11.0% (337,911)
Number of households with income $125k - 150k:
Lake Morton-Berrydale:
11.2% (406)
Washington:
8.0% (244,934)
Number of households with income $150k - 200k:
Lake Morton-Berrydale:
9.9% (358)
State:
10.5% (323,812)
Number of households with income > $200k:
Lake Morton-Berrydale:
25.4% (921)
State:
16.2% (499,799)
Aggregate household income in Lake Morton-Berrydale in 2022: $592,982,472
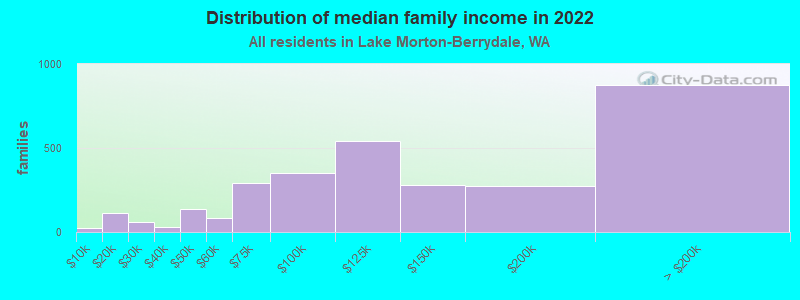
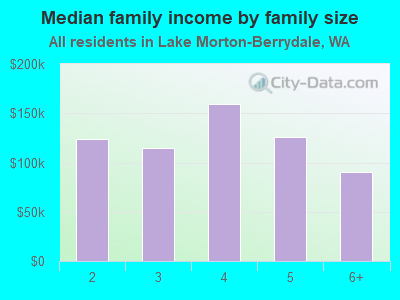
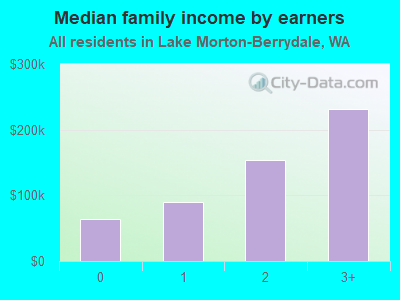
Median family income in Lake Morton-Berrydale in 2022:
Lake Morton-Berrydale:
$123,986
State:
$109,192
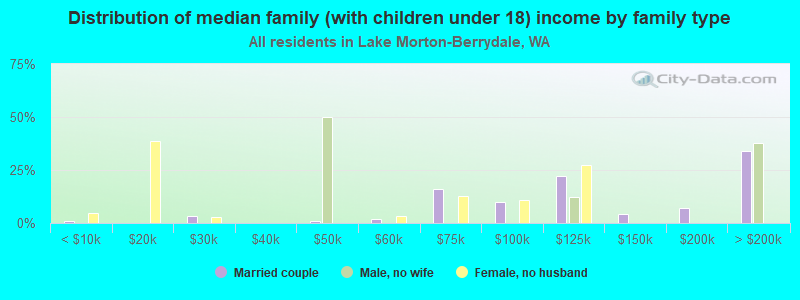
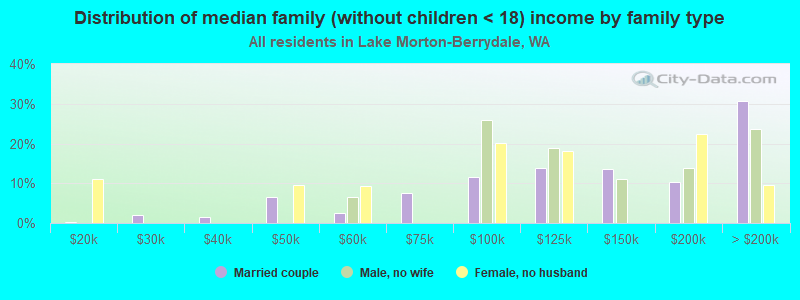
Number of families with income < $10k:
Lake Morton-Berrydale:
0.7% (21)
Washington:
2.9% (55,953)
Number of families with income $10k - 20k:
Lake Morton-Berrydale:
3.7% (113)
Washington:
2.6% (50,138)
Number of families with income $20k - 30k:
Lake Morton-Berrydale:
2.0% (60)
State:
3.2% (61,974)
Number of families with income $30k - 40k:
Lake Morton-Berrydale:
1.0% (31)
State:
4.1% (80,240)
Number of families with income $40k - 50k:
Lake Morton-Berrydale:
4.4% (135)
Washington:
4.9% (94,310)
Number of families with income $50k - 60k:
Lake Morton-Berrydale:
2.7% (83)
State:
5.3% (101,674)
Number of families with income $60k - 75k:
Lake Morton-Berrydale:
9.6% (292)
Washington:
8.2% (158,348)
Number of families with income $75k - 100k:
Lake Morton-Berrydale:
11.5% (352)
Washington:
13.8% (267,812)
Number of families with income $100k - 125k:
Lake Morton-Berrydale:
17.8% (542)
State:
12.4% (240,213)
Number of families with income $125k - 150k:
Lake Morton-Berrydale:
9.1% (278)
State:
9.3% (180,011)
Number of families with income $150k - 200k:
Lake Morton-Berrydale:
8.9% (271)
State:
13.0% (250,874)
Number of families with income > $200k:
Lake Morton-Berrydale:
28.6% (873)
State:
20.4% (393,898)
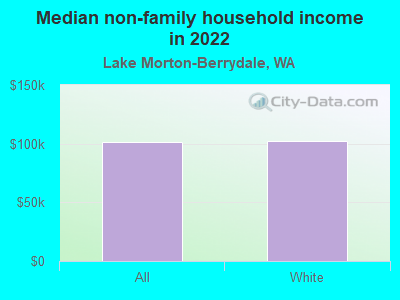
Median non-family income in Lake Morton-Berrydale in 2022:
Lake Morton-Berrydale:
$101,515
State:
$57,299
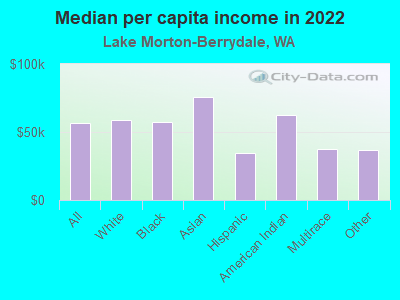
Median per capita income in Lake Morton-Berrydale in 2022:
Lake Morton-Berrydale:
$56,762
Washington:
$50,764
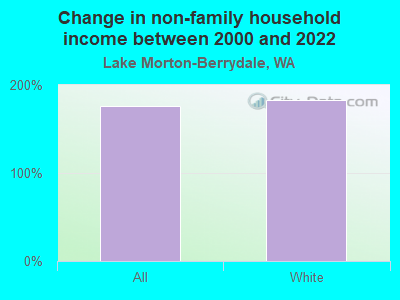
Change in median per capita income between 2000 and 2022:
Lake Morton-Berrydale, Washington:
+95.9%
State:
+121.0%
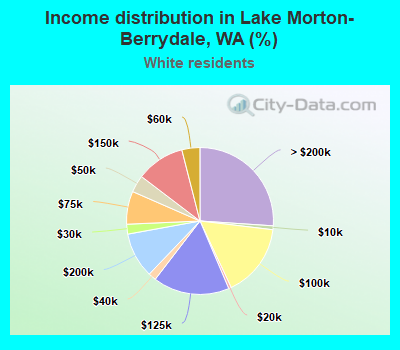
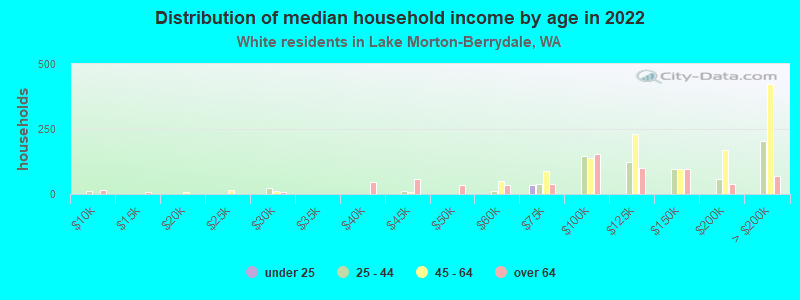
Income statistics for White residents
Median household income in Lake Morton-Berrydale, WA in 2022:
Lake Morton-Berrydale:
$120,938
State:
$91,916
Change in median household income between 2000 and 2022:
Lake Morton-Berrydale, Washington:
+56.9%
State:
+95.4%
Number of households with income < $10k:
Lake Morton-Berrydale:
0.8% (23)
State:
4.3% (95,850)
Number of households with income $10k - 20k:
Lake Morton-Berrydale:
0.6% (16)
State:
4.8% (106,421)
Number of households with income $20k - 30k:
Lake Morton-Berrydale:
2.2% (59)
State:
5.5% (122,860)
Number of households with income $30k - 40k:
Lake Morton-Berrydale:
1.7% (47)
State:
5.4% (119,627)
Number of households with income $40k - 50k:
Lake Morton-Berrydale:
3.8% (103)
State:
5.9% (132,276)
Number of households with income $50k - 60k:
Lake Morton-Berrydale:
4.0% (108)
State:
6.1% (136,212)
Number of households with income $60k - 75k:
Lake Morton-Berrydale:
7.3% (198)
State:
8.8% (196,086)
Number of households with income $75k - 100k:
Lake Morton-Berrydale:
16.1% (439)
State:
13.4% (299,192)
Number of households with income $100k - 125k:
Lake Morton-Berrydale:
16.8% (458)
Washington:
11.3% (252,209)
Number of households with income $125k - 150k:
Lake Morton-Berrydale:
10.7% (291)
State:
7.9% (175,962)
Number of households with income $150k - 200k:
Lake Morton-Berrydale:
10.0% (272)
State:
10.7% (239,156)
Number of households with income > $200k:
Lake Morton-Berrydale:
26.1% (710)
State:
16.1% (359,917)
Aggregate household income in Lake Morton-Berrydale in 2022: $429,856,788
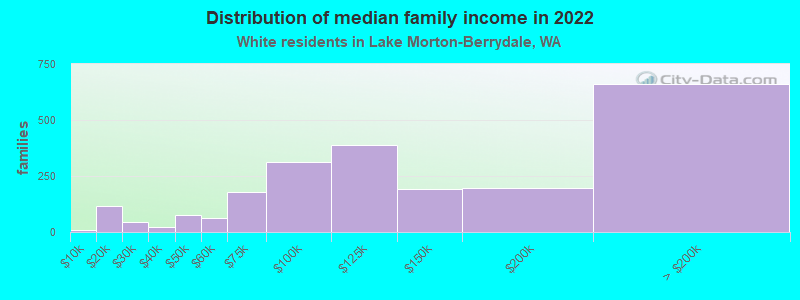
Median family income in Lake Morton-Berrydale in 2022:
Lake Morton-Berrydale:
$125,057
State:
$112,511
Number of families with income < $10k:
Lake Morton-Berrydale:
0.4% (9)
Washington:
2.4% (33,676)
Number of families with income $10k - 20k:
Lake Morton-Berrydale:
5.0% (114)
State:
2.0% (28,228)
Number of families with income $20k - 30k:
Lake Morton-Berrydale:
2.0% (45)
State:
2.9% (39,288)
Number of families with income $30k - 40k:
Lake Morton-Berrydale:
1.0% (22)
State:
3.6% (50,190)
Number of families with income $40k - 50k:
Lake Morton-Berrydale:
3.4% (78)
State:
4.6% (63,009)
Number of families with income $50k - 60k:
Lake Morton-Berrydale:
2.8% (62)
Washington:
5.0% (69,270)
Number of families with income $60k - 75k:
Lake Morton-Berrydale:
7.9% (179)
State:
8.2% (112,369)
Number of families with income $75k - 100k:
Lake Morton-Berrydale:
13.8% (312)
State:
14.1% (194,214)
Number of families with income $100k - 125k:
Lake Morton-Berrydale:
17.2% (388)
State:
13.2% (182,184)
Number of families with income $125k - 150k:
Lake Morton-Berrydale:
8.4% (190)
State:
9.5% (130,928)
Number of families with income $150k - 200k:
Lake Morton-Berrydale:
8.6% (195)
Washington:
13.7% (188,621)
Number of families with income > $200k:
Lake Morton-Berrydale:
29.4% (662)
Washington:
20.8% (285,982)
Median non-family income in Lake Morton-Berrydale in 2022:
Lake Morton-Berrydale:
$102,110
State:
$56,103
Median per capita income in Lake Morton-Berrydale in 2022:
Lake Morton-Berrydale:
$59,138
Washington:
$55,212
Change in median per capita income between 2000 and 2022:
Lake Morton-Berrydale, Washington:
+101.5%
Washington:
+123.8%
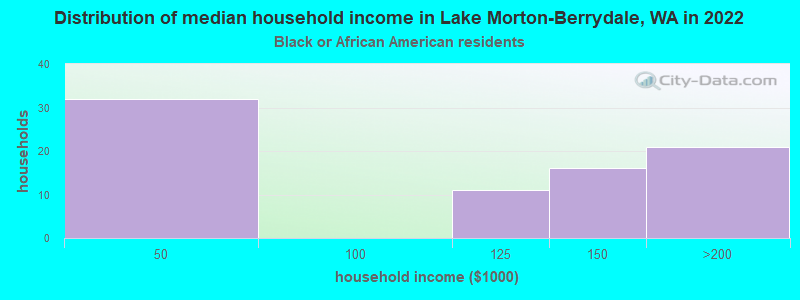
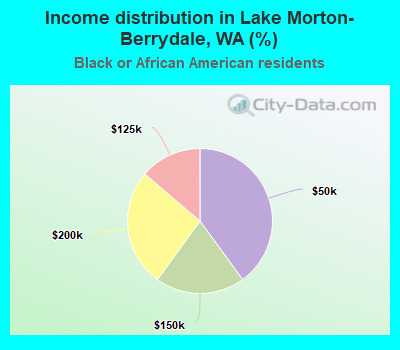
Income statistics for Black or African American residents
Median household income in Lake Morton-Berrydale, WA in 2022:
Lake Morton-Berrydale:
$127,294
State:
$68,202
Change in median household income between 2000 and 2022:
Lake Morton-Berrydale, Washington:
+21.9%
Washington:
+89.9%
Number of households with income < $10k:
Lake Morton-Berrydale:
0.0% (0)
Washington:
7.2% (8,014)
Number of households with income $10k - 20k:
Lake Morton-Berrydale:
0.0% (0)
State:
8.0% (8,904)
Number of households with income $20k - 30k:
Lake Morton-Berrydale:
0.0% (0)
State:
7.4% (8,207)
Number of households with income $30k - 40k:
Lake Morton-Berrydale:
0.0% (0)
State:
5.6% (6,220)
Number of households with income $40k - 50k:
Lake Morton-Berrydale:
40.0% (32)
Washington:
9.5% (10,585)
Number of households with income $50k - 60k:
Lake Morton-Berrydale:
0.0% (0)
Washington:
7.3% (8,078)
Number of households with income $60k - 75k:
Lake Morton-Berrydale:
0.0% (0)
State:
8.7% (9,704)
Number of households with income $75k - 100k:
Lake Morton-Berrydale:
0.0% (0)
State:
12.9% (14,315)
Number of households with income $100k - 125k:
Lake Morton-Berrydale:
13.8% (11)
State:
7.7% (8,592)
Number of households with income $125k - 150k:
Lake Morton-Berrydale:
20.0% (16)
Washington:
8.9% (9,840)
Number of households with income $150k - 200k:
Lake Morton-Berrydale:
26.2% (21)
State:
7.6% (8,434)
Number of households with income > $200k:
Lake Morton-Berrydale:
0.0% (0)
Washington:
9.1% (10,075)
Aggregate household income in Lake Morton-Berrydale in 2022: $8,003,215
Median per capita income in Lake Morton-Berrydale in 2022:
Lake Morton-Berrydale:
$57,082
State:
$38,209
Change in median per capita income between 2000 and 2022:: -26.5%
Lake Morton-Berrydale, Washington:
-26.5%
State:
+115.3%
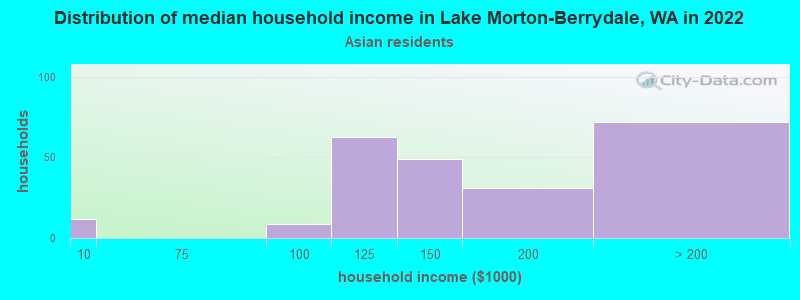
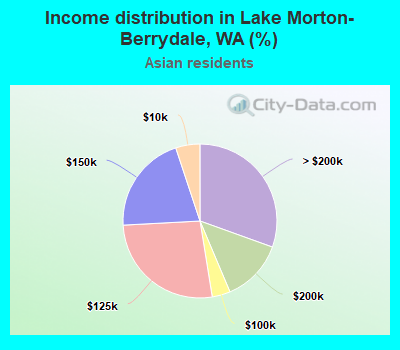
Income statistics for Asian residents
Median household income in Lake Morton-Berrydale, WA in 2022:
Lake Morton-Berrydale:
$147,050
State:
$125,692
Change in median household income between 2000 and 2022:
Lake Morton-Berrydale, Washington:
+123.8%
State:
+164.5%
Number of households with income < $10k:
Lake Morton-Berrydale:
5.1% (12)
State:
4.9% (14,099)
Number of households with income $10k - 20k:
Lake Morton-Berrydale:
0.0% (0)
Washington:
3.5% (9,873)
Number of households with income $20k - 30k:
Lake Morton-Berrydale:
0.0% (0)
State:
2.9% (8,352)
Number of households with income $30k - 40k:
Lake Morton-Berrydale:
0.0% (0)
State:
4.0% (11,415)
Number of households with income $40k - 50k:
Lake Morton-Berrydale:
0.0% (0)
State:
4.0% (11,421)
Number of households with income $50k - 60k:
Lake Morton-Berrydale:
0.0% (0)
Washington:
4.2% (12,100)
Number of households with income $60k - 75k:
Lake Morton-Berrydale:
0.0% (0)
Washington:
6.3% (17,903)
Number of households with income $75k - 100k:
Lake Morton-Berrydale:
3.8% (9)
Washington:
10.4% (29,663)
Number of households with income $100k - 125k:
Lake Morton-Berrydale:
26.7% (63)
State:
9.4% (26,839)
Number of households with income $125k - 150k:
Lake Morton-Berrydale:
20.8% (49)
Washington:
8.5% (24,200)
Number of households with income $150k - 200k:
Lake Morton-Berrydale:
13.1% (31)
State:
12.6% (35,976)
Number of households with income > $200k:
Lake Morton-Berrydale:
30.5% (72)
State:
29.2% (83,109)
Aggregate household income in Lake Morton-Berrydale in 2022: $69,102,737
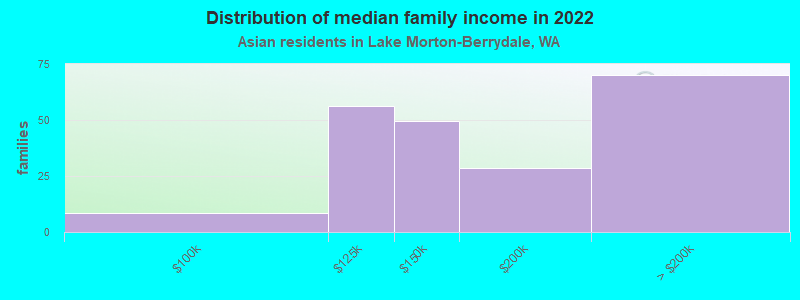
Median family income in Lake Morton-Berrydale in 2022:
Lake Morton-Berrydale:
$148,196
State:
$143,595
Number of families with income $75k - 100k:
Lake Morton-Berrydale:
4.0% (9)
State:
11.7% (21,919)
Number of families with income $100k - 125k:
Lake Morton-Berrydale:
26.5% (56)
Washington:
9.3% (17,280)
Number of families with income $125k - 150k:
Lake Morton-Berrydale:
23.2% (49)
Washington:
8.4% (15,602)
Number of families with income $150k - 200k:
Lake Morton-Berrydale:
13.4% (29)
State:
13.3% (24,789)
Number of families with income > $200k:
Lake Morton-Berrydale:
32.9% (70)
State:
34.4% (64,250)
Median per capita income in Lake Morton-Berrydale in 2022:
Lake Morton-Berrydale:
$75,735
State:
$67,666
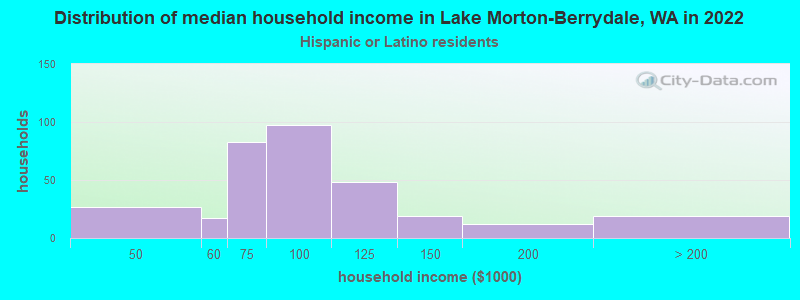
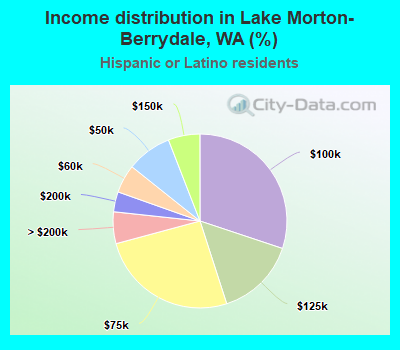
Income statistics for Hispanic or Latino residents
Median household income in Lake Morton-Berrydale, WA in 2022:
Lake Morton-Berrydale:
$96,170
Washington:
$74,770
Change in median household income between 2000 and 2022:
Lake Morton-Berrydale, Washington:
+77.4%
State:
+128.3%
Number of households with income < $10k:
Lake Morton-Berrydale:
0.0% (0)
State:
4.9% (14,456)
Number of households with income $10k - 20k:
Lake Morton-Berrydale:
0.0% (0)
State:
5.3% (15,449)
Number of households with income $20k - 30k:
Lake Morton-Berrydale:
0.0% (0)
Washington:
6.8% (20,016)
Number of households with income $30k - 40k:
Lake Morton-Berrydale:
0.0% (0)
Washington:
7.7% (22,548)
Number of households with income $40k - 50k:
Lake Morton-Berrydale:
8.4% (27)
State:
7.3% (21,450)
Number of households with income $50k - 60k:
Lake Morton-Berrydale:
5.3% (17)
State:
7.7% (22,744)
Number of households with income $60k - 75k:
Lake Morton-Berrydale:
25.8% (83)
State:
10.5% (30,737)
Number of households with income $75k - 100k:
Lake Morton-Berrydale:
30.1% (97)
State:
14.9% (43,843)
Number of households with income $100k - 125k:
Lake Morton-Berrydale:
14.9% (48)
Washington:
11.1% (32,554)
Number of households with income $125k - 150k:
Lake Morton-Berrydale:
5.9% (19)
Washington:
7.4% (21,624)
Number of households with income $150k - 200k:
Lake Morton-Berrydale:
3.7% (12)
State:
7.3% (21,360)
Number of households with income > $200k:
Lake Morton-Berrydale:
5.9% (19)
Washington:
9.2% (27,055)
Aggregate household income in Lake Morton-Berrydale in 2022: $36,773,878
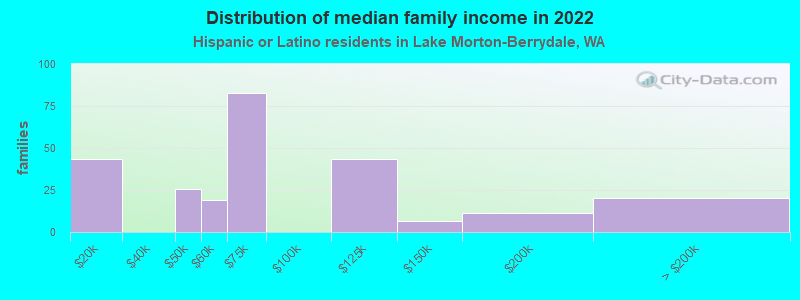
Median family income in Lake Morton-Berrydale in 2022:
Lake Morton-Berrydale:
$61,490
State:
$76,866
Number of families with income $10k - 20k:
Lake Morton-Berrydale:
17.3% (44)
Washington:
3.5% (7,524)
Number of families with income $40k - 50k:
Lake Morton-Berrydale:
10.2% (26)
State:
7.7% (16,361)
Number of families with income $50k - 60k:
Lake Morton-Berrydale:
7.5% (19)
Washington:
7.9% (16,852)
Number of families with income $60k - 75k:
Lake Morton-Berrydale:
32.7% (83)
Washington:
11.4% (24,342)
Number of families with income $100k - 125k:
Lake Morton-Berrydale:
17.2% (43)
Washington:
11.4% (24,331)
Number of families with income $125k - 150k:
Lake Morton-Berrydale:
2.7% (7)
State:
7.5% (16,099)
Number of families with income $150k - 200k:
Lake Morton-Berrydale:
4.4% (11)
State:
8.2% (17,551)
Number of families with income > $200k:
Lake Morton-Berrydale:
8.0% (20)
State:
9.7% (20,653)
Median per capita income in Lake Morton-Berrydale in 2022:
Lake Morton-Berrydale:
$34,868
Washington:
$28,252
Change in median per capita income between 2000 and 2022:
Lake Morton-Berrydale, Washington:
+113.1%
State:
+150.2%
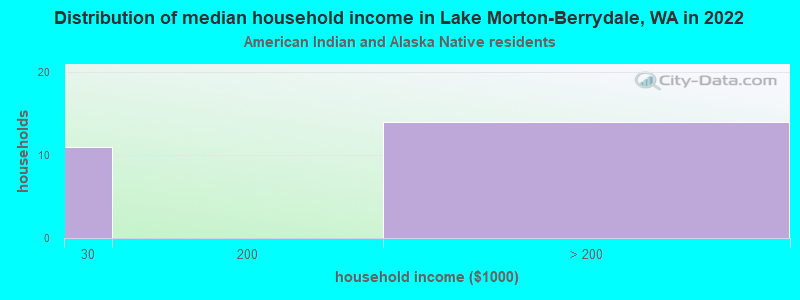
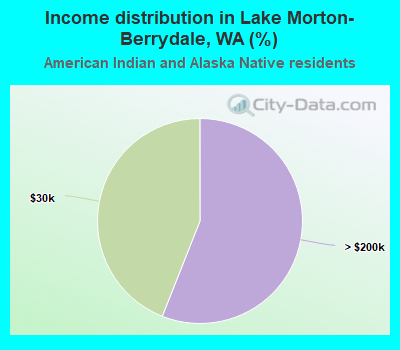
Income statistics for American Indian and Alaska Native residents
Number of households with income < $10k:
Lake Morton-Berrydale:
0.0% (0)
State:
5.9% (1,768)
Number of households with income $10k - 20k:
Lake Morton-Berrydale:
0.0% (0)
Washington:
8.9% (2,694)
Number of households with income $20k - 30k:
Lake Morton-Berrydale:
44.0% (11)
Washington:
8.0% (2,412)
Number of households with income $30k - 40k:
Lake Morton-Berrydale:
0.0% (0)
State:
7.7% (2,327)
Number of households with income $40k - 50k:
Lake Morton-Berrydale:
0.0% (0)
Washington:
5.8% (1,755)
Number of households with income $50k - 60k:
Lake Morton-Berrydale:
0.0% (0)
State:
7.5% (2,259)
Number of households with income $60k - 75k:
Lake Morton-Berrydale:
0.0% (0)
State:
8.8% (2,669)
Number of households with income $75k - 100k:
Lake Morton-Berrydale:
0.0% (0)
Washington:
12.8% (3,861)
Number of households with income $100k - 125k:
Lake Morton-Berrydale:
0.0% (0)
State:
12.0% (3,618)
Number of households with income $125k - 150k:
Lake Morton-Berrydale:
0.0% (0)
State:
8.6% (2,580)
Number of households with income $150k - 200k:
Lake Morton-Berrydale:
0.0% (0)
State:
5.9% (1,774)
Number of households with income > $200k:
Lake Morton-Berrydale:
56.0% (14)
Washington:
8.1% (2,447)
Aggregate household income in Lake Morton-Berrydale in 2022: $3,513,226
Median per capita income in Lake Morton-Berrydale in 2022:
Lake Morton-Berrydale:
$62,686
Washington:
$27,053
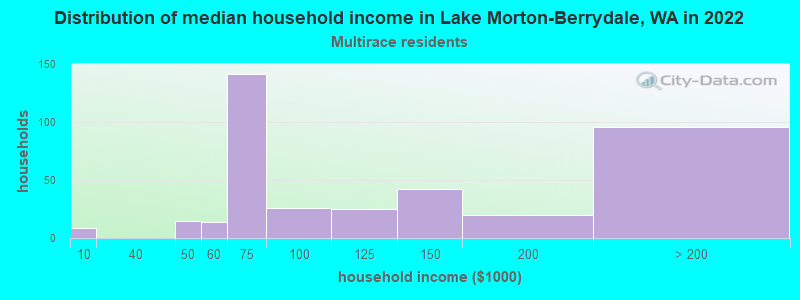
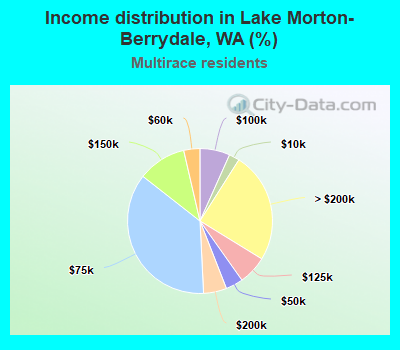
Income statistics for Multirace residents
Number of households with income < $10k:
Lake Morton-Berrydale:
2.3% (9)
Washington:
4.3% (12,040)
Number of households with income $10k - 20k:
Lake Morton-Berrydale:
0.0% (0)
Washington:
6.6% (18,437)
Number of households with income $20k - 30k:
Lake Morton-Berrydale:
0.0% (0)
State:
5.2% (14,559)
Number of households with income $30k - 40k:
Lake Morton-Berrydale:
0.0% (0)
State:
6.7% (18,491)
Number of households with income $40k - 50k:
Lake Morton-Berrydale:
3.9% (15)
Washington:
6.3% (17,459)
Number of households with income $50k - 60k:
Lake Morton-Berrydale:
3.6% (14)
Washington:
6.9% (19,086)
Number of households with income $60k - 75k:
Lake Morton-Berrydale:
36.3% (141)
State:
9.1% (25,310)
Number of households with income $75k - 100k:
Lake Morton-Berrydale:
6.7% (26)
State:
13.5% (37,493)
Number of households with income $100k - 125k:
Lake Morton-Berrydale:
6.4% (25)
State:
10.7% (29,626)
Number of households with income $125k - 150k:
Lake Morton-Berrydale:
10.8% (42)
State:
8.6% (23,899)
Number of households with income $150k - 200k:
Lake Morton-Berrydale:
5.2% (20)
State:
10.2% (28,214)
Number of households with income > $200k:
Lake Morton-Berrydale:
24.7% (96)
Washington:
11.9% (32,947)
Aggregate household income in Lake Morton-Berrydale in 2022: $58,740,437
Median per capita income in Lake Morton-Berrydale in 2022:
Lake Morton-Berrydale:
$37,827
Washington:
$32,496
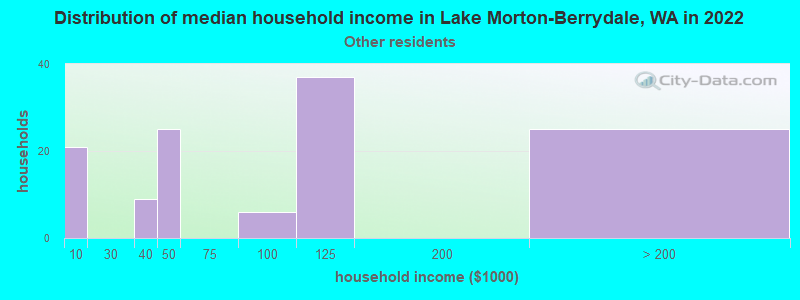
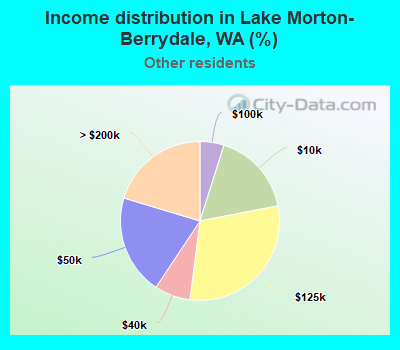
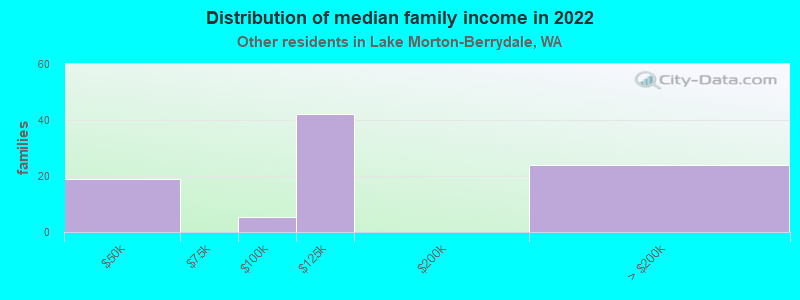
Income statistics for other residents
Number of households with income < $10k:
Lake Morton-Berrydale:
17.1% (21)
Washington:
5.3% (6,540)
Number of households with income $10k - 20k:
Lake Morton-Berrydale:
0.0% (0)
State:
6.0% (7,385)
Number of households with income $20k - 30k:
Lake Morton-Berrydale:
0.0% (0)
State:
7.5% (9,289)
Number of households with income $30k - 40k:
Lake Morton-Berrydale:
7.3% (9)
State:
8.9% (11,015)
Number of households with income $40k - 50k:
Lake Morton-Berrydale:
20.3% (25)
State:
7.6% (9,399)
Number of households with income $50k - 60k:
Lake Morton-Berrydale:
0.0% (0)
State:
7.2% (8,867)
Number of households with income $60k - 75k:
Lake Morton-Berrydale:
0.0% (0)
State:
10.5% (13,032)
Number of households with income $75k - 100k:
Lake Morton-Berrydale:
4.9% (6)
Washington:
14.6% (18,007)
Number of households with income $100k - 125k:
Lake Morton-Berrydale:
30.1% (37)
State:
12.2% (15,128)
Number of households with income $125k - 150k:
Lake Morton-Berrydale:
0.0% (0)
Washington:
5.6% (6,950)
Number of households with income $150k - 200k:
Lake Morton-Berrydale:
0.0% (0)
State:
7.1% (8,749)
Number of households with income > $200k:
Lake Morton-Berrydale:
20.3% (25)
State:
7.5% (9,208)
Aggregate household income in Lake Morton-Berrydale in 2022: $17,371,325
Median family income in Lake Morton-Berrydale in 2022:
Lake Morton-Berrydale:
$135,871
Washington:
$72,588
Number of families with income $40k - 50k:
Lake Morton-Berrydale:
21.0% (19)
Washington:
8.0% (7,634)
Number of families with income $75k - 100k:
Lake Morton-Berrydale:
5.8% (5)
State:
14.5% (13,800)
Number of families with income $100k - 125k:
Lake Morton-Berrydale:
46.6% (42)
State:
12.9% (12,298)
Number of families with income > $200k:
Lake Morton-Berrydale:
26.6% (24)
Washington:
7.1% (6,764)
Median per capita income in Lake Morton-Berrydale in 2022:
Lake Morton-Berrydale:
$36,917
State:
$27,542
Change in median per capita income between 2000 and 2022:
Lake Morton-Berrydale, Washington:
+83.0%
Washington:
+167.8%
Discuss Lake Morton-Berrydale, Washington (WA) on our hugely popular Washington forum.