Lake Quinault, Washington (WA) income map, earnings map, and wages data
The median household income in Lake Quinault, WA in 2022 was $65,694, which was 39.0% less than the median annual income of $91,306 across the entire state of Washington. Compared to the median income of $35,893 in 2000 this represents an increase of 45.4%. The per capita income in 2022 was $34,327, which means an increase of 48.7% compared to 2000 when it was $17,627.
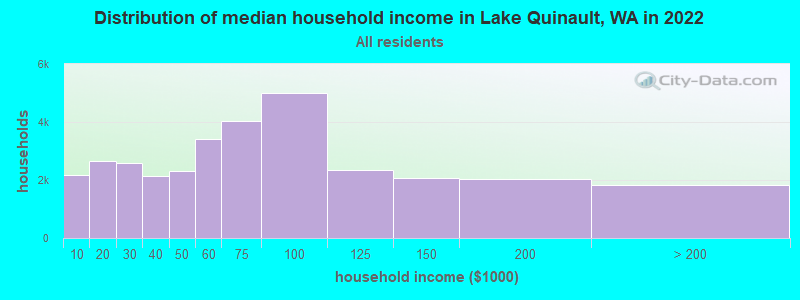
Income statistics for all residents
Median household income in Lake Quinault, WA in 2022:| Lake Quinault: | $65,695 |
| State: | $91,306 |
Change in median household income between 2000 and 2022:| Lake Quinault, Washington: | +83.0% |
| State: | +99.5% |
Number of households with income < $10k:| Lake Quinault: | 6.7% (2,169) |
| State: | 4.5% (139,331) |
Number of households with income $10k - 20k:| Lake Quinault: | 8.1% (2,647) |
| Washington: | 5.0% (154,508) |
Number of households with income $20k - 30k:| Lake Quinault: | 8.0% (2,603) |
| State: | 5.4% (166,555) |
Number of households with income $30k - 40k:| Lake Quinault: | 6.5% (2,121) |
| State: | 5.5% (170,324) |
Number of households with income $40k - 50k:| Lake Quinault: | 7.1% (2,317) |
| State: | 6.0% (183,941) |
Number of households with income $50k - 60k:| Lake Quinault: | 10.4% (3,401) |
| Washington: | 6.1% (187,395) |
Number of households with income $60k - 75k:| Lake Quinault: | 12.3% (4,022) |
| State: | 8.7% (266,771) |
Number of households with income $75k - 100k:| Lake Quinault: | 15.3% (4,988) |
| State: | 13.1% (404,672) |
Number of households with income $100k - 125k:| Lake Quinault: | 7.2% (2,356) |
| State: | 11.0% (337,911) |
Number of households with income $125k - 150k:| Lake Quinault: | 6.4% (2,075) |
| Washington: | 8.0% (244,934) |
Number of households with income $150k - 200k:| Lake Quinault: | 6.3% (2,051) |
| State: | 10.5% (323,812) |
Number of households with income > $200k:| Lake Quinault: | 5.6% (1,818) |
| State: | 16.2% (499,799) |
Aggregate household income in Lake Quinault in 2022: $28,385,740
Median family income in Lake Quinault in 2022:| Lake Quinault: | $81,742 |
| State: | $109,192 |
Median non-family income in Lake Quinault in 2022:| Lake Quinault: | $51,675 |
| State: | $57,299 |
Change in median non-family income between 2000 and 2022:| Lake Quinault, Washington: | +108.4% |
| Washington: | +94.9% |
Median per capita income in Lake Quinault in 2022:| Lake Quinault: | $34,327 |
| Washington: | $50,764 |
Change in median per capita income between 2000 and 2022:| Lake Quinault, Washington: | +94.7% |
| Washington: | +121.0% |
Income statistics for White residents
Median household income in Lake Quinault, WA in 2022:| Lake Quinault: | $69,372 |
| State: | $91,916 |
Change in median household income between 2000 and 2022:| Lake Quinault, Washington: | +83.5% |
| Washington: | +95.4% |
Number of households with income < $10k:| Lake Quinault: | 6.7% (1,900) |
| State: | 4.3% (95,850) |
Number of households with income $10k - 20k:| Lake Quinault: | 7.8% (2,205) |
| Washington: | 4.8% (106,421) |
Number of households with income $20k - 30k:| Lake Quinault: | 7.8% (2,197) |
| Washington: | 5.5% (122,860) |
Number of households with income $30k - 40k:| Lake Quinault: | 5.3% (1,504) |
| Washington: | 5.4% (119,627) |
Number of households with income $40k - 50k:| Lake Quinault: | 7.0% (1,972) |
| State: | 5.9% (132,276) |
Number of households with income $50k - 60k:| Lake Quinault: | 10.9% (3,069) |
| Washington: | 6.1% (136,212) |
Number of households with income $60k - 75k:| Lake Quinault: | 11.7% (3,322) |
| State: | 8.8% (196,086) |
Number of households with income $75k - 100k:| Lake Quinault: | 16.1% (4,558) |
| Washington: | 13.4% (299,192) |
Number of households with income $100k - 125k:| Lake Quinault: | 7.2% (2,034) |
| State: | 11.3% (252,209) |
Number of households with income $125k - 150k:| Lake Quinault: | 6.4% (1,811) |
| Washington: | 7.9% (175,962) |
Number of households with income $150k - 200k:| Lake Quinault: | 6.9% (1,950) |
| Washington: | 10.7% (239,156) |
Number of households with income > $200k:| Lake Quinault: | 6.2% (1,753) |
| State: | 16.1% (359,917) |
Aggregate household income in Lake Quinault in 2022: $24,830,989
Median family income in Lake Quinault in 2022:| Lake Quinault: | $84,602 |
| Washington: | $112,511 |
Number of families with income < $10k:| Lake Quinault: | 1.3% (2) |
| State: | 2.4% (33,676) |
Number of families with income $10k - 20k:| Lake Quinault: | 2.4% (4) |
| State: | 2.0% (28,228) |
Number of families with income $20k - 30k:| Lake Quinault: | 1.4% (2) |
| Washington: | 2.9% (39,288) |
Number of families with income $30k - 40k:| Lake Quinault: | 4.3% (8) |
| State: | 3.6% (50,190) |
Number of families with income $40k - 50k:| Lake Quinault: | 7.1% (13) |
| State: | 4.6% (63,009) |
Number of families with income $50k - 60k:| Lake Quinault: | 4.6% (8) |
| State: | 5.0% (69,270) |
Number of families with income $60k - 75k:| Lake Quinault: | 17.8% (32) |
| Washington: | 8.2% (112,369) |
Number of families with income $75k - 100k:| Lake Quinault: | 23.7% (43) |
| State: | 14.1% (194,214) |
Number of families with income $100k - 125k:| Lake Quinault: | 13.0% (23) |
| Washington: | 13.2% (182,184) |
Number of families with income $125k - 150k:| Lake Quinault: | 15.9% (29) |
| State: | 9.5% (130,928) |
Number of families with income $150k - 200k:| Lake Quinault: | 8.5% (15) |
| State: | 13.7% (188,621) |
Median non-family income in Lake Quinault in 2022:| Lake Quinault: | $54,363 |
| Washington: | $56,103 |
Change in median non-family income between 2000 and 2022:| Lake Quinault, Washington: | +104.7% |
| State: | +87.7% |
Median per capita income in Lake Quinault in 2022:| Lake Quinault: | $37,464 |
| State: | $55,212 |
Change in median per capita income between 2000 and 2022:| Lake Quinault, Washington: | +102.3% |
| Washington: | +123.8% |
Income statistics for Asian residents
Number of households with income < $10k:| Lake Quinault: | 4.9% (13,300) |
| State: | 4.9% (14,099) |
Number of households with income $10k - 20k:| Lake Quinault: | 3.5% (9,314) |
| Washington: | 3.5% (9,873) |
Number of households with income $20k - 30k:| Lake Quinault: | 2.9% (7,879) |
| State: | 2.9% (8,352) |
Number of households with income $30k - 40k:| Lake Quinault: | 4.0% (10,769) |
| State: | 4.0% (11,415) |
Number of households with income $40k - 50k:| Lake Quinault: | 4.0% (10,774) |
| Washington: | 4.0% (11,421) |
Number of households with income $50k - 60k:| Lake Quinault: | 4.2% (11,415) |
| Washington: | 4.2% (12,100) |
Number of households with income $60k - 75k:| Lake Quinault: | 6.3% (16,889) |
| State: | 6.3% (17,903) |
Number of households with income $75k - 100k:| Lake Quinault: | 10.4% (27,984) |
| Washington: | 10.4% (29,663) |
Number of households with income $100k - 125k:| Lake Quinault: | 9.4% (25,319) |
| State: | 9.4% (26,839) |
Number of households with income $125k - 150k:| Lake Quinault: | 8.5% (22,830) |
| State: | 8.5% (24,200) |
Number of households with income $150k - 200k:| Lake Quinault: | 12.6% (33,941) |
| State: | 12.6% (35,976) |
Number of households with income > $200k:| Lake Quinault: | 29.2% (78,405) |
| Washington: | 29.2% (83,109) |
Median per capita income in Lake Quinault in 2022:| Lake Quinault: | $119,679 |
| State: | $67,666 |
Income statistics for Hispanic or Latino residents
Median household income in Lake Quinault, WA in 2022:| Lake Quinault: | $56,799 |
| State: | $74,770 |
Change in median household income between 2000 and 2022:| Lake Quinault, Washington: | +93.4% |
| State: | +128.3% |
Number of households with income < $10k:| Lake Quinault: | 4.9% (6,437) |
| Washington: | 4.9% (14,456) |
Number of households with income $10k - 20k:| Lake Quinault: | 5.3% (6,930) |
| State: | 5.3% (15,449) |
Number of households with income $20k - 30k:| Lake Quinault: | 6.8% (8,966) |
| State: | 6.8% (20,016) |
Number of households with income $30k - 40k:| Lake Quinault: | 7.7% (10,107) |
| Washington: | 7.7% (22,548) |
Number of households with income $40k - 50k:| Lake Quinault: | 7.3% (9,638) |
| State: | 7.3% (21,450) |
Number of households with income $50k - 60k:| Lake Quinault: | 7.7% (10,179) |
| State: | 7.7% (22,744) |
Number of households with income $60k - 75k:| Lake Quinault: | 10.4% (13,724) |
| State: | 10.5% (30,737) |
Number of households with income $75k - 100k:| Lake Quinault: | 14.9% (19,564) |
| State: | 14.9% (43,843) |
Number of households with income $100k - 125k:| Lake Quinault: | 11.1% (14,592) |
| State: | 11.1% (32,554) |
Number of households with income $125k - 150k:| Lake Quinault: | 7.4% (9,666) |
| State: | 7.4% (21,624) |
Number of households with income $150k - 200k:| Lake Quinault: | 7.3% (9,560) |
| State: | 7.3% (21,360) |
Number of households with income > $200k:| Lake Quinault: | 9.2% (12,103) |
| State: | 9.2% (27,055) |
Aggregate household income in Lake Quinault in 2022: $1,350,866
Median family income in Lake Quinault in 2022:| Lake Quinault: | $51,430 |
| Washington: | $76,866 |
Number of families with income < $10k:| Lake Quinault: | 4.8% (1) |
| State: | 4.4% (9,443) |
Number of families with income $10k - 20k:| Lake Quinault: | 8.6% (2) |
| State: | 3.5% (7,524) |
Number of families with income $20k - 30k:| Lake Quinault: | 11.2% (2) |
| Washington: | 5.6% (12,052) |
Number of families with income $30k - 40k:| Lake Quinault: | 10.0% (2) |
| State: | 8.3% (17,803) |
Number of families with income $40k - 50k:| Lake Quinault: | 13.0% (3) |
| State: | 7.7% (16,361) |
Number of families with income $50k - 60k:| Lake Quinault: | 4.6% (1) |
| State: | 7.9% (16,852) |
Number of families with income $60k - 75k:| Lake Quinault: | 12.4% (3) |
| State: | 11.4% (24,342) |
Number of families with income $75k - 100k:| Lake Quinault: | 13.6% (3) |
| State: | 14.4% (30,698) |
Number of families with income $100k - 125k:| Lake Quinault: | 11.0% (2) |
| State: | 11.4% (24,331) |
Number of families with income $125k - 150k:| Lake Quinault: | 6.5% (1) |
| Washington: | 7.5% (16,099) |
Number of families with income $150k - 200k:| Lake Quinault: | 4.2% (1) |
| Washington: | 8.2% (17,551) |
Median non-family income in Lake Quinault in 2022:| Lake Quinault: | $55,565 |
| State: | $54,173 |
Change in median non-family income between 2000 and 2022:| Lake Quinault, Washington: | +93.3% |
| State: | +105.8% |
Median per capita income in Lake Quinault in 2022:| Lake Quinault: | $11,973 |
| Washington: | $28,252 |
Change in median per capita income between 2000 and 2022:| Lake Quinault, Washington: | +92.9% |
| Washington: | +150.2% |
Income statistics for American Indian and Alaska Native residents
Median household income in Lake Quinault, WA in 2022:| Lake Quinault: | $35,083 |
| State: | $71,255 |
Change in median household income between 2000 and 2022:| Lake Quinault, Washington: | +75.4% |
| State: | +118.1% |
Number of households with income < $10k:| Lake Quinault: | 5.9% (543) |
| State: | 5.9% (1,768) |
Number of households with income $10k - 20k:| Lake Quinault: | 9.0% (830) |
| State: | 8.9% (2,694) |
Number of households with income $20k - 30k:| Lake Quinault: | 8.0% (734) |
| State: | 8.0% (2,412) |
Number of households with income $30k - 40k:| Lake Quinault: | 7.7% (711) |
| State: | 7.7% (2,327) |
Number of households with income $40k - 50k:| Lake Quinault: | 5.9% (543) |
| State: | 5.8% (1,755) |
Number of households with income $50k - 60k:| Lake Quinault: | 7.5% (691) |
| State: | 7.5% (2,259) |
Number of households with income $60k - 75k:| Lake Quinault: | 8.8% (815) |
| Washington: | 8.8% (2,669) |
Number of households with income $75k - 100k:| Lake Quinault: | 12.7% (1,175) |
| State: | 12.8% (3,861) |
Number of households with income $100k - 125k:| Lake Quinault: | 12.0% (1,109) |
| State: | 12.0% (3,618) |
Number of households with income $125k - 150k:| Lake Quinault: | 8.6% (792) |
| State: | 8.6% (2,580) |
Number of households with income $150k - 200k:| Lake Quinault: | 5.9% (542) |
| Washington: | 5.9% (1,774) |
Number of households with income > $200k:| Lake Quinault: | 8.0% (742) |
| State: | 8.1% (2,447) |
Aggregate household income in Lake Quinault in 2022: $1,214,419
Median family income in Lake Quinault in 2022:| Lake Quinault: | $24,567 |
| State: | $79,010 |
Median non-family income in Lake Quinault in 2022:| Lake Quinault: | $31,688 |
| Washington: | $35,591 |
Change in median non-family income between 2000 and 2022:| Lake Quinault, Washington: | +58.4% |
| Washington: | +61.8% |
Median per capita income in Lake Quinault in 2022:| Lake Quinault: | $34,069 |
| State: | $27,053 |
Income statistics for Multirace residents
Median household income in Lake Quinault, WA in 2022:| Lake Quinault: | $24,188 |
| Washington: | $84,303 |
Change in median household income between 2000 and 2022:| Lake Quinault, Washington: | +75.9% |
| State: | +125.7% |
Number of households with income < $10k:| Lake Quinault: | 4.3% (2,216) |
| Washington: | 4.3% (12,040) |
Number of households with income $10k - 20k:| Lake Quinault: | 6.6% (3,395) |
| Washington: | 6.6% (18,437) |
Number of households with income $20k - 30k:| Lake Quinault: | 5.2% (2,679) |
| State: | 5.2% (14,559) |
Number of households with income $30k - 40k:| Lake Quinault: | 6.7% (3,404) |
| Washington: | 6.7% (18,491) |
Number of households with income $40k - 50k:| Lake Quinault: | 6.3% (3,214) |
| State: | 6.3% (17,459) |
Number of households with income $50k - 60k:| Lake Quinault: | 6.9% (3,512) |
| Washington: | 6.9% (19,086) |
Number of households with income $60k - 75k:| Lake Quinault: | 9.1% (4,660) |
| State: | 9.1% (25,310) |
Number of households with income $75k - 100k:| Lake Quinault: | 13.5% (6,900) |
| Washington: | 13.5% (37,493) |
Number of households with income $100k - 125k:| Lake Quinault: | 10.7% (5,451) |
| State: | 10.7% (29,626) |
Number of households with income $125k - 150k:| Lake Quinault: | 8.6% (4,399) |
| Washington: | 8.6% (23,899) |
Number of households with income $150k - 200k:| Lake Quinault: | 10.2% (5,195) |
| State: | 10.2% (28,214) |
Number of households with income > $200k:| Lake Quinault: | 11.9% (6,063) |
| State: | 11.9% (32,947) |
Aggregate household income in Lake Quinault in 2022: $1,418,541
Median family income in Lake Quinault in 2022:| Lake Quinault: | $48,551 |
| State: | $95,629 |
Median non-family income in Lake Quinault in 2022:| Lake Quinault: | $46,023 |
| State: | $56,573 |
Median per capita income in Lake Quinault in 2022:| Lake Quinault: | $16,362 |
| State: | $32,496 |
Change in median per capita income between 2000 and 2022:| Lake Quinault, Washington: | +127.6% |
| Washington: | +156.8% |
Income statistics for other residents
Aggregate household income in Lake Quinault in 2022: $408,363
Median family income in Lake Quinault in 2022:| Lake Quinault: | $38,544 |
| State: | $72,588 |
Median per capita income in Lake Quinault in 2022:| Lake Quinault: | $9,398 |
| State: | $27,542 |
Change in median per capita income between 2000 and 2022:| Lake Quinault, Washington: | +74.3% |
| Washington: | +167.8% |