Lane, Oklahoma (OK) income map, earnings map, and wages data

Data:
The per capita income in 2022 was $32,892, which means an increase of 60.7% compared to 2000 when it was $12,919.
Whole page based on the data from 2000 / 2022 when the population of Lane, Oklahoma was 414 / 318
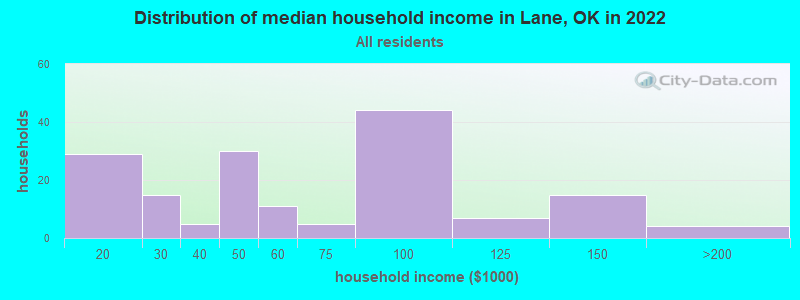
Income statistics for all residents
Number of households with income < $10k:| Lane: | 0.0% (0) |
| Oklahoma: | 6.4% (100,950) |
Number of households with income $10k - 20k:| Lane: | 17.6% (29) |
| State: | 8.8% (137,709) |
Number of households with income $20k - 30k:| Lane: | 9.1% (15) |
| State: | 9.1% (143,661) |
Number of households with income $30k - 40k:| Lane: | 3.0% (5) |
| State: | 9.0% (141,098) |
Number of households with income $40k - 50k:| Lane: | 18.2% (30) |
| State: | 8.9% (140,217) |
Number of households with income $50k - 60k:| Lane: | 6.7% (11) |
| State: | 8.1% (126,882) |
Number of households with income $60k - 75k:| Lane: | 3.0% (5) |
| State: | 10.0% (157,916) |
Number of households with income $75k - 100k:| Lane: | 26.7% (44) |
| Oklahoma: | 12.4% (195,015) |
Number of households with income $100k - 125k:| Lane: | 4.2% (7) |
| Oklahoma: | 9.0% (141,779) |
Number of households with income $125k - 150k:| Lane: | 9.1% (15) |
| State: | 5.8% (91,594) |
Number of households with income $150k - 200k:| Lane: | 2.4% (4) |
| State: | 6.3% (98,589) |
Number of households with income > $200k:| Lane: | 0.0% (0) |
| Oklahoma: | 6.2% (97,770) |
Aggregate household income in Lane in 2022: $11,113,133
Median family income in Lane in 2022:| Lane: | $80,241 |
| Oklahoma: | $75,476 |
Number of families with income $10k - 20k:| Lane: | 5.2% (6) |
| State: | 4.9% (49,571) |
Number of families with income $30k - 40k:| Lane: | 4.1% (5) |
| State: | 7.5% (76,467) |
Number of families with income $40k - 50k:| Lane: | 22.1% (27) |
| State: | 8.3% (84,578) |
Number of families with income $50k - 60k:| Lane: | 9.6% (12) |
| State: | 7.8% (79,642) |
Number of families with income $60k - 75k:| Lane: | 4.2% (5) |
| State: | 10.6% (108,169) |
Number of families with income $75k - 100k:| Lane: | 34.0% (42) |
| State: | 14.6% (148,857) |
Number of families with income $100k - 125k:| Lane: | 5.7% (7) |
| State: | 11.2% (113,480) |
Number of families with income $125k - 150k:| Lane: | 11.8% (15) |
| State: | 7.6% (77,253) |
Number of families with income $150k - 200k:| Lane: | 3.3% (4) |
| Oklahoma: | 8.4% (85,947) |
Median income for 3 person families:| Lane: | $91,660 |
| State: | $78,963 |
Median non-family income in Lane in 2022:| Lane: | $19,219 |
| State: | $35,419 |
Change in median non-family income between 2000 and 2022:| Lane, Oklahoma: | +62.4% |
| Oklahoma: | +83.2% |
Median per capita income in Lane in 2022:| Lane: | $32,893 |
| Oklahoma: | $32,930 |
Income statistics for White residents
Number of households with income < $10k:| Lane: | 0.0% (0) |
| State: | 5.5% (60,994) |
Number of households with income $10k - 20k:| Lane: | 17.0% (23) |
| Oklahoma: | 8.2% (91,263) |
Number of households with income $20k - 30k:| Lane: | 7.4% (10) |
| State: | 8.7% (96,988) |
Number of households with income $30k - 40k:| Lane: | 3.7% (5) |
| Oklahoma: | 8.4% (93,121) |
Number of households with income $40k - 50k:| Lane: | 20.7% (28) |
| Oklahoma: | 8.6% (95,446) |
Number of households with income $50k - 60k:| Lane: | 5.2% (7) |
| State: | 7.9% (87,723) |
Number of households with income $60k - 75k:| Lane: | 3.7% (5) |
| Oklahoma: | 9.9% (109,955) |
Number of households with income $75k - 100k:| Lane: | 26.7% (36) |
| State: | 12.9% (143,880) |
Number of households with income $100k - 125k:| Lane: | 5.2% (7) |
| Oklahoma: | 9.7% (107,851) |
Number of households with income $125k - 150k:| Lane: | 10.4% (14) |
| State: | 6.3% (69,802) |
Number of households with income $150k - 200k:| Lane: | 0.0% (0) |
| Oklahoma: | 6.9% (76,863) |
Number of households with income > $200k:| Lane: | 0.0% (0) |
| State: | 7.0% (78,099) |
Aggregate household income in Lane in 2022: $8,922,208
Median family income in Lane in 2022:| Lane: | $89,342 |
| Oklahoma: | $82,251 |
Number of families with income $10k - 20k:| Lane: | 1.1% (1) |
| State: | 4.1% (29,440) |
Number of families with income $30k - 40k:| Lane: | 4.7% (5) |
| State: | 6.5% (46,540) |
Number of families with income $40k - 50k:| Lane: | 26.9% (26) |
| State: | 7.7% (55,082) |
Number of families with income $50k - 60k:| Lane: | 7.3% (7) |
| State: | 7.5% (53,408) |
Number of families with income $60k - 75k:| Lane: | 5.0% (5) |
| State: | 10.4% (74,624) |
Number of families with income $75k - 100k:| Lane: | 33.7% (33) |
| Oklahoma: | 15.3% (109,679) |
Number of families with income $100k - 125k:| Lane: | 7.0% (7) |
| State: | 12.0% (86,208) |
Number of families with income $125k - 150k:| Lane: | 14.2% (14) |
| State: | 8.3% (59,328) |
Median non-family income in Lane in 2022:| Lane: | $18,500 |
| Oklahoma: | $36,941 |
Change in median non-family income between 2000 and 2022:| Lane, Oklahoma: | +57.2% |
| State: | +83.5% |
Median per capita income in Lane in 2022:| Lane: | $36,573 |
| State: | $37,390 |
Income statistics for Hispanic or Latino residents
Aggregate household income in Lane in 2022: $379,660
Median per capita income in Lane in 2022:| Lane: | $20,597 |
| State: | $19,473 |
Income statistics for American Indian and Alaska Native residents
Median per capita income in Lane in 2022:
Income statistics for Multirace residents
Median household income in Lane, OK in 2022:| Lane: | $55,622 |
| State: | $53,626 |
Number of households with income < $10k:| Lane: | 0.0% (0) |
| Oklahoma: | 6.8% (11,975) |
Number of households with income $10k - 20k:| Lane: | 20.0% (7) |
| State: | 8.9% (15,797) |
Number of households with income $20k - 30k:| Lane: | 20.0% (7) |
| State: | 10.2% (18,071) |
Number of households with income $30k - 40k:| Lane: | 0.0% (0) |
| State: | 11.0% (19,477) |
Number of households with income $40k - 50k:| Lane: | 0.0% (0) |
| Oklahoma: | 9.3% (16,501) |
Number of households with income $50k - 60k:| Lane: | 17.1% (6) |
| State: | 8.9% (15,635) |
Number of households with income $60k - 75k:| Lane: | 0.0% (0) |
| State: | 10.9% (19,250) |
Number of households with income $75k - 100k:| Lane: | 28.6% (10) |
| Oklahoma: | 11.5% (20,279) |
Number of households with income $100k - 125k:| Lane: | 0.0% (0) |
| State: | 8.0% (14,067) |
Number of households with income $125k - 150k:| Lane: | 0.0% (0) |
| State: | 4.9% (8,612) |
Number of households with income $150k - 200k:| Lane: | 14.3% (5) |
| Oklahoma: | 5.0% (8,897) |
Number of households with income > $200k:| Lane: | 0.0% (0) |
| State: | 4.5% (7,970) |
Aggregate household income in Lane in 2022: $2,517,459
Median family income in Lane in 2022:| Lane: | $77,111 |
| Oklahoma: | $62,946 |
Number of families with income $10k - 20k:| Lane: | 27.5% (8) |
| State: | 6.9% (8,220) |
Number of families with income $50k - 60k:| Lane: | 18.8% (5) |
| Oklahoma: | 7.7% (9,220) |
Number of families with income $75k - 100k:| Lane: | 36.0% (10) |
| Oklahoma: | 13.1% (15,759) |
Number of families with income $150k - 200k:| Lane: | 17.6% (5) |
| State: | 6.3% (7,594) |
Median per capita income in Lane in 2022:| Lane: | $24,274 |
| State: | $23,085 |